Rep:Mod:KL1713MgO
Introduction
This experiment will involve studying the thermal expansion of an MgO crystal through a computational analysis. The computation will examine the phonon dispersion and energy by using two models; quasi-harmonic approximation and molecular dynamics. Both models will provide a way to calculate the vibrations and free energy of magnesium oxide (MgO) which will be used to observe how the crystal expands through a series of temperatures. The models will allow calculation of the thermal expansion coefficient and the results will be compared.
Thermal Expansion
The motivation behind this experiment involves understanding that thermal expansion plays a key role in large structures such as bridges, roads and other constructions. Due to changes in temperature throughout the year, it is important to know how these constructions will respond to these changes; in order to maintain a strong build. Thermal expansion is where materials expand when being heated resulting in a change of its shape, area and volume. The increase in temperature causes an increase in the potential energy, which results in larger vibrations, which lead to an increase in the average intermolecular separation.
Quasi-Harmonic approximation (QHA)
As mentioned earlier, the two models used were the quasi-harmonic approximation (QHA) and the molecular dynamics model (MD). The former is a phonon based model which is used to describe volume dependent thermal effects. The QHA is based on the harmonic phonon model and contains an additional anharmonic factor to depict a more accurate representation of the potential. The harmonic phonon model describes the potential energy as a perfectly quadratic function which has a major drawback in the fact that it can not describe thermal expansion, since no change in temperature will effect the equilibrium distance between atoms. For that reason the QHA includes that temperature can effect the intermolecular distances between atoms since in reality molecules do have an associated anharmonic factor, which in turn allows the investigation of thermal expansion. Additionally, the model contains descriptions of phonons which is a quantum of vibrational mechanical energy and fundamentally they are lattice vibrations with particle like properties. A final comment is to know that the the vibrations oscillate in one dimension and the free energy is calculated by a sum of the vibrational modes over all energy bands.
Molecular Dynamics
The Molecular Dynamics approach uses Newtonian mechanics to simulate the motion of atoms from interatomic forces. Hence, a set of velocities and positions of atoms must be given to provide the necessary information in order for the MD computation to propagate from the initial conditions by iterating over an algorithm with a set time step. Using Newton's second law of motion that F = ma (F = force, m = mass, a = acceleration) the acceleration of atoms is calculated and thus new velocities and positions are determined.
Software
In order to carry out the computation the programs used were RedHat Linux, DLVisulaize (DLV) and General Utility Lattice Program (GULP), where DLV acted as a graphical interface for the simulations. GULP is used to perform a variety of simulations on materials using boundary conditions. This experiment will prominently use 3D lattice dyanmics. Finally RedHat Linux is an operating system which acts as a platform for numerical calculations and simulations.
The Internal Energy of an MgO crystal

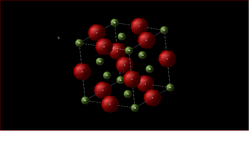
In this section the internal energy of an MgO crystal will be calculated, but in order to do this it is important to define the crystal structure. The MgO crystal is held together by ionic forces of Mg2+ and O2-. Figures 1 and 2 show the primitive and conventional unit cells respectively. The primitive cell is the simplest cell to represent a crystal and therefore only consists of 2 atoms (1 Mg atom and 1 O atom). Table 1 shows the cell vectors of the primitive cell.
| 0.00000 | 2.10597 | 2.10597 |
|---|---|---|
| 2.10597 | 0.00000 | 2.10597 |
| 2.10597 | 2.10597 | 0.00000 |
In addition to this, it has been found that the primitive cell in Figure 1 has a rhombohedron shape where the lattice constant a = 2.9783 Å (a=b=c) and an internal angle of α = 60° (α=β=γ). The calculation performed here correlates very well with the literature value attained through LCAO HF calculations giving a lattice constant of a = 2.573 Å.[1] Figure 2 showing the conventional unit cell allows extraction of extra information that the structure of the crystal is face centered cubic (FCC) where the lattice constant a = 4.212 Å and an internal angle of α = 90°. With comparison to literature results the correlation is once again almost exact with a lattice constant of a = 4.211 Å.[2] A conventional cell is the simplest cell where the lattice vectors are along the lattice point axes. In addition it has 4 times the volume of the primitive cell therefore contains 4 Mg and 4 O atoms. This representation is also most widely used due to it depicting the symmetry of the MgO structure more accurately.
From examination of the log file the total energy of the MgO crystal is also retrieved. The value of the internal energy of the MgO lattice is -41.0753 eV per primitive unit cell at 0 K. This value represents the energy required to pull the atoms from equilibrium to infinite separation.
The Phonon Modes of MgO
In this section the phonon modes of MgO are represented by the dispersion curve and density of states.
The Phonon Dispersion Curves

Figure 3 shows the phonon dispersion curve of MgO as computed using GULP. The phonons are computed at 50 points along the conventional path in k-space. The special symmetry points along the path in k-space are labelled by , , , , and , as seen on the x-axis. The crystal lattice has an infinite number of vibrations and for each vibration it is possible to label it with a k-vector which has relation to the direction and wavelength. From direct observation it can be seen that there are 6 phonon modes, 3 of which are optical and 3 are acoustic. Optical phonon modes are out of phase movements, where one atoms moves one way and its neighbouring atoms moves in the opposite direction upon excitation. For instance each postive Mg2+ ion would move in the positive x-direction whilst the O2- anion would move in the negative x-direction, and hence resulting in a vibrating crystal. The number of optical modes is given by 3N-3 where N = number of atoms in the unit cell, in this case N = 2. The acoustic vibrations are in phase movements of atoms, it results in some atoms being close together whilst others are far apart. The relation of the wavelength () and the wave vector k is , this shows that when the wavelength (m-1) approaches infinity, k tends to a value of 0. This shows that for the in phase acoustic vibrations the wavelength will tend to infinity which results in k tending to 0 at . From this information it then becomes clear that the symmetry points , and are the three acoustic modes which can then be categorized as either transverse or longitudinal. For the example of MgO there is one longitudinal mode and two degenerate transverse modes (at ).
The Phonon Density of States (DOS)
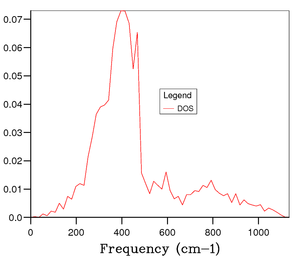
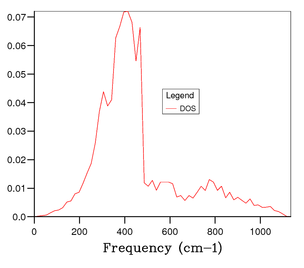
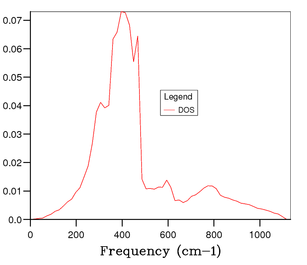
The density of states (DOS) describes the number of electronic states per energy interval. The following graphs show a series of plots of the density of states which were obtained through understanding that the DOS is merely an integration of the phonon energy dispersion at infinitesimal increments of energy. Therefore when relating the DOS to the dispersion curve the most valuable information is obtained from the flat regions of the dispersion curve where the gradient is 0, giving the point where the vibrational density of state is highest for a specific value of k. In order to have a more detailed computation, ideally, using an infinitely large grid would yield accurate representations, however due to expense and computation time this is impractical. Therefore in order to find the grid size which is most cost efficient, whilst still giving detailed and accurate data, four grid sizes were sampled to calculate the DOS. The grid sizes were 1x1x1, 14x14x14, 15x15x15 and 25x25x25.
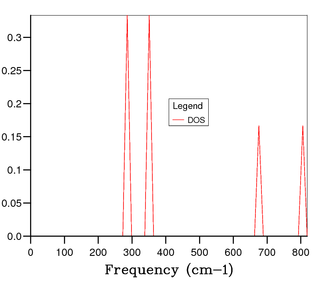
Figure 4 shows the phonon DOS for a 1x1x1 grid at one k value of k = 1/2, 1/2, 1/2 (kx, ky kz). Since there are 6 phonon modes one would expect to see 6 peaks in the phonon DOS, however from observation it is clear that there are 4 distinct peaks corresponding to 4 discrete vibrational modes, and through comparison with the phonon dispersion curve in figure 3, it is apparent that this is due to symmetry point . The noticeable peaks are at 286 cm-1, 351 cm-1, 676 cm-1 and 806 cm-1. This means there is some degeneracy between certain phonon modes as discussed earlier. Additionally, it can be understood that due to the bands merging together they become degenerate, thus the intensity of peaks is likely to be different; resulting in a weighting of the intensities to 0.333:0.333:0.167:0.167 which is a 2:2:1:1 ratio. The peaks at 286 cm-1 and 351 cm-1 have double the intensity of the peaks at 676 cm-1 and 806 cm-1.[3] This therefore confirms that the phonon DOS of the 1x1x1 grid at k = 1/2, 1/2, 1/2 is shown by symmetry point . Continuing the analysis through studying figures 5, 6, and 7, one can see that more peaks arise and a continuous, smoother curve is resolved. Through thorough analysis of the smaller grid sizes it can be seen that the 14x14x14 grid shows the curve going through the x-axis resulting in a loss of information. This can of course be explained due to the number of k values sampled being too low. At the larger grid sizes of 15x15x15 and 25x25x25 this does not occur and so the number of k values sampled is sufficient. As mentioned earlier, the computation becomes more expensive in terms of time and cost as the grid size increases; hence, the 15x15x15 grid size is optimal to gain the most accurate information for the purposes of this computation. At 25x25x25 the amount of information gained is minimal and the computation time is higher and therefore it is unnecessary to perform calculation to that level of accuracy.
The Free Energy using the Quasi-Harmonic Approximation (QHA)
| Grid Size | Helmholtz Free Energy/eV | Accuracy |
| 1x1x1 | -40.93030 | 0.1 eV |
| 2x2x2 | -40.92661 | 0.1 eV |
| 3x3x3 | -40.92643 | 1 meV |
| 4x4x4 | -40.92645 | 0.5 meV |
| 8x8x8 | -40.92648 | 0.5 meV |
| 16x16x16 | -40.92648 | 0.1 meV |
| 32x32x32 | -40.92648 | N/A |
In this section the free energy of MgO will be calculated through taking into account the quasi-harmonic approximation which will compute the free energy through a sum over all the bands and k-labels of the crystal.
Table 2 shows how free energy varies with grid size, from direct analysis it is clear that as the grid size is increased the accuracy also increases which complements the results from the analysis of the phonon density of states curves. Through the 7 different grid sizes as the size increases it can also be seen that the Helmholtz free energy has a slight decrease. This can be rationalised by two equations, the Boltzmann equation - (S = entropy, kB = Boltzmann Constant, W = number of microstates) and the equation for thermodynamic free energy (A = Helmholtz free energy, U = internal energy and T = temperature). As the grid size increases the number of microstates increases which results in an increase in the entropy, in turn resulting in a larger more negative 'TS' term (T = 300 K), hence, the Helmholtz free energy decreases.
The Optimal Grid Size for CaO, Faujasite and Lithium
From the discussion of MgO it was concluded that the optimal grid size was 16x16x16 from a free energy perspective, from this, comparison can be made to other similar oxides. For instance CaO (Ca2+ and O2-) which is very similar to the structure of MgO. Therefore, you could hypothesise that the optimal grid size for CaO would also be 16x16x16. From literature it has been found that the lattice constant for CaO is a = 4.800 Å and this compares well with the value of a = 4.211 Å for MgO.[1] In addition, it is important to know that if a cell is large in real space it will be small in reciprocal space (k-space), and vice versa. Since MgO and CaO have similar cell sizes in real space, the grid size of 16x16x16 for calculations of DOS regarding CaO can be justified well. Further to this, for structures such as that of Lithium (Li+ cations surrounded by a sea of electrons) they would need a larger grid size since in real space its cell is small; hence the cell size in reciprocal space will be large and thus need a larger number of k values for accurate calculation of DOS.[4] Conversely, Zeolite structures can be much larger, specifically Faujasite, where the lattice constant can range from a = 24 – 25 Å. Hence, from a similar hypothesis you would expect it to have a smaller cell size in reciprocal space, resulting in a smaller grid size to reach a similar degree of accuracy and computation time to that of MgO at 16x16x16.[5]
Thermal Expansion of MgO
This section will involve using the QHA to optimise and compute the free energy of MgO at a range of temperatures (0 - 1000 K in steps of 100 K). To do this a graph of free energy vs temperature and of lattice constant vs temperature will be plotted. Through analysis of these graphs it will develop understanding of the thermal expansion of MgO. The thermal expansion coefficient will be computed and compared to literature results. In order to calculate the Helmholtz free energy in the QHA the following expression is used:
where = frequency of the vibration, = zero point energy, = Temperature, = Boltzmann Constant and = reduced Planck's constant. The equation can be split into three terms, the first being the zero point energy, the second being the energy with the harmonic contribution and the final being the entropic contribution to the vibrational energy. It works by summing over all vibrational bands and all points then you have calculated a sum over all energy levels, thus can compute the free energy of the crystal. In addition, the thermal expansion coefficient can be calculated through using:
where is the volume of the crystal, = Temperature, = the rate of change of volume with temperature, whilst pressure is held constant.
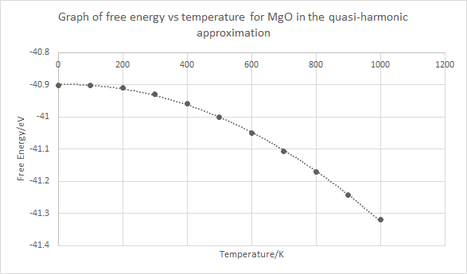
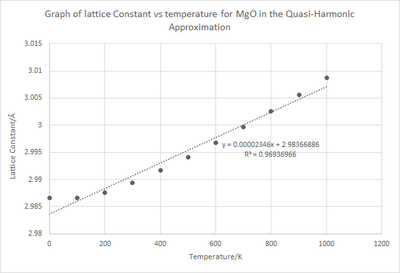
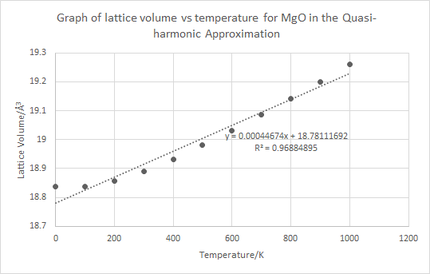
Figures 8, 9 and 10 show various things. Firstly, figure 8 describes how the free energy depends on temperature, from analysis of the graph it is clear that as temperature increases the free energy becomes more negative (increases in magnitude). This trend becomes apparent from the third term in the Helmholtz free energy which is the entropic contribution since it is the only term which has a strong temperature dependence. As the temperature increases the contribution of that third term becomes significantly more negative resulting in an overall lowering of the free energy. To explain this physically as temperature increases the thermal population of phonons in higher states also increases.
Calculation of the Thermal Expansion Coefficient
The Linear Thermal expansion coefficient:
K-1
Where L0 is the lattice constant at 0 K and is the gradient of the curve in figure 8.
The Volumetric Thermal expansion coefficient:
K-1
where is the gradient of the curve in figure 10.
From calculation it can be seen that . This relationship is not purely coincidental but becomes explanatory when realising that MgO is an isotropic material. Although it is not exactly 3 times larger, this difference can be accounted for by the crude approximations taken in this computation. From literature the measured = 7.39 x10⁻⁶ K-1 which is comparable to the value calculated of 7.852 x10⁻⁶ K-1.[1] The difference can once again be explained by the limitations of the theory. Additionally, a literature value for reported a figure of 3.12 x10⁻⁵ which is higher than the value calculated above. The value is expected to be higher in literature due to the QHA not taking into account the anharmonicity and phonon interactions to a significant level.[6]
The main approximations of the computation are to do with the contributions of anharmonic motion to harmonic contributions. This is important to know since as the system is subjected to higher temperatures, the anharmonic factor becomes significant. In conjunction with this, other approximations such as the Born-Oppenheimer approximation is also used which allows the separation of nuclei and electron motion due to the difference in mass, but once again at high temperatures this motion can not be separated since the motion of nuclei becomes important. Hence, when the temperature approaches to 2800 °C (melting point of MgO) the ascertained description of the phonon modes will not represent the actual motion of ions.
Finally, in a diatomic molecule with perfect harmonic motion the bond length should not change with temperature due to the symmetry of the harmonic potential (quadratic). However the vibrational amplitude would increase but it would still oscillate about its mean bond length.
Molecular Dynamics
This section will involve studying MgO through the use of molecular dynamics simulations. It provides a path to a more accurate description of the crystal since a 32x32x32 super-cell is used which will contain 32 MgO units as opposed to 1 MgO unit in the primitive cell in the quasi-harmonic model.
 |
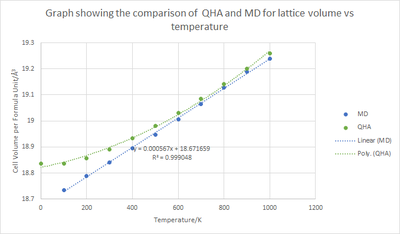 |
As explained in the introduction, molecular dynamics calculations take a more classical approach by using Newton's second law of F = ma. Due to this, the energy can be calculated through the equipartition principle and the number of degrees of freedom to give that . Through increasing the temperature the energy would increase linearly as shown by the blue curve in figure 11. A distinct difference can be seen between the curve calculated through MD and the other through QHA where a linear decrease should be seen.
Calculating the thermal expansion coefficient for the cell volume per formula unit yields = 2.89 x 10⁻⁵ K-1 (QHA) and = 3.00 x 10⁻⁵ K-1 (MD). The calculated coefficients are through the temperature range of 400 - 1000 K, it is clear that both coefficients are very similar since they are of the same order of magnitude. The difference can be accounted by the fact that the values for differ between each calculation.
Another discrepancy observed is that for MD, the curve is almost exactly linear, whereas for the QHA curve, between 0 - 400 K there is a change of gradient. From comparison with literature the QHA approach seems to depict the graph very well at both high and low temperatures. Therefore proving that the more accurate approach is ascertained through the quasi-harmonic approximation. Additionally, the QHA curve is shown through a complex polynomial in contrast to the simple y = mx +c equation produce by the MD approach. The absence of this information at low temperatures in the MD calculation is due to the simplicity of the model to predict the motion of ions.
Limitations
Both models have their advantages but also their drawbacks. For instance, the quantum mechanical descriptions are virtually absent since both models describe the atoms through a classical approach (i.e. ions are hard charged spheres). In addition, the models only consider atoms which are close together (e.g. the nearest neighbours), therefore limiting the accuracy of each model.
Furthermore, an important point to make is that when the temperature reaches close to the melting point of MgO, the accuracy diminished. This is due to the fact that when MgO melts, the representation can not be modelled through an infinitely periodic unit cell; due to the absence of long range order.
Conclusion
To conclude, the objective of investigating the phonon dispersion and thermal expansion of MgO through the QHA and MD approach in a detailed but concise manner has been successful. Thermal expansion coefficients were calculated using both models and it was found that at low temperatures the QHA approach was more accurate due to the more useful vibrational descriptions. However, neither model could predict what would happen at the melting point of MgO due to the reasons discussed.
In terms of further work simulations can be carried out on calcium oxide, faujasite and lithium to give supplementary confirmation of the optimal grid size. Additionally the elasticity and piezoelectric coefficients could be determined to understand more about the thermodynamic properties of MgO.
References
- ↑ 1.0 1.1 1.2 O. Madelung, U. Rössler, M. Schulz. . Springer Berlin Heidelberg;1999: p2-3. DOI: 10.1007/10681719_224
- ↑ U. Rössler, R. Blachnik, Springer, Berlin, 1999, pg. 4-6
- ↑ R. Hoffmann, Angew. Chem. Int. Ed. Engl., 1987, 56, pp 846-878; DOI: 10.1002/anie.198708461
- ↑ M. Nadler and C. Kempfer, Anal. Chem., 1959, 31, 2109
- ↑ J. Weitkamp and L. Puppe, Catalysis and Zeolites, Springer Berlin Heidelberg, Berlin, 1999, 311
- ↑ B. B. Karki, R. M. Wentzcovitch, S. de Gironcoli, S. Baroni, Phys. Rev. B, 2000, 61, pg. 8793; DOI: 10.1103/PhysRevB.61.8793

