Rep:Mod:KK98631
Introduction
The aim of this experiment is to model the thermal expansion of an MgO crystal when heated. This is achieved by firstly modelling the crystal system as a face-centered cubic lattice, which is analogous to that of Rock-salt, NaCl. For this type of crystal structure, due to its 1:1 cation: anion ratio, both ions form separate fcc lattice sites with the two lattices intersecting to form a checker-board pattern. This can alternately be viewed as one fcc lattice of Mg2+ ions, with all octahedral hole sites occupied by an O2- ion. This hole filling is typical of an ionic system where ions are modelled as hard-spheres and the anion:cation size ratio is between 0.414-0.732, of which is a geometric constraint. Crystal structures are defined such that a unit cell of a finite number of atoms has translational symmetry such that the entire lattice structure and properties can be defined from it. The initial task facing us is determining how many atoms actually lie inside each MgO unit cell. For a conventional fcc unit cell there exists an atom on each corner, in the middle of each face and on each edge. To consider this, it is seen for the fcc conventional cell:
Each corner atom, of which there are 8, exists in 8 different unit cells and therefore each contributes 1 atom to the unit cell- 8 x (1/8).
Each face atom, of which there are 6, exists in 2 different unit cells and therefore each contributes 3 atoms to the unit cell- 6 x (1/2).
Each edge atom, of which there are 12, exists in 4 different unit cells and therefore each contributes 4 atoms to the unit cell- 12 x (1/4).
Therefore in total there are 8 atoms per conventional unit cell.
The conventional unit cell has lattice parameters: a=b=c, is cubic and therefore internal angles α=β=γ=90o. This unit cell is related to the lattices primitive unit cell- a rhombohedron, as its lattice parameter ap= ac diagonal x 1/2, lattice internal angles=60o, and has a quarter of the volume and only 2 atoms per unit cell. Using a conventional cell is useful as it more easily depicts the overall lattice structure symmetry. It is key to note that all properties of the unit cell, primitive or conventional etc, are extensive and linked by their density ratios, which for the macroscopic crystal must must equivalent. This allows easy conversion between values calculated for different types of unit cells.
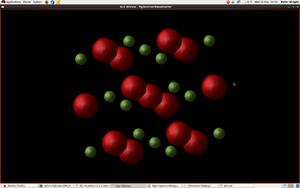
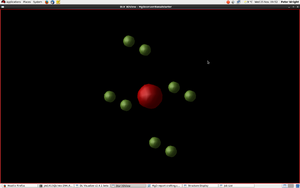
To analyse how the lattices crystal structure undergoes thermal expansion, we utilise RedHat Linux to use modelling software- DLV, which has the ability to construct and visualize crystals, surfaces and molecules, and GULP, which has the ability to perform simulations using boundary conditions on 3D solid structures. In this experiment a simple Buckingham repulsive potential, shown below, for the ion interactions is imputed in the simulations. This potential constitutes an exponential repulsive term, Morse-like attractive term and a general ionic Coulombic attraction term. This potential is a simplification of the Lennard-Jones potential with an additional ionic electrical potential term. Buckingham saw the exponential term as a necessity to model the repulsion due to interpenetration of closed electron shells, of which at short inter-ionic distances would dominate the interaction. This term is taken into account in the an-harmonic approximation as it provides a term to describe the systems behavior alongside the simplistic harmonic motion, a 1st term Taylor approximation, and causes vibrational frequencies to become volume dependent. This dependance is given by the modes Grueneisen parameter, a natural logarithmic derivative of mode frequency with respect to the change in volume.
To model the thermal expansion of the lattice, we utilise the quasi-harmonic approximation (QHA) to model the vibrations of the ionic bonds within it. This is because atomic vibrations contribute to a solids thermal properties, and the equilibrium bond distances and hence unit cell volume are dependent upon temperature. The QHA describes such volume-dependent thermal effects by taking into account a weak an-harmonicity of the system. However it is noted that it is based on the assumption that the harmonic oscillator holds for all lattice constant sizes and is therefore a quantum model [1]. Using the Lennard-Jones potential it is seen for vibrations that at low amplitudes are harmonic in nature. In this case individual vibrations can be expressed as the superposition of independent normal models, each being a linear harmonic oscillator. Each mode can be expressed in terms of a wave vector k, with a periodic direction in space, a. In reality the vibrations are of finite amplitude and are not purely harmonic, but have some an-harmonic character. This contributes to the thermal expansion of the MgO crystal. An ideally harmonic solid (1D) would observed zero thermal expansion.
This approach is then compared to that from to a more rigorous methodology, Molecular Dynamics, within the same potential model; this takes into account time, and models the system in the [N, P, T] ensemble using Newton's laws of motion. This is more accurate way to model lattice bond vibrations whilst also allowing volume to vary and is a classical model.
In this experiment vibrational superposition's, otherwise known as phonon's are modelled and analysed in reciprocal k space, and different k-points which segregate vibrations modes via n x n x n grids. Geometry optimisation is then undertaken to minimise the free energy of the lattice with respect to its unit cell lattice parameters, and the system is modelled with varying temperature. Note that all models are run for the stress free lattice state, whereby P=O Bar such that the linear thermal expansion coefficient can be calculated with the following equation:
- Note: All values computed are reported to 6 decimal places for consistency.
Intro theory & Calculating the phonon dispersion and DOS curves
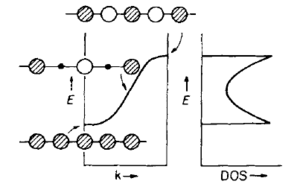
As a generalization we chemists find it easier to visualise the solid state in terms of orbitals. We model each lattice site within a unit cell as an orbital and then utilise the crystals translation symmetry. Lattice point indexes at n=0,1,2,3...,lattice parameter a, and k the wave vector are defined. The process of symmetry adaptation of the resulting LCAO wave-function produces a Bloch function for the lattice. Bloch's theory is central to band theory and this experiment as it states that any observable property is invariant as one goes from one atom to the next.The unique values of k lie in the interval -π/a≤k<π/a and is called the first Brillouin zone, and form the reciprocal k-space. The number of k values is simply equal to the number of translations in the MgO crystal structure, which is essentially infinite. Because we are modelling a macroscopic crystal the number of orbitals overlapping produces a band structure. Furthermore the allowed values of k are equally spaced in k-space and we can then plot the band-structure for the lattice: E(k) vs. k, in the Brilliouin zone.The highest occupied MO is called the Fermi energy level. It must be noted that k is more than simply a translational symmetry label, but is also a node counter for the band and a wave vector.

We have already noted that for a large crystal structure there are a very large number of energy levels. In fact if there are n AO's per unit cell and there are N unit cells in our lattice, then the total number of energy levels is n x N, a very large number considering N=NA. Because of this it is not possible to single out the FO of the system. We therefore think about groups of levels. This is done by grouping levels in given energy intervals in k-space. As MgO is a 3D lattice we consider a grid of n x n x n to yield the DOS curve. The magnitude of which at a particular k-interval is negatively proportional to the magnitude of slope of the dispersion curve/band-structure. Therefore the flatter the dispersion in the interval the greater the DOS is within it. As can be seen from the picture depicting this relationship, each K value corresponds to a particular energy state. It should be noted that the DOS curve serves as a return from k-space to normal space.
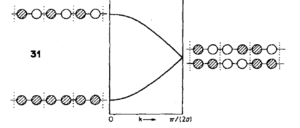
However in the model used so far the choice of unit cell size has been arbitrarily set. If this is doubled from a to 2a, the length of the Brillouin zone in recipricol k-space halves in size. Therefore we now have two ways of representing the same orbitals. The path taken was arbitrary but has the significant consequence of a folding on the dispersion curve. This folding increases as the unit cell size is increased and leads to branches, these are by convention named optical (folded) and acoustic. These phonon types are mathematically linked by the dispersion relationship where the + sign represents the optical modes and - sign the acoustic modes. The parameter a represents the translational periodicity and k is the wave vector, as seen before
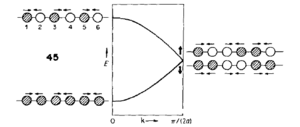
Note that acoustic phonon's refer to coherent movements of the atoms/ions of the lattice out of their equilibrium positions. However optical phonon's refer to out of phase movement of atoms/ions and require the smallest unit cell to contain 2 or more different atoms/ions. Optical phonon types require the primitive unit cell to contain more than one atom/ion. Furthermore it is interesting to understand that an acoustic phonon with infinite wavelength across the unit cells will correspond to a simple displacement of the whole crystal and have zero energy and frequency. Additionally it is key to understand that if the primitive unit cell contains different ion/atom types manifests in an energy gap between optical and acoustic phonons at the edges of the Brillouin zones and hence a loss of degeneracy.
Relating this theory to phonon's is easily done by considering that each k value is equivalent to an energy level, we can also relate them to the infinite combination of extended vibrational modes in each unit cell. The length of vibration a, is now equal to the wavelength of the vibrational modes, these are sinusoidal in shape and the energies are analogous to that of the MO's. And analogously nodes exist at the boundary of the Brillouin zones. Note phonons as well as MO's are a result of quantised energy levels and are only taken into account in quantum models such as in the QHA, but not classical models like MD.
To explain the concept of k-space in 3D we treat k as a vectors kx, ky and kz. The space of allowed k, of which we can sample with a path to plot a dispersion curve, is now a volumetric Brillouin zone. We integrate across this volume in order to accurately calculat thermodynamic properties. Certain values of k are given names: Γ = (0,0,0) the zone center, X = (π/a,0,0), (0,π/a,0) and (0,0,π/a), M = (π/a,π/a,π/a) from the high symmetry, special points scheme of Monkhorst and Pack [1].
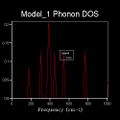
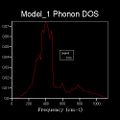
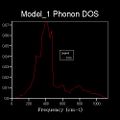
It is difficult to show the energy levels E(k) for all k, so the vibrations for the transitionally symmetric lattice conventional unit cell of MgO we choose to sample Npoints=50 along the specified path defined by W->L->G->X->W->K where:W (0.5, 0.25, 0.75), L (0.5,0.5,0.5), G (0,0,0), X (0.5, 0, 0.5), W (0.5,0.25,0.75) and K (0.375, 0.275, 0.75), in the allowed k-space, given by the arbitrary recipricol translational vectors ax, ay and az across a unit cell of constant size. These yield the single k-point (0.5, 0.5, 0.5), L, for the 1x1x1 grid, and four peaks can be seen along the sampled L value in recipricol space in the dispersion curve, this translates to 4 distinct peaks in the corresponding DOS plot. The dispersion curve describes the relationship between the frequency of a phonon and its wave number and is defined by the path taken in k-space and the 50 points sampled along it and the 3N=6 frequencies that go with each k-point in 3D and the corresponding degenerate state folding effects. For the 1x1x1 grid in a unit cell of MgO there are two vibration modes per axis, one symmetric and one anti-symmetric. Therefore there are six total vibrational modes, of which there are two pairs of degenerate vibrations. This is visualised on the DOS's four peaks and two are twice as intense as the others. The frequency of these peaks, which correspond to phonon modes, are as follows: 288.49 288.49 351.76 351.76 676.23 818.82 (cm-1). Three of these are optical and three are acoustic branches .By comparing this set of frequencies to the dispersion curve log file, it is found that the k-point=L is being examined, as was predicted.
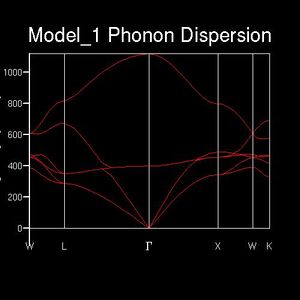
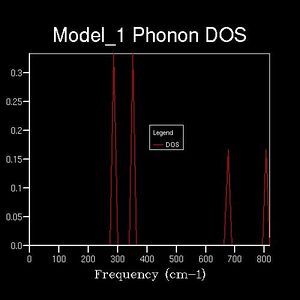
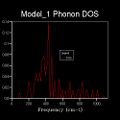
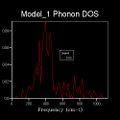
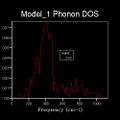
As discussed beforehand, the DOS is proportional to the slope of the dispersion curve. However a 1x1x1 grid only samples 50points at a single k-value that lands on one of these points, at L, the number n of the grid is referred to as the shrinking factor. This is because for n=1 the unit cell being analysed is split in half along each translational axis. However there is only one intercept of these lines which gives the k-point sampled, which itself corresponds to only a single phonon mode, leading to four sharp frequency peaks. Therefore the DOS which plots frequencies detected versus the weighting of each frequency detected is not sampling a sufficient number of phonon modes to give an appropriate representation of the phonon densities. Therefore increasing shrinking factors are tested until the DOS curve smooths out and converge to a point where it is essentially unchanging. This occurred at n=17, as it yields a much denser grid of k-points sufficient for a good DOS plot for the system. This evolution was analysed for n=1,2,4,6,8,12,16,17,18,20 and is summarised below. The reason the DOS smooths and converges is because more k-points are being sampled and fall along the 50 points path in the k-space. For example 2x2x2 generates 8 k-points and 3x3x3 generates 27.This results in more data being produced and this impacts on the overall DOS average weighting for each k-point. The dispersion curve and sampled path are independent of grid density, as we increase the shrinking factor past 17, the number of k-points falling along the path and curve converges and such does the DOS and therefore is gives a reasonable approximation. This is done because of the trade-off between the no. of k-points sampled along the path, and the CPU time needed to calculate these. Ideally the grid density would be infinite but this is not practical as it would take an infinite amount of time. It should be noted that at each k-point there remains 6 vibrational modes, but the frequencies of these change depending on the specific k-point, therefore the best data for comparison is for the shrinking factors 1,2,4,8 and 16 as the original k points remain sampled in the denser grids.
(Gallery 1: DOS curves for the shrinking factors; 2, 4, 6, 8, 16, 17, 20)
This relationship between the dispersion curve, defined by the path specified by 50 equally spaced points, and the DOS plot, which takes into account the k-values from the grid that fall on this path, converge. It is seen that up a grid shrinking factor of 17 a sufficiently large extra number of k-points were being sampled along the path. This meant that more individual phonon modes, defined by their wave vectors, and their frequencies were taken into account when weighting the DOS plot in direct space. However larger, denser grids above this value don't change this significantly as the MgO primitive unit cell sampled has a high symmetry space group- 225 and only six phonon modes, has most of its non-degenerate phonon states already sampled and weighted accordingly in the DOS. This is visualised by comparing the n=17 and n=20 DOS plots and the lack of change that occurs between them. To conclude the DOS is related to the dispersion curve as it results from weighting all the phonon modes and their vibrational frequencies that are detected in the sample.
Calculating the free energy
As mentioned in the introduction, for sufficiently small amplitude vibrational oscillations the harmonic oscillator model can be used to describe the lattice phonon modes. However some an-harmonicity which results in temperature dependance of the unit cell volume, we consider the quasi-harmonic approximation and calculate the free energy using the following equation:
where U is the internal lattice energy, EZP is the vibrational zero-point energy of the lattice, T is the absolute temperature, V is the volume and S is the entropy due to the vibrational degrees of freedom. The specific definition of the volume is of no particular importance, as long as the definition is used consistently throughout. It can be the volume per primitive unit cell, volume per conventional unit cell, or even molar volume. This choice does not affect the following in any way.
The zero-point energy term equals
where k is the wave vector, i denotes a phonon band, h is Planck's constant and νk,i(V) is the frequency of a phonon with wave vector k at volume V.
The entropy term equals
where kB is the Boltzmann constant. The frequency ν as a function of k. Note that for a constant value of V, these equations corresponds to that of the harmonic approximation. [2]
The shrinking factor is increased until the free energy remains a constant value to four decimal places. This occurs when the shrinking factor is equal to sixteen and it is equal to -40.9268eV. Up until 100K it is seen that the free energy increases sharply on the 10-6 scale but then plateaus rapidly at 200K. The reduction in free energy is purely due to an optimisation of the unit cells free energy with respect to the lattice parameters- constant and internal angles and is demonstrated in the plot below.

| K-grid shrinking factor | Helmholtz free energy (eV) |
|---|---|
| 1 | -40.930301 |
| 2 | -40.926609 |
| 4 | -40.926450 |
| 6 | -40.926471 |
| 8 | -40.926478 |
| 12 | -40.926481 |
| 16 | -40.926482 |
| 17 | -40.926482 |
| 18 | -40.926483 |
| 20 | -40.926483 |
(Table 1: Shrinking factor magnitude vs. free energy optimized)
The free energy of the system becomes more positive with temperature because increasing the k-grid density, increases the number phonon frequencies sampled. Referring to the equation for the ZPE given about, the summation doesn't take into account the DOS frequency weighting factors and as such will only become more positive. As all other energy contributions to the free energy are fixed as the system is independent of the shrinking factor this change in the ZPE yields the above trend.
As seen from the data the value of the optimised free energy to 6 decimal places is -40.926483eV. This value is converged upon as the grid is sampling enough k-points/phonon modes, along our dispersion curve path and translating that to the DOS to yield a good approximation for the vibrational contribution to the free energy. The actual variation in free energy between k=1 and k=20 is not large and accounts for roughly 0.9328% of the total free energy. This is because the main contributions to the free energy, monopole interactions and inter-atomic potentials, given by the Buckingham potential remain the same in our model. On comparison with the previous section where a qualitative approach was used to determine the optimal grid size that would be a good approximation to an infinite lattice, free energy convergence to 5.d.p demonstrates this occurs at roughly the same size.
It is seen that a grid size of shrinking factor equal to 2 is required for accurate calculations up to uncertainties of +/-1meV.
Furthermore a shrinking factor of 4 is required for an accuracy of +/-0.5meV.
Finally a shrinking factor 12 is required for an accuracy of +/-0.1meV.
Computing accurate DOS and Helmholtz free energies for other crystal types
| Crystal | Conventional unit cell | Space group | 1st coordination sphere |
|---|---|---|---|
| MgO | FCC | 225 | Oh |
| CaO | FCC | 225 | Oh |
| Li | BCC | 227 | Td |
| Faujasite | Cubic hexoctahedral | 16 | Td (extended) |
(Table 2: Crystal types for comparison and their general spacial properties)
General
A crystal structures unit cell space group indicates the extent of symmetry and extent of coordination it possesses. A higher symmetry the unit cell, when relating phonons to orbital overlaps as done in the the first section, would give rise to more degenerate MO's and therefore less non-degenerate vibrational modes. By translational symmetry this is related to the number of non-degenerate phonon modes across the unit cells. Therefore a higher symmetry unit cell, which generally coincides with a smaller primitive unit cell, gives rise to a lesser variety of phonon modes that can be exited. This is visualised on the dispersion curves whereby more phonon modes converge at become one band.
By comparison, for a larger primitive unit cell containing more atoms will have a dispersion curve with far more branches. This is because the number of acoustic branches for a lattice is 3, but the number of optical branches varies; 3N-3. This means that for a single k-point more frequencies are being sampled and this yields a better DOS approximation and a faster convergence for a fixed grid size.
From the relationship of the dispersion curve to the DOS, lower symmetry and a larger primitive unit cell means a less dense grid, with a smaller shrinking factor, would be needed to sample an adequate number of phonon modes to produce a relatively accurate approximation, as this is a weighted average of more frequencies per phonon sampled.
DOS calculations
CaO
Calcium oxide has exactly the same primitive unit cell and space group as MgO and therefore the same number of vibrational modes, 3N=6 (3D), and therefore same dispersion curve branches. However the vibrational frequencies of CaO are systematically smaller than those of MgO. This is easily evidenced by looking at the QHA relation between phonon frequency and variables such as unit cell mass and force constant. CaO is heavier and has a weaker bond that MgO, both of these factors lead to systematically lower phonon frequencies and is visualised by comparing their dispersion curves [2]. This argument explains the similarity of their thermal expansivities’s at ambient conditions despite the smaller values of CaO’s vibrational frequencies as seen in literature. [4] Furthermore this means that the density of grid size needed for calculations on MgO will be adequate for CaO.
Li
Li has only one atom in its primitive unit cell and therefore there will only be 3 distinct phonon branches, of which none are optical (3N-3=0), in the dispersion curve. Furthermore, Li crystals bcc conventional unit cell has lower coordination than that of MgO means more vibrational modes in the cell and therefore phonon modes in the crystal are degenerate. The consequence of this is seen on Li's dispersion curve whereby far more branches converge into one band [5] and means that more k-points are required to sample distinct phonon modes vibrational frequencies need to be sampled for a good DOS approximation along the dispersion curve path and therefore a more dense grid/larger shrinking factor is needed than was used for MgO.
Faujasite-zeolite crystal type
Faujasite crystals have a far higher degree of coordination in their unit cell than MgO or Li crystal structures and consists of a sodalite cage. The unit cell cubic but is far more complex than for MgO/Li. Unit cell lattice constants range from a = 24.2-25.1Å and consists of 192 corner-sharing AlO4 and SiO4 tetrahedra (T-atom) joined into 3-dimensional frameworks [6]The symmetry and orbital overlaps associated with this structure are vast and result in an extensive band structure and many more distinct optical phonon modes. This is quantified by identification that the primitive (non-cubic) unit cell contains 48-T atoms and therefore the dispersion curve will contain 3(48x4)-3 optical phonon's.This results in a much less dense k-grid being needed to approximately sample Faujasites dispersion curve vibrational mode frequencies along the W->L->G->X->W->K path to produce a DOS representative of the crystal structure.
Free energy calculations
By similar argument, as the free energy calculated using the QH approximation relies upon the DOS curve calculated for a lattice the more complex Faujasite lattice would again need a less dense k-grid than MgO, CaO a similar one and Li a more dense grid. This is because the phonon modes and their internal vibrational frequencies come from the DOS and are used to compute the vibrational contribution to the lattice free energy. Therefore for a larger, lower symmetry unit cell less of these modes need to be sampled for an accurate picture of the total contribution to be obtained.
The thermal expansion of MgO
(Gallery 2: Free energy and lattice constant vs. temperature plots)
Computing the results required GULP free energy optimisation with respect to MgO's lattice parameters in the temperature range 0-1000K. This is quantitatively found to be a second order polynomial relationship with an R2=0.9996. This trend is in part due to the entropic term of the free energy and the vibrational contribution derived from statistical thermodynamics shown above. Both factors increase in importance as temperature increases and are dominated by a logarithmic term. This leads to decreasing free energy and the resulting curve shape. The entropic term is related to the thermal expansion permitted by the QHA approximation and causes the unit cell volume to increase. Therefore the thermal expansion effects on the lattice constant were the inverse as it increased with a polynomial dependence with an R2=0.9969. This is expected as the volume increases with temperature as higher energy phonon modes are occupied in the QHA model used.
Due to the an-harmonicity of lattice ion interactions, as thermal energy rises by equivalency so does the average system kinetic energy. This causes the individual amplitude of ion vibrations, in an an-harmonic potential well, about their lattice points to increase causing the equilibrium bond distance to shift as ions spend more time at distances greater than it. This increased ionic bond distance results in an overall volumetric increase of the primitive unit cell known as thermal expansion. This explains why the lattice constant, a, increases gradually. Analogously the free energy decreases as the bond distance between ions increases and vibrational mode frequency decreases. This reduces the vibrational contribution which in tandem with an increased entropic contribution to the free energy cause it to become more negative. The vibrational contribution to the Helmholtz free energy is derived from the statistical thermodynamic relation between free energy and the vibrational partition function.

As referred to in the introduction; vibrations of individual atoms in solids are not independent from each other. The coupling of atomic vibrations of adjacent atoms results in waves of atomic displacements. Each wave is characterized by its wavelength and frequency. For a wave of a given frequency ν, there is the smallest “quantum” of vibrational energy, hν, called phonon. Thus, the thermal energy is the energy of all phonon's present in the crystal at a given temperature. As we first consider a harmonic oscillator for the individual vibrations where phonon vibrations are independent of volume, however this is a bad approximation as rising temperature results in the increase of the average amplitude of atomic vibrations. For a an-harmonic potential, this corresponds to the increase in the average value of inter-atomic separation resulting in the thermal expansion seen in the table above. This relates back to the shape of the harmonic oscillator potential surface where the equilibrium bond distance remains constant even as higher level vibrations, or phonon's for the solid-state are occupied. However the asymmetry of the potential surface is accounted for in the QHA, due to the fact it takes into account some terms for an-harmonic behavior of the physical crystal system. Thermal expansion is related to the asymmetric shape of inter-atomic potential. If the inter-atomic potential is symmetric, the average value of inter-atomic separation does not change, and no thermal expansion occurs.
This phenomenon would occur for a diatomic molecule with an ideal harmonic potential simply because a change in vibrational excitation does not shift the equilibrium bond distance and this constraint is fixed as the molecule is finite and distinct. It cannot couple vibrational modes with another diatomic molecule as there is no interaction possible and no an-harmonic behaviour arises. This is different however for a macroscopic crystal such as MgO when it is appropriate to account for an-harmonicity by taking into account thermal expansion along the translationally symmetric crystal structure.

The plot of thermal expansion effects on the MgO primitive unit cell volume under isobaric conditions fits a quadratic polynomial very well with R2 = 0.99702 which is much more precise than its 0.9688 linear dependance. The quadratic trendline yields V=0.0027T2 + 0.0119T + 18.807. Differentiating this yields (dV/dT) = 0.0054T + 0.0119. By inputting individual temperature values into this equation and dividing by the initial cell volume, the thermal expansion coefficient for each specific temperature is found and compared with literature values [7]. However values obtained were many orders of magnitude bigger than expected, therefore mirroring literature methods and how the expansion was computed, a linear approach was taken; dT=100K intervals, for example 600K, sample 500-600K, and the values obtained were in much better accordance with literature.
The initial volume of the crystal measured at 0K whereby no phonon modes are exited, expect those of the ZPE, a consequence of Heisenberg's uncertainty principle, was equal to 18.83649Å3. It is seen that no expansion occurs in the 0-100K temperature range. This is because phonon modes take a finite amount energy to excite and this is not achieved in this range.
| Temperature (K) | Helmholtz free energy (eV) | Lattice constant, a (Å) | Final unit cell volume (Å3) | Thermal expansion coefficient (x10-6K-1) | Literature values (x10-6K-1) | Percentage error (%) |
|---|---|---|---|---|---|---|
| 0 | -40.8953494 | 2.986563 | 18.836494 | 0.000000 | - | |
| 100 | -40.90242 | 2.986563 | 18.836494 | 0.000000 | 2.10 | |
| 200 | -40.909377 | 2.987605 | 18.856202 | 10.460011 | 7.39 | 41.542625 |
| 300 | -40.928125 | 2.98939 | 18.890025 | 17.956096 | 10.4 | 72.653846 |
| 400 | -40.958594 | 2.99163 | 18.932508 | 22.553553 | ||
| 500 | -40.999436 | 2.994135 | 18.980112 | 25.272742 | ||
| 600 | -41.049315 | 2.996821 | 19.031223 | 27.134022 | ||
| 700 | -41.107119 | 2.999644 | 19.085059 | 28.580681 | ||
| 800 | -41.171892 | 3.002589 | 19.141318 | 29.867014 | ||
| 900 | -41.243018 | 3.005636 | 19.19964 | 30.962759 | ||
| 1000 | -41.319848 | 3.008785 | 19.260044 | 32.067529 |
(Table 3: Comprehensive QHA data for thermal expansion)
The values of α calculated show a linear increase in thermal expansion with temperature which is to be expected as higher frequency phonon's are exited. However upon comparison to literature the values obtained computationally are consistently lower, this is due to the approximations assumed in their calculation. The QHA assumes an-harmonicity of volume-dependent effects, but only of thermal expansion, it does not however take into account phonon-phonon interactions [8]. It assumes a phonon from a given state defined by a wave vector k and branch j has an infinite lifetime. However in a real system phonon branches in a dispersion curve will be seen to decay into other phonon's after a finite time. Interactions such as the three phonon interaction whereby a phonon decays to form two other phonon's and vice-verse. This allows for lower frequency phonon states to be occupied, this decreases the an-harmonicity in the system leading to decreased thermal expansion. [9]. The prominence of phonon-phonon interactions increases with temperature and explains the increased percentage error from 200-300K.
QHA an-harmonicity is quantified in the results where, as stated previously, all energy contributions, axial monopole and potential energies, to the free energy are relatively fixed over the temperature range except that of the vibrational contribution which decreased with a significant percentage change as temperature increased. The decrease is vibrational contribution is a result of the QHA taking into account vibrations in an an-harmonic potential well which manifests in a volume-dependent thermal expansion. It is well known that an increase in volume leads to phonon frequency dampening from Badgers rule [10] relating the force constant of a bond to the equilibrium bond length.Therefore this quantitative change useful to explain the effects of an-harmonicity, such that the bond length increases at higher vibrational excitations, leading to a reduced force constant and therefore vibrational frequency overall for the crystal.
| Temperature (K) | Vibrational contribution to free energy (eV) |
|---|---|
| 0 | 0.167523 |
| 100 | 0.171971 |
| 200 | 0.165028 |
| 300 | 0.146061 |
| 400 | 0.115122 |
| 500 | 0.073558 |
| 600 | 0.022708 |
| 700 | -0.036324 |
| 800 | -0.102648 |
| 900 | -0.175554 |
| 1000 | -0.254460 |
(Table 4: QHA Vibrational contribution to the free energy vs. temperature)
An interesting phenomenon occurs near the Tm of the MgO crystal, 3125.15K. As this temperature is approached the disorder of the system increases to such an extent that so called 'soft-phonon' modes where a phonon mode, which coincides with a lower short-range unit cell symmetry crystal structure is amplified immediately before the onset of a phase transition, such as melting. The increased disorder tends to increase the size of the unit cell and lead to a loss of long-range translational symmetry between unit cells because the equilibrium point of every ion which was originally restricted to a specific point on the unit cell can now diffuse anywhere in the crystal. Effectively the force constant which defines the potential energy surface tends to zero leading to reduced phonon frequencies. The QHA and Buckingham potential used to model the MgO crystal to generate phonon modes can no longer describe the ion motions as they enter this phase transition behaviour. This is because soft phonon's, which are closely related to the symmetry of the crystal before and after the transition, in which the phonon frequencies tend to zero as the phase transition is approached [11]. The phonon modes therefore offer no information on the actual ionic motion occurring. To summarise the aperiodic diffusion of atoms has replaced the vibrations of atoms causing the frequency of the band center tends to zero and the inter-ionic bonds to break. The QHA cannot model this as it relies upon a harmonic approximation which only holds at small vibrational amplitudes, at higher temperatures only high amplitude vibrations occur and also means the bonds never break and frequencies can never be equal to zero. Furthermore a discontinuity would be expected at Tm, this would be absent from the QHA data because as stated, it cannot model bond breaking.
Molecular dynamics simulation and comparison
Molecular dynamics(MD) was inferred to provide a computational comparison to the data obtained using the quasi-harmonic approximation. MD like the QHA utilises a Buckingham intramolecular interaction potential between Mg2+ and O2- atoms positioned in lattice sites corresponding to an fcc unit cell. However the main difference between these two methods is that MD is a deterministic method and relies on the integration of Newton's equation of motion to generate trajectories for each ion in the lattice over time. This was achieved in the [N,P,T] ensemble such to allow V to vary so that thermal expansion of the lattice could be modelled. Furthermore a larger supercell MgO system was modelled, this consisted of a conventional cell replicated twice along each translational axis and is 32 times larger than the primitive unit cell modelled using the QHA. This larger system was required as MD requires a large number of ensemble configurations for a good average approximation. This allows for many more ion trajectories to be modelled as they evolve with time, such that the weighing of realistic configurations dominate. Furthermore the model takes into account periodic unit cell boundary conditions and a minimum image as this saves CPU time but still affords a good extended lattice approximation.
As MD requires dynamic ion movement to calculate trajectories, results are not obtainable at 0K as individual ions are static and fixed exactly on their respective lattice points. However the temperature range 100-1000K was modelled successfully and the resulting data, corrected for the factor of 32 size cell size difference (x1/32), is shown in the table below. Note that the data obtained was a time average, therefore it is imperative to make sure the temperatures modelled converged on interval 100K values required. The data used is from the most extensive average (end of log file) and the corresponding temperature average is shown alongside these. Initial primitive unit cell volume was obtained from the 100K data set prior to its thermal expansion and is equal to 18.680416Å3 for an ideal MgO lattice.
| Temperature (K) | Avg Temperature for data | Helmholtz free energy (eV) | Thermal expansion coefficient (x10-5K-1) | MD Final cell volume (Å3) | QH Final cell volume (Å3) | Percentage error (%) |
|---|---|---|---|---|---|---|
| 100 | 99.9272170 | -41.02379966 | 2.660543 | 18.73479047 | 18.836494 | 0.539928 |
| 200 | 200.092465 | -40.9711610 | 5.048072 | 18.76648872 | 18.856202 | 0.475775 |
| 300 | 299.443104 | -40.92053459 | 8.575836 | 18.82574875 | 18.890025 | 0.340265 |
| 400 | 399.808169 | -40.86580341 | 9.785669 | 18.86239703 | 18.932508 | 0.370321 |
| 500 | 500.060039 | -40.81190334 | 14.69993 | 18.93731750 | 18.980112 | 0.225470 |
| 600 | 599.690361 | -40.76318166 | 17.56925 | 18.99207513 | 19.031223 | 0.205703 |
| 700 | 699.763073 | -40.71002559 | 20.85071 | 19.05706556 | 19.085059 | 0.146677 |
| 800 | 800.100875 | -40.65877972 | 24.52304 | 19.09880538 | 19.141318 | 0.222099 |
| 900 | 900.810325 | -40.60435716 | 26.02192 | 19.17240122 | 19.199640 | 0.141871 |
| 1000 | 1000.423794 | -40.54937209 | 28.23286 | 19.2577705 | 19.260044 | 0.011804 |
(Table 5: MD comprehensive data table for thermal expansion and comparison with QHA)
The volume of the MgO primitive unit cell predicted by MD produces a similar upward trend with that of the QHA demonstrating a consistency between them. However the values of predicted MD systematically lower than that of the QH approximation. This difference is small with a maximum percentage error of 0.54%, but is in part due to the way methods model the MgO cell as described beforehand, MD being a deterministic method and QHA being stochastic. The large percentage error for the initial volumes of the systems modelled is due to the fact that MD is a classical model and does not take into account a ZPE as it is a quantum effect, which by Plank's law will only be observed for small systems. Not taking this into account disregards some atomic vibration in the unit cell and hence causes the volume to be lower in MD simulations, however the significance of this factor decreases with temperature contributing to a lower percentage error. This also explains why the initial Helmholtz free energy from MD is more negative in magnitude as there is no vibrational contribution.
More precisely, by looking at how the difference in predicted values for the expansion it is seen that the percentage difference generally increases as the temperature of the system decreases. The QHA is found to be a good approximation when compared to literature, and MD at low temperatures is inaccurate. This is due to the Ergodic hypothesis and the kinetics of the system. At low temperatures the time scale of runs =500fs is far too small comparatively. However at higher temperatures the system kinetics (Arrhenius) in relation to MgO's potential surface is a better match with the sample time, meaning MD is a better approximation at higher system temperatures and tends to the real system values. It is important to realise that the two model values are not tending toward each other at 1000K but merely intercepting on account of the curve shapes, QHA being quadratic and MD being linear.

The general linear thermal expansion coefficient predicted by MD over the 100-1000K temperature range is α = 3.099501x10⁻⁶K-1, with R2 = 0.992362 linear dependance, however of even greater prominence is the individual values seen, these are all at least one order of magnitude too great. This is more pronounced deviation from literature and greater in magnitude than that predicted when using the QHA. This result is interesting as it concludes that the rate of expansion predicted by MD is greater than that predicted by the QHA even though the values for the volume expanded to are systematically lower. This is because the QHA underestimates the an-harmonic effects, such as phonon-phonon interactions (which require further in-depth discussion), and therefore unit cell volumetric expansion as temperature increases. This is because it only takes into account a shifting equilibrium bond length but maintaining a perfectly symmetrical harmonic potential environment. In contrast MD does not include any of these approximations that limit the volumetric expansion and therefore has a computes a larger thermal expansion coefficient.
However as seen before the thermal expansion coefficients need to be calculated for individual expansions not over an entire range i.e the plot gradient. For QH approximation results this gave results of maximum 41.5% error, but was of the same order. In contrast MD results were at least a whole order of magnitude different which raises concerns over the methods accuracy for modelling MgO. This is due to the way MD configurations and averages are calculated. Firstly a large system size is needed to compute the free energy accurately as when calculating ensemble averages we have to take into account model axioms. Thermodynamic properties such as the Helmholtz free energy will fluctuate as they are directly dependent on the system volume which was not specified as fixed in the ensemble [N,P,T]. These fluctuations take on the form of a Gaussian distribution and therefore these fluctuations decrease with increasing system size ~ 1/√ N. Because of this relation a large unit cell is required for accurate MD computation of the free energy and the supercell used which contains N=64 lattice points, compared to 2 in the primitive cell and 8 in the conventional cell. This system size however is too small for accurate ensemble averaging.
To improve the accuracy of the QHA method a larger k-grid was required to produce a large enough sample population of phonon frequencies. Sampling an increased number of k-points in reciprocal space is equivalent to sampling for cells in direct space. Therefore by comparison a large no. of cells are required for more accurate MD calculations. It was found that a grid size of 17x17x17 was required for an accurate DOS to compute the free energy and thermal expansion coefficient when compared to literature for the QH approximation of a primitive unit cell. To improve the MD calculation and reduce fluctuations a large system size of 17x17x17/4 (conventional to primitive atom correction factor of 4) is needed by comparison as this would also increase the sample population. Therefore from experience accurate MD calculations require a supercell of 1229 conventional unit cells.
Furthermore the time scale of the runs was only 500fs (500 x1fs time-step) which is very short. This factor, like the system size, are key as the Ergodic hypothesis states that for a sufficiently large number of sampled configurations the average of a property over the ensemble is equivalent to the time average. The number of sampled configurations is dependent on system size and the time frame. If addition MgO's potential energy landscape is sufficiently rough, the time taken to transition between different states, given by the Arrhenius equation, will be far slower than the time frame used for the MD simulation and would not give an accurate ensemble average of the thermodynamic properties- Helmholtz free energy and thermal expansion. More simply, to make statistically valid conclusions from the simulations, the time span simulated should match the kinetics. This is not the case for the time scale used or system size and therefore is the reason for the difference in results compared to the QHA. Finally the method time-step is constrained to an upper limit such that phonon frequencies can be sampled. From the dispersion curve with a optimal 17x17x17 grid, the highest frequency vibration was 898.74cm-1, this corresponds to 3.709986x10⁻¹⁰s validating the time-step used.
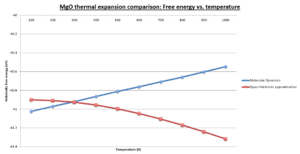
The plot above shows relation between unit cell Helmholtz free energy and temperature is reversed for MD when compared to the QHA. MD data predicts increasingly more positive values of the free energy as temperature increases, whereas QHA predicts the opposite. Differences in inter-atomic potential fields can be excluded as both the QHA and MD use the same Buckingham potential. The trend is explained by considering the two models fundamentally. As mentioned in the introduction MD is a classical model and QHA is a quantum model based of the harmonic oscillator. The free energy in MD is wholly dependent on the thermal energy (3/2KBT) and its equivalence to the average kinetic energy of the ions. This relation is simple and demonstrates that as temperature increases so does the systems energy. By comparison in QHA we consider entropic effects which cause the free energy to decrease with temperature. The trend is therefore model dependent.
The QHA is only reasonable at low temperatures because it models the MgO unit cell vibrations as a shifting parabolic potential surface. As temperature increases this constraint becomes limiting as it can only increase the equilibrium bond distance and cell volume, and decrease phonon frequencies. It does not however model the inter-atomic potential bond breaking and diffusive behaviour of ions, and therefore breaks down at Tm. In contrast MD is not limited by potential energy surface constraints, but requires a large supercell lattice, where realistic conditions apply, to model this phase transition behaviour, such as a discontinuity in the volume of the unit cell. This is because it requires a large number of ions and system degrees of freedom to obtain an accurate ensemble average approximation due to the increased unit cell volume. It must be noted that even large MD cells have modelling limitations at the phase transition due to hysteresis effects [12]. This describes the discrepancies that occur for the model cell, for example temperature, when compared to the bulk system.
Both MD and the QHA model a unit cell which undergoes thermal expansion and therefore as its volume increases with temperature as seen in the comparison plot. As has been discussed, as the system tends to Tm the unit cell expands and so-called soft phonon modes occur. These phonon's take into account how Mg2+ and O2- vibrations tend to diffusive motion near the melting point phase transition and the frequency of these phonon's tends to zero as the unit cell expands and loses symmetry. The consequence of such is an extended loss of translational symmetry as the crystal tends to a liquid with a macroscopic unit cell volume encompassing all ions.
Conclusion
Calculations have been performed on an MgO lattice using a classical model, MD and a quantum model, QHA. Thermodynamic properties such as the Helmholtz free energy and thermal expansion coefficient were calculated in the QHA by integrating over a Brillouin volume of a primitive unit cell in reciprocal k-space. GULP was used to optimise the unit cell with respect to its lattice parameters and then produce a dispersion curve with a phonon DOS. To save CPU time a qualitative DOS test was inferred to determine roughly at what density k-grid density enough vibrational phonon modes as to yield results that converged on those for an infinite MgO lattice, this occurred at a shrinking factor of 17. However qualitatively calculating free energy convergence determined 12 as an adequate shrinking factor yielding A= -40.926483eV to an accuracy of +/-0.1meV.
The main differences between the models were demonstrated when calculating the thermal expansion of MgO. For QHA and MD this was achieved in 100K intervals as this was how the computation was undertaken and linearity was assured along the curve. For QHA it was seen that the volumetric increase, given by the lattice constant, and the free energy both followed exponential curvatures with R2 values for quadratic fit >0.99. This is attributed to the vibrational contribution and entropic factor of the free energy increasing in importance as temperature was increased.
MD calculations produced systematically lower primitive cell volume calculations, higher thermal expansion coefficients by an order of magnitude and an opposite trend in free energy vs. temperature. MD being a classical model, doesn’t take into account the lattice ZPE accounting for the volume differential and employs the equipartition energy theorem whereby the unit cell energy is defined purely by the systems thermal energy causing it to increase linearly with temperature. The percentage error difference between the two methods was smaller than 0.6% over the temperature range and decreased with temperature due to a more accurate ensemble average and less prominent ZPE factor in the free energy. Maximum divergence in the linear expansion coefficient occurred at 1000K; α=282.328610-6 K-1 compared to 32.06752910-6K-1 for the QHA. Moreover this difference is due to the fact that the QHA assumes a perfect harmonic potential energy surface constraint, only taking into account a shifting equilibrium bond length to account for system an-harmonicity, and assuming this holds at all lattice constant values, the model doesn’t account for thermal effects such as phonon-phonon interactions.
Discussion of volumetric increase toward a melting point phase transition found that unit cell short-range symmetry is lost, so called soft-phonons are exited and aperiodic diffusive ion motion occurs further consolidates the idea that QHA breaks down at high temperatures. In contrast whereas MD, an ensemble averaging method, is purely limited by its unit cell size, hysteresis and consequent DoF and the time-frame of computation to satisfy the Ergodic hypothesis. This fails at low temperatures as the model cannot match reaction kinetics to produce statistically valid trajectories. Therefore MD can be used to model the volumetric discontinuity, which for MgO would occur at T=3125.25K. To conclude as it was seen that the two volume expansions intercept, however this is not a convergence and only occurs due to the curve shapes, MD being classical and linear and QHA being logarithmic and quantum. It is seen that MD is a more scalable model for computation but is more CPU intense.
Finally research was undertaken concerning k-grid convergence to infinite lattice values for crystals such as CaO(fcc) ,Li(bcc) and Faujasite (Zeolite). This showed that a larger primitive unit cell, generally with lower symmetry, therefore will have by Fourier transform relation a smaller Brillouin volume in k-space. This means lower shrinking factors are needed as more phonon vibrational frequencies, as optical frequencies = 3N-3, were sampled per k-point giving better DOS and free energy approximations at a fixed grid density.
References
[1]-H. J. Monkhorst and J. D. Pack, Phys. Rev. B, 1976, 13, 5188
[2]-Dove, Martin T. (1993). Introduction to lattice dynamics, Cambridge university press. ISBN 0521392934.
[3]-Xiaozhi Wu · Lili Liu · Weiguo Li · Rui Wang · Qing Liu ·12/2014; 1(1). DOI:10.1016/j.cocom.2014.10.005
[4]-12 Bijaya B. Karki and Renata M. Wentzcovitch. PHYSICAL REVIEW B 68, 224304 2003
[5]-G.J. Va ́zquez, L.F. Magan ̃a. Ab initio calculation of the phonon dispersion curve for lithium. Journal de Physique, 1985, 46 (12), pp.2197-2202. <10.1051/jphys:0198500460120219700>. <jpa-00210168>
[6]-THE RIGAKU JOURNAL VOL. 12 / NO. 2 / 1995, P14
[7]-Volume 41B of the series Landolt-Börnstein - Group III Condensed Matter pp 1-6
[8]-The Physics of Phonons. G. P. Strivastava, 1990.
[9]-P. Aynajian, Electron–Phonon Interaction in Conventional and Unconventional Superconductors, Springer Theses, DOI: 10.1007/978-3-642-14968-9_2, Springer-Verlag Berlin Heidelberg 2010
[10]- R.M. Badger. J. Chem. Phys.,2 (1934), p. 128
[11]-N. Nakanishi, A. Nagasawa, Y. Murakami. LATTICE STABILITY AND SOFT MODES. Journal de Physique Colloques, 1982, 43 (C4), pp.C4-35-C4-55. <10.1051/jphyscol:1982403>.
[12]-Langmuir, 2000, 16 (25), pp 9857–9860

