Rep:Mod:KK3015
Intro to Molecular Modelling 2
Using the program GaussView, I will build several models of small molecules (including NH3 and N2 molecules), optimise them and compute several defining quantities of the molecule themselves.
NH3 Molecule
Results
Molecule:           NH3
Calculation Method: RB3LYP
Basis Set:          6-31G(d,p)
E(RB3LYP):          -56.55776873 a.u.
RMS Gradient Norm:    0.00000485 a.u.
Point Group:        C3V

Optimised N-H bond distance:   1.01798 Angstrom
Optimised H-N-H bond angle:  105.741   Degrees
Item Table
       Item               Value     Threshold  Converged?
 Maximum Force            0.000004     0.000450     YES
 RMS     Force            0.000004     0.000300     YES
 Maximum Displacement     0.000072     0.001800     YES
 RMS     Displacement     0.000035     0.001200     YES
 Predicted change in Energy=-5.986278D-10
 Optimization completed.
    -- Stationary point found.
                           ----------------------------
                           !   Optimized Parameters   !
                           ! (Angstroms and Degrees)  !
 --------------------------                            --------------------------
 ! Name  Definition              Value          Derivative Info.                !
 --------------------------------------------------------------------------------
 ! R1    R(1,2)                  1.018          -DE/DX =    0.0                 !
 ! R2    R(1,3)                  1.018          -DE/DX =    0.0                 !
 ! R3    R(1,4)                  1.018          -DE/DX =    0.0                 !
 ! A1    A(2,1,3)              105.7412         -DE/DX =    0.0                 !
 ! A2    A(2,1,4)              105.7412         -DE/DX =    0.0                 !
 ! A3    A(3,1,4)              105.7412         -DE/DX =    0.0                 !
 ! D1    D(2,1,4,3)           -111.8571         -DE/DX =    0.0                 !
 --------------------------------------------------------------------------------
 GradGradGradGradGradGradGradGradGradGradGradGradGradGradGradGradGradGrad
Jmol dynamic image of NH3
A Gaussview image of an optimised Ammonia molecule |
The optimisation file is linked to here
Display Vibrations of optimised NH3 Molecule
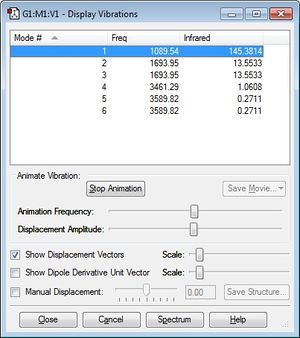
(Note that there are no negative values of frequency, suggesting that the NH3 molecule used is indeed optimised).
Using the 3N-6 rule, we would expect there to be 6 modes of vibrations since N=4.
From the Display Vibrations window above, we can see that Mode numbers 2 and 3 are degenerate with a vibrating frequency of 1693.95 Hz, and mode numbers 5 and 6 are also degenerate at 3589.82 Hz. These are energetically degenerate since E=hf, and their frequency values are the same.
The first three modes of vibrations (modes 1 to 3) are bending vibrations, while the latter three vibrations (modes 4 to 6) are stretching vibrations. This makes sense as bending vibrations absorb less energy than stretching vibrations thus they vibrate at lower frequency than the stretching vibrations.
From the animations seen on GaussView, mode 4 is extremely symmetrical where the bending and stretching of all three N-H bonds are identical, giving several planes of symmetry. It should be noted that while mode 1 is also very symmetrical, it loses one of its plane of symmetry as the bond stretches, thus making it less symmetrical than mode 4. Modes 3 and 6 both have a plane of symmetry as two of the three bonds bend and stretch identically. Whereas modes 2 and 5 are not at all symmetrical.
The "umbrella" mode is the vibrational mode number 1, the symmetrical bending of all three N-H bonds, absorbing the lowest frequency and thus energy of all six vibrations.
All the modes cause a change in dipole moment to a varying extent, and from the table we can see that only modes 1 to 3 (bending of the bonds) causes a noticeable infrared absorption, with mode 1 being the most significant, while modes 4-6 (stretching of the bonds) won't be very noticeable. And since modes 2 and 3 vibrate at the same frequency (1693.95 Hz), you will only see two bands on the spectrum at 1089.54 Hz and 1693.95 Hz, since the other three are not significant enough.
Charge Distribution of NH3
Using GaussView, we are able to see the atomic charge of our optimised NH3 molecule (with the "NBO" type). The program gives the charge on the N-atom to be -1.125 and the charge on each H-atom to be +0.375. This is similar to what we would expect since the N-atom is much more electronegative than the H-atom so the electron density on the N-atom should be larger than that around the H-atom, giving it a lower (more negative) atomic charge. Since NH3 molecules exhibit H-bonding to a certain extent, we expect the atomic charge on each H-atom to be slightly positive, again due to its electron density being pulled away by the electronegative N-atom. It should also be noted that the three +0.375 charges on the hydrogen atoms cancel out the -1.125 charge on the N-atom completely, giving am overall neutral charge on the molecule, which is also as we would expect.
N2 Molecule
Results
Molecule:           N2
Calculation Method: RB3LYP
Basis Set:          6-31G(d,p)
E(RB3LYP):          -109.52412868 a.u.
RMS Gradient Norm:     0.00000060 a.u.
Point Group:        D∞h

Optimised N-N bond distance:   1.10550 Angstrom
Item Table
  Item                    Value        Threshold    Converged?
 Maximum Force            0.000001     0.000450     YES
 RMS     Force            0.000001     0.000300     YES
 Maximum Displacement     0.000000     0.001800     YES
 RMS     Displacement     0.000000     0.001200     YES
 Predicted change in Energy=-3.401160D-13
 Optimization completed.
    -- Stationary point found.
                           ----------------------------
                           !   Optimized Parameters   !
                           ! (Angstroms and Degrees)  !
 --------------------------                            --------------------------
 ! Name  Definition              Value          Derivative Info.                !
 --------------------------------------------------------------------------------
 ! R1    R(1,2)                  1.1055         -DE/DX =    0.0                 !
 --------------------------------------------------------------------------------
 GradGradGradGradGradGradGradGradGradGradGradGradGradGradGradGradGradGrad
Jmol dynamic image of N2
File:(3)KK3015 N2 OPTF POP.LOG
A Gaussview image of an optimised Nitrogen molecule |
The optimisation file is linked to here
Display Vibrations of optimised N2 Molecule

(Note that there are no negative values of frequency, suggesting that the N2 molecule used is indeed optimised).
H2 Molecule
Results
Molecule:           H2
Calculation Method: RB3LYP
Basis Set:          6-31G(d,p)
E(RB3LYP):          -1.17853936 a.u.
RMS Gradient Norm:   0.00000017 a.u.
Point Group:        D∞h

Optimised H-H bond distance:   0.74279 Angstrom
Item Table
 Item                     Value        Threshold    Converged?
 Maximum Force            0.000000     0.000450     YES
 RMS     Force            0.000000     0.000300     YES
 Maximum Displacement     0.000000     0.001800     YES
 RMS     Displacement     0.000001     0.001200     YES
 Predicted change in Energy=-1.164080D-13
 Optimization completed.
    -- Stationary point found.
                           ----------------------------
                           !   Optimized Parameters   !
                           ! (Angstroms and Degrees)  !
 --------------------------                            --------------------------
 ! Name  Definition              Value          Derivative Info.                !
 --------------------------------------------------------------------------------
 ! R1    R(1,2)                  0.7428         -DE/DX =    0.0                 !
 --------------------------------------------------------------------------------
 GradGradGradGradGradGradGradGradGradGradGradGradGradGradGradGradGradGrad
Jmol dynamic image of H2
A Gaussview image of an optimised Hydrogen molecule |
The optimisation file is linked to here
Display Vibrations of optimised H2 Molecule
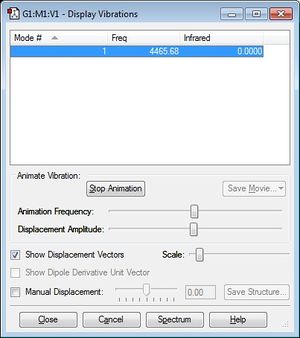
(Note that there are no negative values of frequency, suggesting that the H2 molecule used is indeed optimised).
Atomic charges of homonuclear diatomic molecules
Note that the atomic charge of homonuclear diatomic molecules (that are neutral overall) is zero since the bond is non-polar as the two atoms are identical. This applies to both N2 and H2 molecules.
Haber-Bosch Reaction
N2 + 3H2 -> 2NH3
  E(NH3) = - 56.55776873 a.u.
2*E(NH3) = -113.11553746 a.u.
  E(N2)  = -109.52412868 a.u.
  E(H2)  = -  1.17853936 a.u.
3*E(H2)  = -  3.53561808 a.u.
 ΔE = 2*E(NH3)-[E(N2)+3*E(H2)] = -0.0557907 a.u.
 ΔE = -146.48 kJ/mol (2dp).

There is a decrease in energy which means the product (NH3) is more stable than the
gaseous reactants.
ClF Molecule
Results
Molecule:           ClF
Calculation Method: RB3LYP
Basis Set:          6-31G(d,p)
E(RB3LYP):          -559.94269578 a.u.
RMS Gradient Norm:     0.00014211 a.u.
Point Group:        C∞V

Optimised Cl-F bond distance:   1.66434 Angstrom
Item Table
 Item               Value     Threshold  Converged?
 Maximum Force            0.000246     0.000450     YES
 RMS     Force            0.000246     0.000300     YES
 Maximum Displacement     0.000433     0.001800     YES
 RMS     Displacement     0.000613     0.001200     YES
 Predicted change in Energy=-1.066055D-07
 Optimization completed.
    -- Stationary point found.
                           ----------------------------
                           !   Optimized Parameters   !
                           ! (Angstroms and Degrees)  !
 --------------------------                            --------------------------
 ! Name  Definition              Value          Derivative Info.                !
 --------------------------------------------------------------------------------
 ! R1    R(1,2)                  1.6643         -DE/DX =   -0.0002              !
 --------------------------------------------------------------------------------
 GradGradGradGradGradGradGradGradGradGradGradGradGradGradGradGradGradGrad
Jmol dynamic image of ClF
A Gaussview image of an optimised Chlorine monofluoride molecule |
The optimisation file is linked to here
Display Vibrations of optimised ClF Molecule

(Note that there are no negative values of frequency, suggesting that the ClF molecule used is indeed optimised).
Charge Distribution of ClF
GaussView gives the atomic charge of the optimised ClF molecule to be +0.309 on the Cl-atom and -0.309 on the F-atom. This is expected since fluorine is the most electronegative element, thus the electron density of the Cl-F bond will be pulled towards the F-atom. It should also be noted that their atomic charges cancels out to give zero since the molecule is neutral overall.
Molecular Orbitals of ClF molecule
The diagrams for the MOs of the optimised ClF molecule was generated using GaussView with the .chk file of ClF. Five of these MOs were picked with their energies displayed. Note that the atom on the left is the chlorine atom, while the atom on the right hand side is the Fluorine atom.
F: 1s22s22p5
Cl: 1s22s22p63s23p5
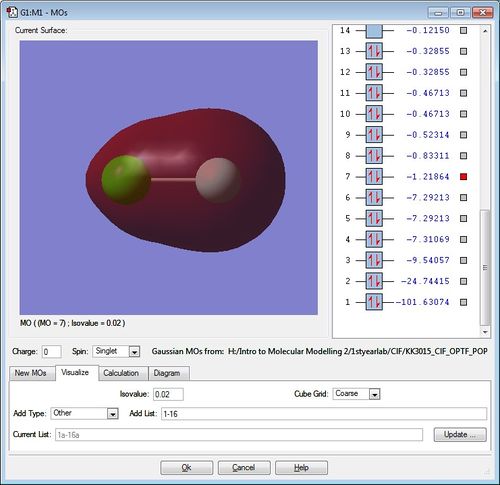
This is the lowest-energy bonding MO of the molecule at -1.21864. It's a sigma bonding
MO formed from the overlap of the 2s AO of F and the 3s AO of Cl. You can see that the
electron density is pulled towards the fluorine atom to the right due to it being more
electronegative than chlorine. Using MO theory, we can also say that the electron
density is closer to the F-atom because its 2s AO is closer to the bonding MO, thus the
F-atom's 2s AO contribute more to the bonding MO.
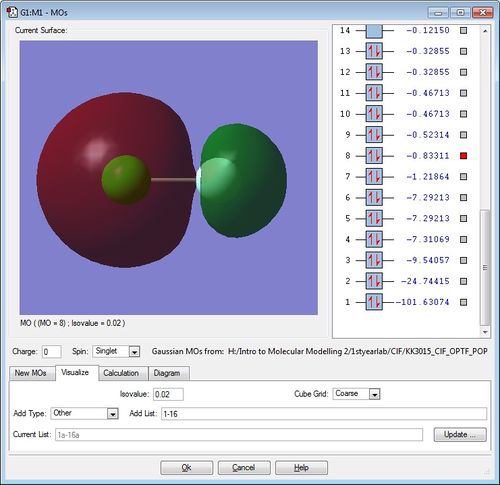
The next lowest MO following the previous one is the corresponding sigma anti-bonding MO
at -0.83311. Using a similar MO argument as before, the electron density is larger around
the Cl-atom in this anti-bonding MO because the 3s AO of chlorine is closer in energy to
this anti-bonding MO, so it contributes more than the 2s AO of fluorine. Note, also,
that the two electrons occupying this anti-bonding MO "cancels out" the bonding of its
corresponding bonding-MO, resulting in no net bonding.

This MO is the next bonding MO from the previous sigma bonding MO, at -0.52314. It's
different from the previous sigma bonding MO as this is formed from the linear "head-on"
overlap of Cl-atom's 3pz AO and F-atom's 2pz AO, assuming the conventional primary bond
axis to be the z-axis. Its corresponding anti-bonding MO is the LUMO, so it's not
occupied, making the pair of electrons in this bonding MO the single sigma bond present
in the ClF molecule.
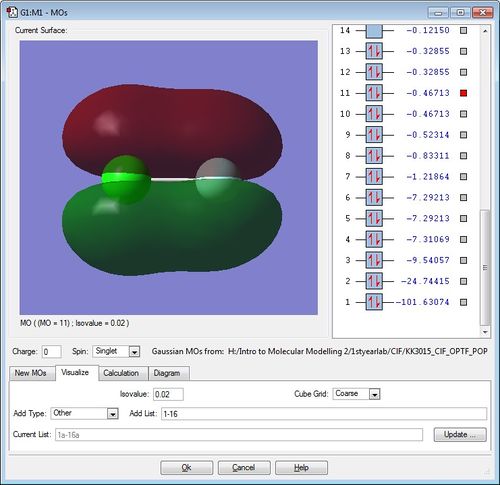
This pi bonding MO, formed from the "side-on" overlap of Cl-atom's 3p AO and F-atom's 2p
AO, is the lowest pi MO at -0.46713. You can see the two signs of the lobes above and
below the two nuclei from the constructive overlap of p AOs of the right orientation
and sign.
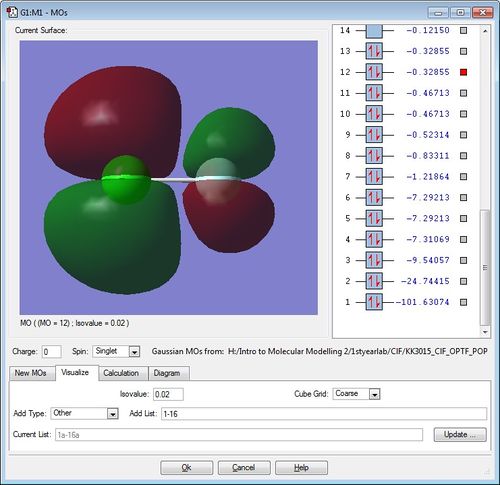
This is the corresponding pi anti-bonding MO to the previous pi bonding MO. It's formed
from the destructive overlap of the Cl-atom's 3p AO and F-atom's 2p AO. The pair of
electrons in this anti-bonding MO "cancels out" the bonding pair of electrons in its
corresponding pi bonding MO, resulting in no net-bonding as well. This is the reason why
the ClF molecule only contains one sigma bond and no pi bonds.
