Rep:Mod:KJH0608
NH3
Summary Information
- Calculation Method: RB3LYP
- Basis Set: 6-31G(d,p)
- Final energy E(RB3LYP): -56.55776873 a.u.
- RMS gradient: 0.00000485 a.u.
- Point group: C3V
- N-H bond length: 1.01865Å
- H-N-H bond angle: 105.7412
        Item               Value     Threshold  Converged?
 Maximum Force            0.000004     0.000450     YES
 RMS     Force            0.000004     0.000300     YES
 Maximum Displacement     0.000072     0.001800     YES
 RMS     Displacement     0.000035     0.001200     YES
Optimised Molecule of Ammonia |
Link to .log file: File:01363227 PHUNT NH3 OPTF POP.LOG
Vibrational Analysis
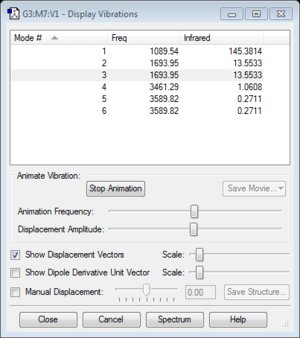
- Using 3N-6, 6 vibrational modes are expected
- Vibrational modes 2 and 3, and 5 and 6, are degenerate
- Vibrational modes 1-3 are bending vibrations and modes 4-6 are stretching vibrations
- Vibrational mode 4 is highly symmetric
- Vibrational mode 1 is the "umbrella" mode
- 2 bands are expected to be seen in an experimental spectrum of gaseous ammonia. There are 4 non-dengenerate vibrational modes, of which 2 have relatively too low of a peak to show up on the experimental spectrum
Charge Analysis
- The charge on the N-atom = -1.125e
- The charge on the H-atom = 0.375e
N is expected to have a negative charge and H is expected to have a positive charge, as N is more electronegative than H.
N2
Summary Information
- Calculation Method: RB3LYP
- Basis Set: 6-31G(d,p)
- Final energy E(RB3LYP): -109.52412868 a.u.
- RMS gradient: 0.00000060 a.u.
- Point group: D*H
- N-N bond length: 1.1.550Å
        Item               Value     Threshold  Converged?
 Maximum Force            0.000001     0.000450     YES
 RMS     Force            0.000001     0.000300     YES
 Maximum Displacement     0.000000     0.001800     YES
 RMS     Displacement     0.000000     0.001200     YES
Optimised Molecule of Nitrogen |
Link to .log file: File:01363227 PHUNT N2 OPTF POP.LOG
Vibrational Analysis
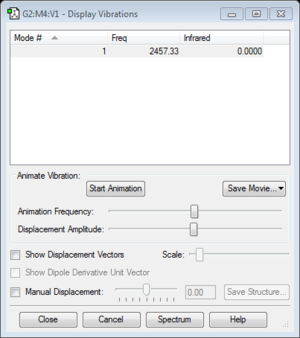
- The band will not show on a vibrational spectrum as the molecules does not have a change in dipole moment as the bond vibrates.
- The literature value of the vibrational frequency is found to be 2358.07cm-1. [1]
H2
Summary Information
- Calculation Method: RB3LYP
- Basis Set: 6-31G(d,p)
- Final energy E(RB3LYP): -1.17853936 a.u.
- RMS gradient: 0.00000017 a.u.
- Point group: D*H
- H-H bond length: 0.74279Å
         Item               Value     Threshold  Converged?
 Maximum Force            0.000000     0.000450     YES
 RMS     Force            0.000000     0.000300     YES
 Maximum Displacement     0.000000     0.001800     YES
 RMS     Displacement     0.000001     0.001200     YES
Optimised Molecule of Hydrogen |
Link to .log file: File:01363227 PHUNT H2 OPTF POP2.LOG
Vibrational Analysis
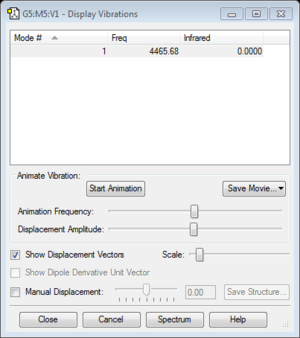
- The band will not show on a vibrational spectrum as the molecules does not have a change in dipole moment as the bond vibrates.
- The literature value of the vibrational frequency is found to be 4400.39cm-1. [1]
Reaction Energy
N2 + 3H2 -> 2NH3
E(NH3)= -56.557769
2*E(NH3)= -113.115538
E(N2)= -109.524129
E(H2)= -1.178539
3*E(H2)= -3.535617
ΔE=2*E(NH3)-[E(N2)+3*E(H2)]= -0.55792 a.u. = -146.48 kJ/mol
The products are more stable as the energy change is negative, which means the products are lower in energy than the reactants.
HCl
Summary Information
- Calculation Method: RB3LYP
- Basis Set: 6-31G(d,p)
- Final energy E(RB3LYP): -460.80077875 a.u.
- RMS gradient: 0.00005211 a.u.
- Point group: C*V
- H-Cl bond length: 1.28599Å
         Item               Value     Threshold  Converged?
 Maximum Force            0.000090     0.000450     YES
 RMS     Force            0.000090     0.000300     YES
 Maximum Displacement     0.000139     0.001800     YES
 RMS     Displacement     0.000197     0.001200     YES
Optimised Molecule of Hydrogen Chloride |
Link to .log file: File:01363227 PHUNT HCL OPTF POP.LOG
Vibrational Analysis

- Using 3N-5, 1 vibrational mode is expected
- 1 band isexpected to be seen in an experimental spectrum of hydrogen chloride as there is only one vibrational mode.
- The literature value of the vibrational frequency is found to be 2828cm-1. [2] This is because the vibrational frequency calculated is at 0K, whereas the literature value does not give the vibrational frequency at 0K.
Charge Analysis
- The charge on the Cl-atom = -0.284 a.u.
- The charge on the H-atom = 0.284 a.u.
Cl is expected to have a negative charge and H is expected to have a positive charge, as Cl is more electronegative than H.
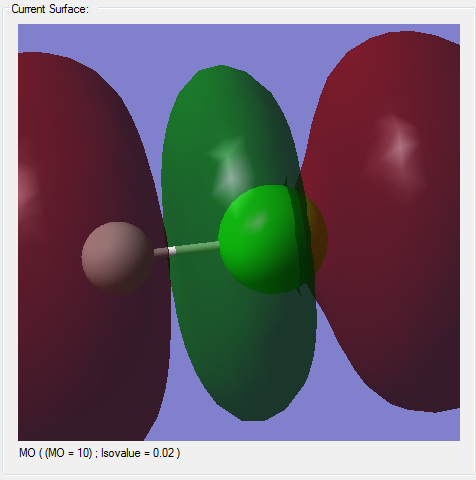
Molecular Orbitals
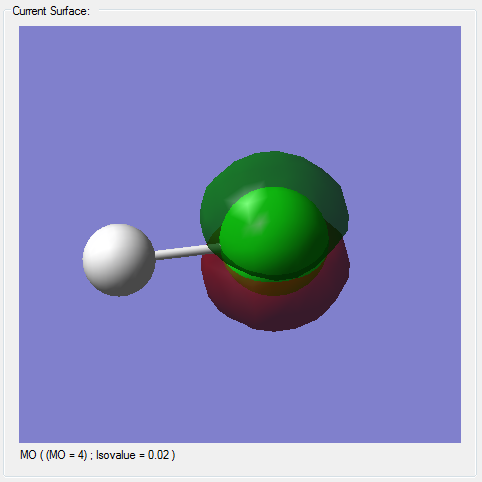
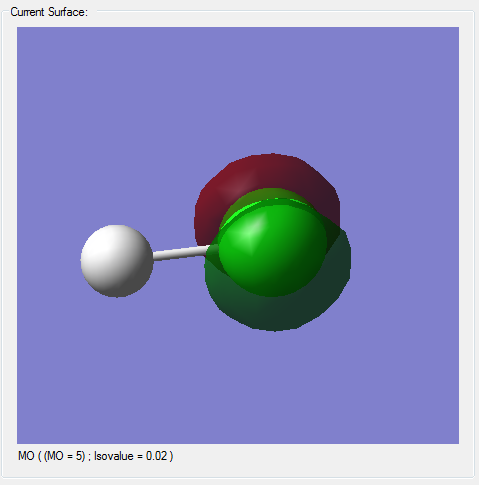
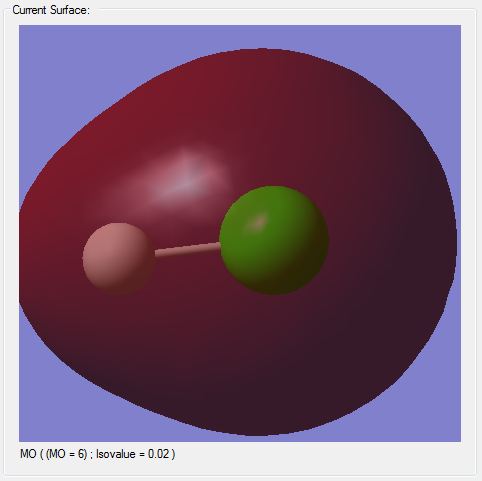
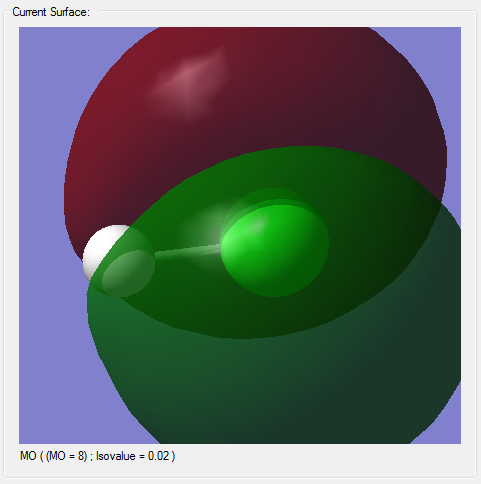
(*)The z-axis goes along the bond of the molecule, the x- and y- axes are perpendicular to the bond of the molecule.
(*)The size of the molecule has not been changed in the images, so the MO sizes can be compared to each other.


