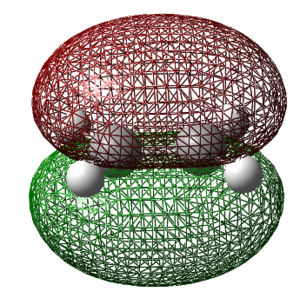
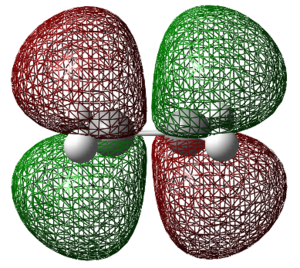
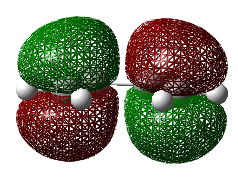
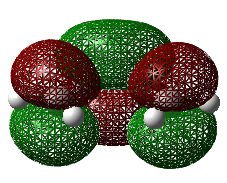
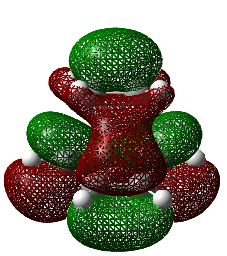
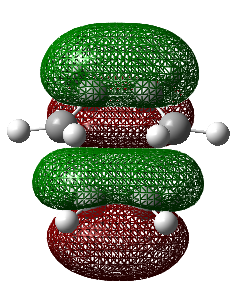
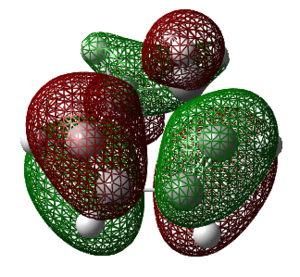
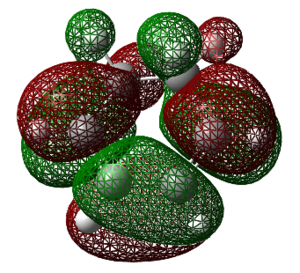
Rep:Mod:KA629943
Physical Computational Lab
The prime focus of this wiki is to investigate the transition state of two types of chemical reactions, the Cope reaction and the Diels-Alder reaction. Being able to study these structures in a virtual form is essential to understanding the mechanisms and gaining an insight of the energies involved due to the inability to probe these structures physically in a lab. Several methods will be investigated for the determination of the transition structures, of which include the hessian method, Frozen-Coordinate and QST methods. Inadvertently the effects of changing between several methods and basis sets will also be investigated showing how extreme variations in calculated energies manifest and how it is wrong for one to compare energies between different methods and basis sets.
A transition state and an energy minimum both appear as a stationary point on a potential surface. If the first derivative of this surface is calculated, both will appear identical. If the second derivative is calculated, i.e. the curvature, one can now identify the nature of the stationary point. A key procedure throughout this investigation is that of frequency analysis. An optimized molecule can be exposed to a frequency calculation that determines the available modes of vibration (along with translational and rotational modes which wish to be minimised as much as possible). For a structure in a ground state, the frequency at which the vibration appears will be positive (i.e. curvature is positive; if one was to carry out this vibration they would be ascending the potential energy surface costing energy). For a transition state, the mode of vibration corresponding to this appears to be negative (a maximum), an imaginary frequency. This can be thought of in the sense that if this structure is slightly disturbed the only way to follow the potential energy curve is to descend. This can be thought of in terms of energy (since frequency and energy are related), energy is required to distort the structure from equilibrium position thus a positive frequency yields a positive energy (system requires energy). For the transition state case, the vibration is negative and will result in the system adopting a lower energy state, giving out energy.
Part 1, The Cope Rearrangement
The Cope rearrangement is an example of a [3,3]-sigmatropic rearrangement reaction, i.e. involves the cleavage of a single σ-bond with the subsequent formation of another σ-bond. One of the simplest examples of this type of reaction involves the 1,5-hexadiene unit. The mechanism, in organic chemistry terms, happens as a concerted process, and one can think of this passing through a transition state which involves the initial cleavage of an σ-bond. A six-membered transition state has the geometry of either a chair or boat structure. It is thus the aim of this investigation to probe the energies associated with each and provide a prediction of what the experimental result would be expected to show.
Initially the low-expense Hartree-Fock method shall be used along with the 3-21G basis set. This shall be followed by the DFT B3LYP method with the 6-31G(d) basis set as literature shows results from these computations are in good agreement with that of experimental data. It is good practise in these types of calculations to build up to a higher level of method/basis set to ensure the correct transition state has been found before using a more expensive method/basis set.
By finding the energies corresponding to that of the reactants and products along with the energy of the transition state, one can calculate the activation energy of the rearrangement and also the energy change for the entire reaction.

Optimization of Reactants and Products
Anti2
The 1,5-hexadiene molecule was constructed using a n-butyl fragment with two carbon atoms fragments being applied to the ends of the molecules. The bond lengths of the terminal C-C bonds were set to a bond order of two. The structure was subsequently 'cleaned'.
The structure was then optimized using the Hartree-Fock method with the 3-21G basis set. This is a relatively loose basis set so the accuracy of the results is expected to be non-ideal. The calculation summary is shown in the table below along with the log file and the item table showing that the optimization was successful in converging to a stationary point. The small value of the RMS also indicates that the product has reached a minimum on the potential energy surface. This energy and point group was found to match up with the anti2 molecule shown in the [appendix].
 | |
| Property | Value |
|---|---|
| Log File | [Log] |
| File Name | JG_Cope_HF3-21G_anti_opt |
| File Type | .log |
| Calculation Type | FOPT |
| Calculation Method | RHF |
| Basis Set | 3-21G |
| Energy | -231.69253528 a.u. |
| RMS Gradient Norm | 0.00001891 a.u. |
| Dipole Moment | 0.00 D |
| Point Group | Ci |
| Job Time | 18.0 Seconds |
| Item Table | Item Value Threshold Converged?
Item Value Threshold Converged?
Maximum Force 0.000060 0.000450 YES
RMS Force 0.000010 0.000300 YES
Maximum Displacement 0.000574 0.001800 YES
RMS Displacement 0.000171 0.001200 YES
Predicted change in Energy=-2.036890D-08
Optimization completed.
|
The frequency analysis was also carried out in-order to determine if the stationary point corresponds to a minimum or a transition state. Both an energy minimum and transition state would appear to have a gradient of zero (since both are stationary points) so the second derivative is required (the sign of the frequencies is important in determining if maximum i.e. transition state or minimum being the ground state). After using the symmetrise feature, the point group was determined to be Ci. The log file for the frequency analysis is given [here]
 Low frequencies ---   -5.6917   -2.3520   -2.0898   -0.0007   -0.0007   -0.0003
 Low frequencies ---   71.1956   85.6857  116.1452
The six low frequencies corresponds to the translational and rotational modes. The values are low corresponding which is desirable (below the standard acceptable limit of +/- 15 cm-1). The three low frequencies on the second line correspond to modes of vibration, all positive thus a minimum has been reached.
Gauche
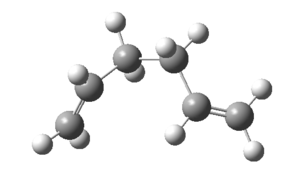
Now a gauche conformation was investigated, this conformation involves all substituents bonded to the central C-C bond to adopt a staggered conformation.
 | |
| Property | Value |
|---|---|
| Log File | [Log] |
| File Name | JG_Cope_HF3-21G_gauche_opt |
| File Type | .log |
| Calculation Type | FOPT |
| Calculation Method | RHF |
| Basis Set | 3-21G |
| Energy | -231.69266120 a.u. |
| RMS Gradient Norm | 0.00001556 a.u. |
| Dipole Moment | 0.34 D |
| Point Group | C1 |
| Job Time | 18.0 Seconds |
| Item Table | Item Value Threshold Converged?
Maximum Force 0.000044 0.000450 YES
RMS Force 0.000009 0.000300 YES
Maximum Displacement 0.001521 0.001800 YES
RMS Displacement 0.000493 0.001200 YES
Predicted change in Energy=-3.610562D-08
Optimization completed.
-- Stationary point found.
|
Once again the optimization was successful in finding a stationary point. In order to determine if this stationary point corresponds to a minimum a frequency analysis is required to show no imaginary frequencies are present and thus a successful optimization to an energy minimum.
 Low frequencies ---   -2.7305   -2.2782   -2.0892   -0.0006   -0.0002    0.0002
 Low frequencies ---   74.4443  104.9293  130.5330
Syn
A second molecule was constructed in the syn conformation using the input file of the anti-periplanar molecule used above. The dihedral angle was changed from 180°(anti-periplanar) to 0°. The log file for this optimization is given [here]. A key feature is the presence of an imaginary frequency which is not desirable. This is due to the molecule being in a transition state, which is also given by a gradient of 0 in the potential energy surface.
| Property | Value |
|---|---|
| Log File | [Log] |
| File Name | JG_Cope_HF3-21G_syn_opt |
| File Type | .log |
| Calculation Type | FOPT |
| Calculation Method | RHF |
| Basis Set | 3-21G |
| Energy | -231.68302540 a.u. |
| RMS Gradient Norm | 0.00003415 a.u. |
| Dipole Moment | 0.36 D |
| Point Group | Cs |
| Job Time | 19.0 Seconds |
| Item Table | Item Value Threshold Converged? Maximum Force 0.000080 0.000450 YES RMS Force 0.000020 0.000300 YES Maximum Displacement 0.000533 0.001800 YES RMS Displacement 0.000186 0.001200 YES Predicted change in Energy=-9.066469D-08 Optimization completed. |
 Low frequencies --- -154.8030   -3.2918   -2.3159   -0.0003   -0.0002    0.0007
 Low frequencies ---    1.4630   78.1617  111.3073
 ******    1 imaginary frequencies (negative Signs) ******
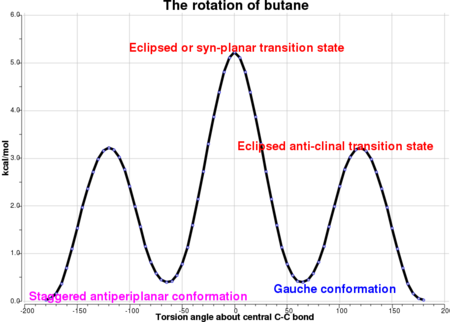
Notice how there is now the presence of one negative frequency. This implies that the molecule is not at a ground state but at a transition state. The diagram showing the energy of all the conformations about the central C-C bond above shows that the syn conformation corresponds to a maximum in energy, thus a transition state.
This can be described by the analogy of a pencil standing on its end. If the pencil is slightly displaced, there is a massive change in conformation, the pencil falls, the molecule moves to a local minimum.
A proof of showing this is a transition state is by slightly altering the dihedral angle. The calculation below uses the same input file but with a dihedral angle of 0.5°. As predicted, the geometry of the molecule has changed and the imaginary frequency is no more.
The log file for the further optimization with the distorted angle can be found [here] while the log file for the frequency analysis is given [here].
The low frequencies are now a lot smaller and there is no imaginary frequencies present.
All Conformations
In the case of only considering the orientation about the central C-C bond, it was predicted that an anti-periplanar conformation would have the lowest energy since this has the largest separation between the alkyl chains, but this is evidently not the case. Gauche3 has the lowest energy. A possible explanation is related to the steric interactions between the vinylic protons. This is easily seen in viewing anti4 which has a relatively high energy. The vinylic protons may experience some steric repulsion from the proton bonded to the central C-C bond. This effect is reduced in gauche 3 hence the relative stabilisation. One might initially overlook the fact there are many more conformations possible due to the orientation of the (-C=C) group. Below shows the energies of the other conformations with a comparison to the energies stated in the [appendix]. The log files are also provided along with an interactive Jmol file. The Hartree-Fock method was adopted with the 3-21G basis set.
| Geometry | Energy (a.u.) | Appendix Energy (a.u.) | Log Files | Jmol | Point Group |
|---|---|---|---|---|---|
| Anti-periplanar 1 | -231.69260235 | -231.69260 | [Log] | C2 | |
| Anti-periplanar 2 | -231.69253528 | -231.69254 | [Log] | Ci | |
| Anti-periplanar 3 | -231.68907025 | -231.68907 | [Log] | C2h | |
| Anti-periplanar 4 | -231.69097056 | -231.69097 | [Log] | C1 | |
| Gauche 1 | -231.68771615 | -231.68772 | [Log] | C2 | |
| Gauche 2 | -231.69166701 | -231.69167 | [Log] | C2 | |
| Gauche 3 | -231.69266119 | -231.69266 | [Log] | C1 | |
| Gauche 4 | -231.69153035 | -231.69153 | [Log] | C2 | |
| Gauche 5 | -231.68961575 | -231.68962 | [Log] | C1 | |
| Gauche 6 | -231.68916016 | -231.68916 | [Log] | C1 |
The Hartree-Fock method is not as accurate in comparison to methods such as DFT or MP2. The calculated energy values closely resemble the values in the appendix. An exceptionally useful diagram is presented below, indicating how the energy changes upon rotation about the central C-C bond. The peaks represent transition states whereas the troughs represent energy minima.
Optimization of anti2 with DFT 6-31G(d)
In order to obtain results that have a higher degree of accuracy, the so called improved Hartree-Fock, i.e. DFT method was used in a subsequent optimization. This incorporated a larger basis set being 6-31G(d). Note that the d refers to allowing the calculation to make use of more diffuse orbitals if it needs to. It is common to run an initial optimization on a cheaper (in computational resources terms) initially to obtain a structure that resembles that of the one corresponding to the potential minimum. It also allows one to check that the correct stationary point has been found as not to waste computational power to yield a useless result. As one can see, the optimization was successful in converging to a minimum.
 | |
| Property | Value |
|---|---|
| Log File | [Log] |
| File Name | JG_Cope_DFT631Gd_anti_opt |
| File Type | .log |
| Calculation Type | FOPT |
| Calculation Method | RB3LYP |
| Basis Set | 6-31G(d) |
| Energy | -234.61171027 a.u. |
| RMS Gradient Norm | 0.00000986 a.u. |
| Dipole Moment | 0.00 D |
| Point Group | Ci |
| Job Time | 2 Minutes and 16.0 Seconds |
| Item Table | Item Value Threshold Converged?
Maximum Force 0.000029 0.000450 YES
RMS Force 0.000005 0.000300 YES
Maximum Displacement 0.000905 0.001800 YES
RMS Displacement 0.000311 0.001200 YES
Predicted change in Energy=-1.096079D-08
Optimization completed.
-- Stationary point found.
|
Once again a vibrational analysis was carried out on the optimized structure (calculating the second derivative of the potential energy surface as to determine the nature of the stationary point) as to show a minimum has been found. The values of the six low frequencies are small (within the desired +/- 15 cm-1 range) which is desirable and there are no imaginary frequencies thus the optimized structure is not at a transition state. The log files can be found [here]
 Low frequencies ---   -9.6715   -0.0003    0.0006    0.0007    2.3864   12.7107
 Low frequencies ---   74.2269   80.9881  121.3621
Optimization with the DFT method with the 6-31G(d) basis set maintains the same point group. Note the computational time has increased significantly, roughly 7 times as long.
Thermochemistry
Below shows the thermodynamic quantities calculated from the frequency calculation. The first term is the zero-point energy, at 0 K one would expect the translational, rotational and vibrational energies to be frozen out with only the zero-point energy contributing in each case. The occupancy of the electronic levels is almost entirely in the ground state. The second term is now the energy at a temperature and pressure of 298.15 K and 1 atm respectively. Thus this value now contains values for the translational, vibrational and rotational as would be predicted by the respective partition functions. The sum of the electronic and thermal enthalpies has a lower value than that of the previously mentioned property due to taking into account a correction term for the molar Boltzmann temperature (RT=NakBT). The final term includes the entropic term to the free energy. Below is also the thermodynamic quantities calculated at 0.0001 K (1 atm) by using the keyword temperature=0.0001. At this temperature it is expected that all the quantities will be equal to that of the zero-point energies since translational, rotational, vibrational and electronic energies are equivalent to their corresponding zero point energies, and this is the case. The log file for the 0 K calculation can be found [here].
| 298 K (1 atm) | 0 K (1 atm) |
|---|---|
Temperature 298.150 Kelvin. Pressure 1.00000 Atm. Sum of electronic and zero-point Energies= -234.469203 Sum of electronic and thermal Energies= -234.461856 Sum of electronic and thermal Enthalpies= -234.460912 Sum of electronic and thermal Free Energies= -234.500778 |
Temperature 0.000 Kelvin. Pressure 1.00000 Atm. Sum of electronic and zero-point Energies= -234.469203 Sum of electronic and thermal Energies= -234.469203 Sum of electronic and thermal Enthalpies= -234.469203 Sum of electronic and thermal Free Energies= -234.469203 |
Comparison of Using Different Method and Basis Set
The tables below show the comparison of the bond lengths and bond angles for the structures optimized by the two different methods and basis sets.
| Bond | HF 3-21G Bond Length (A) | DFT 6-31G(d) Bond Length (A) |
|---|---|---|
| C=C | 1.32 | 1.33 |
| C-C | 1.51 | 1.50 |
| C-C(central) | 1.55 | 1.55 |
| Bond | HF 3-21G Bond Angle (°) | DFT 6-31G(d) Bond Angle (°) |
|---|---|---|
| C=C-C | 124.8 | 125.3 |
| =C-C-C | 111.3 | 112.7 |
It is apparent that there is not a major change in the geometry parameters. The difference in bond lengths is small, 0.01 A difference. This is will have little to no effect on the chemical properties of the molecules. It is expected that there will be some small degree of difference in the geometries when changing method and basis set as different approximations and correlations are used. However, there is a significant change in energy when the method and basis set is changed. As a result of this small difference in structural properties, a cheaper method and basis set can be used to optimize a molecule to a geometry very close to that as would be obtained by a more costly method and basis set. A subsequent optimization using the more expensive method and basis set can be used to give an improved account of the energies, but at a smaller calculation time due to the previous optimization.
The table below gives the comparison in the changes in energy when different basis sets are used.
Important: The energies should never be compared when different methods are used, or even basis sets for that matter. This is not a comparison, it is simply showing how different optimization methods can affect the energy output!
| HF 3-21G | HF 6-31G | HF 6-31G(d) | DFT 6-31G(d) | |
|---|---|---|---|---|
| Energy (a.u.) | -231.69253528 | -232.89548171 | -232.98331912 | -234.61171027 |
| Difference in Energy Left to Right (kcal/mol) | - | 754.8604867 | 55.11881244 | 1021.831061 |
In the extreme case, -231.69253528 a.u. from the HF 3-21G and that of the DFT 6-31G(d) -234.61171027 a.u. shows a difference corresponding to 1831.8 kcal/mol which is exceptionally large! It is thus evident that changing of the basis set has little effect on the geometry relative to that of the effect on the energy.
Optimizing Chair and Boat Transition Structures
The expected transition state structures are that resembling the chair and boat conformations of cyclohexane, these are exhibited in the figure below. As mentioned previously, a transition state also appears as a stationary point on the potential surface, with the key difference that the second derivative is now negative. Calculation of transition states requires more effort than finding the minimum energy. Several methods will be exhibited in the following section.

There are two transition states possible for the Cope reaction, the boat and chair. The latter being expected to have a lower activation energy for reasons that are discussed at the end of this section. All the methods below can be applied to either of the transition states and give the same account of geometry and energetics.
Initially an allyl fragment was optimized at the 3-21G basis set using the Hartree-Fock method since both transition states can be thought of as containing two allyl fragments only differing in the way that they are orientated. These optimised structures will be used in the transition state structures. The summary and log files are shown in the table below. The item table shows that the optimization was successful, along with the relatively small RMS value.
 | |
| Property | Value |
|---|---|
| Log File | [Log] |
| File Name | JG_COPE_CH2CHCH2_HF3-21G_OPT |
| File Type | .log |
| Calculation Type | FOPT |
| Calculation Method | UHF |
| Basis Set | 3-21G |
| Energy | -115.82303994 a.u. |
| RMS Gradient Norm | 0.00008791 a.u. |
| Dipole Moment | 0.03 D |
| Point Group | C2v (after symmetrize) |
| Job Time | 7.0 Seconds |
| Item Table | Item Value Threshold Converged?
Maximum Force 0.000102 0.000450 YES
RMS Force 0.000049 0.000300 YES
Maximum Displacement 0.000891 0.001800 YES
RMS Displacement 0.000306 0.001200 YES
Predicted change in Energy=-1.644636D-07
Optimization completed.
-- Stationary point found.
|
Optimization of the Chair Transition State
Two methods of determining the optimized chair transition state have been investigated here. The first route involves the direct calculation of the transition state by arranging the two molecules in an orientation that looks similar to that of the expected transition state. This is quite a 'gungho' way of optimization of the transition state. In this case, it is sufficient due to the relative simplicity of the molecule under study. For more complex systems such as protein structures, this would not be a reasonable method of approach and thus the second method would be more appropriate. This second method involves initially fixing the terminal atoms that are directly involved in the transition state and then optimizing the remaining atoms. This is then followed by optimization using the derivative (the hessian) of the previously frozen molecules. This way, the calculation is split into more manageable fragments.
Method 1: Computing the Hessian
Two of the previously optimized allyl fragments are positioned approximately 2.20 A apart (this distance is between the terminal carbons) in an orientation mimicking that of the chair structure. This was then optimised to a transition state (Berny) in which the force constants were calculated once. The Hartree-Fock method and a 3-21G basis set along with the keyword opt=noeigen were used in this optimisation. This keyword prevents the calculation from crashing if more than one imaginary frequency is found.
The force constant has to be calculated in order to determine which direction on the potential surface corresponds to the direction towards the transition state. One could set the force constants to be calculated at every point but this makes the calculation more expensive.
 | |
| Property | Value |
|---|---|
| Log File | [Log] |
| File Name | JG_CHAIRTS_321G_OPTFREQ_NOBERNY |
| File Type | .log |
| Calculation Type | FOPT |
| Calculation Method | RHF |
| Basis Set | 3-21G |
| Energy | -231.61932236 a.u. |
| RMS Gradient Norm | 0.00003287 a.u. |
| Dipole Moment | 0.00 D |
| Point Group | C2h (after Symmetrize) |
| Job Time | 7.0 Seconds |
| Item Table | Item Value Threshold Converged?
Maximum Force 0.000089 0.000450 YES
RMS Force 0.000015 0.000300 YES
Maximum Displacement 0.001272 0.001800 YES
RMS Displacement 0.000306 0.001200 YES
Predicted change in Energy=-1.131150D-07
Optimization completed.
-- Stationary point found.
|
 Low frequencies --- -817.9296    0.0007    0.0008    0.0008    2.0668    3.5038
 Low frequencies ---    4.7042  209.6247  395.9373
 ******    1 imaginary frequencies (negative Signs) ******
This calculation was successful in converging to a stationary point that is indicative to a transition state.
| Transition State | |
|---|---|
| Terminal C-C Length (HF/3-21G) | 2.02 A |
| Animation | 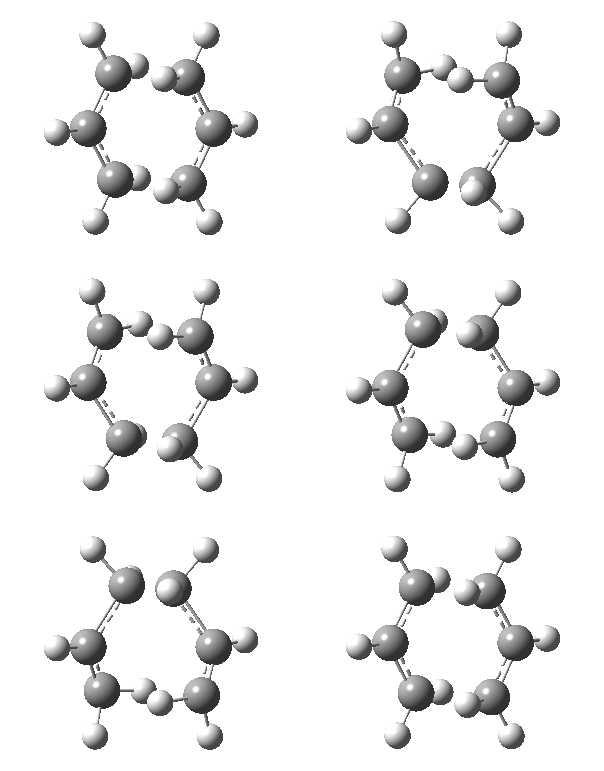 |
| HF/3-21G (ν cm-1) | -818 |
Observing the vibration above with an imaginary frequency, it is evident that it corresponds to the cope reaction due to the motion mimicking the formation and destruction of a C-C bond. This synchronous formation and destruction appear in a concerted manner. The bond length between the terminal carbons of 2.02 A doesn't not correspond to a single bond. This is what would be expected since it is in between the distance of a single bond and the separation considering the Van Der Waals radii (see [here] for literature values of bond lengths and and the VDW radii).
Method 2: Frozen Coordinates
The same orientation of the allyl fragments used in method 1 are used here. This method of calculating the transition state uses the 'divide and conquer' technique which reduces computational expense. Initially the terminal carbons, i.e. the carbons that are involved in bond formation and breaking of a bond have their coordinates frozen (via usage of the redundant coordinate editor). The rest of the molecule is optimized to a minimum structure. This structure was similar to that of the structure found from method 1 but with the key difference that the terminal bonds were still frozen at a separation of approximately 2.20 A. The terminal carbons are then unfrozen and the derivative is calculated. This primarily involves the terminal carbon atoms. This calculation is similar to that of method 1 but with the key difference that the force constants are no longer being calculated as they were previously, instead a normal guess Hessian is used which includes all the information about the two coordinates that are being differentiated along[2]. Since there were redundant coordinates a keyword was used for these calculations, that being opt=modredundant so that the programme knows to check for redundant coordinates.
In the left column of the table below it exhibits the optimization with the frozen coordinates of the terminal carbon atoms. In the center lies the summary of the calculation when the bonds were unfroze and set so that the derivative was being calculated (the hessian). The optimization did not successfully converge, thus the optimization was re-ran using the keywords "scf=conver=9 and opt=tight", this time it was successful in converging and finding a stationary point, the calculation summary for this trial is shown on the right.
 |
 |
 | |
| Property | Value | Value | Value |
|---|---|---|---|
| Log File | [Log] | [Log] | [Log] |
| File Name | JG_CHAIRTS_321G_NOBERNY_REDUNDANT_OPT | JG_CHAIRTS_321G_NOBERNY_REDUNDANT_DERIVATIVE_OPTFREQ | JG_CHAIRTS_321G_NOBERNY_REDUNDANT_DERIVATIVE_OPTFREQ_KEYWORDS |
| File Type | .log | .log | .log |
| Calculation Type | FREQ | FREQ | FREQ |
| Calculation Method | RHF | RHF | RHF |
| Basis Set | 3-21G | 3-21G | 3-21G |
| Energy | -231.61932236 a.u. | -231.61932206 a.u. | -231.61932248 a.u. |
| RMS Gradient Norm | 0.00003284 a.u. | 0.00012741 a.u. | 0.00000076 a.u. |
| Dipole Moment | 0.00 D | 0.00 D | 0.00 D |
| Point Group | C2h | C2h | C2h |
| Job Time | 3.0 Seconds | 8.0 Seconds | 8.0 Seconds |
| Item Table | Item Value Threshold Converged?
Maximum Force 0.000091 0.000450 YES
RMS Force 0.000018 0.000300 YES
Maximum Displacement 0.000831 0.001800 YES
RMS Displacement 0.000244 0.001200 YES
Predicted change in Energy=-1.061583D-07
Optimization completed.
-- Stationary point found.
|
         Item               Value     Threshold  Converged?
 Maximum Force            0.000260     0.000450     YES
 RMS     Force            0.000064     0.000300     YES
 Maximum Displacement     0.002739     0.001800     NO
 RMS     Displacement     0.000795     0.001200     YES
 Predicted change in Energy=-4.144956D-07
 Optimization completed.
-- Stationary point found. |
         Item               Value     Threshold  Converged?
 Maximum Force            0.000002     0.000015     YES
 RMS     Force            0.000000     0.000010     YES
 Maximum Displacement     0.000036     0.000060     YES
 RMS     Displacement     0.000010     0.000040     YES
 Predicted change in Energy=-2.404896D-11
 Optimization completed.
    -- Stationary point found.
|
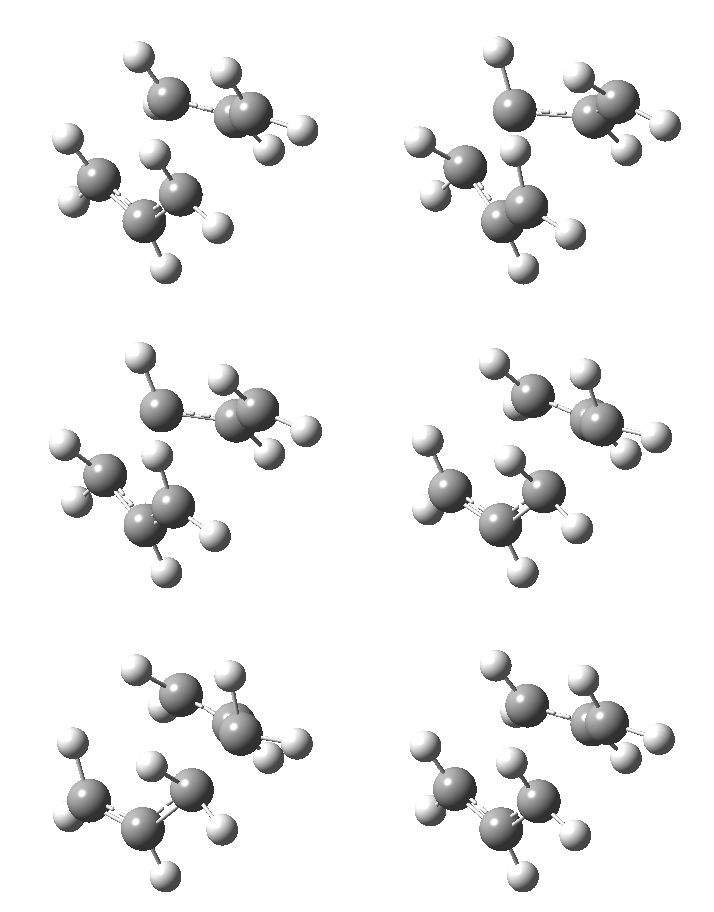
The frequency analysis of the final calculation using keywords previously stated in the calculation shows the presence of one imaginary frequency. This imaginary frequency corresponds to a transition state. Observing the animation there is an asynchronous vibration indicating one bond is breaking while the other bond is forming. The animation of the vibration is also shown below with the corresponding bond lengths.
 Low frequencies --- -817.9352   -0.5121    0.0008    0.0009    0.0009    0.6657
 Low frequencies ---    0.8905  209.5500  396.0096
 ******    1 imaginary frequencies (negative Signs) ******
| Chair | Boat | |
|---|---|---|
| Terminal C-C Length (B3LYP 6-31G(d)) | 1.97 A | 2.21 A |
| Animation | 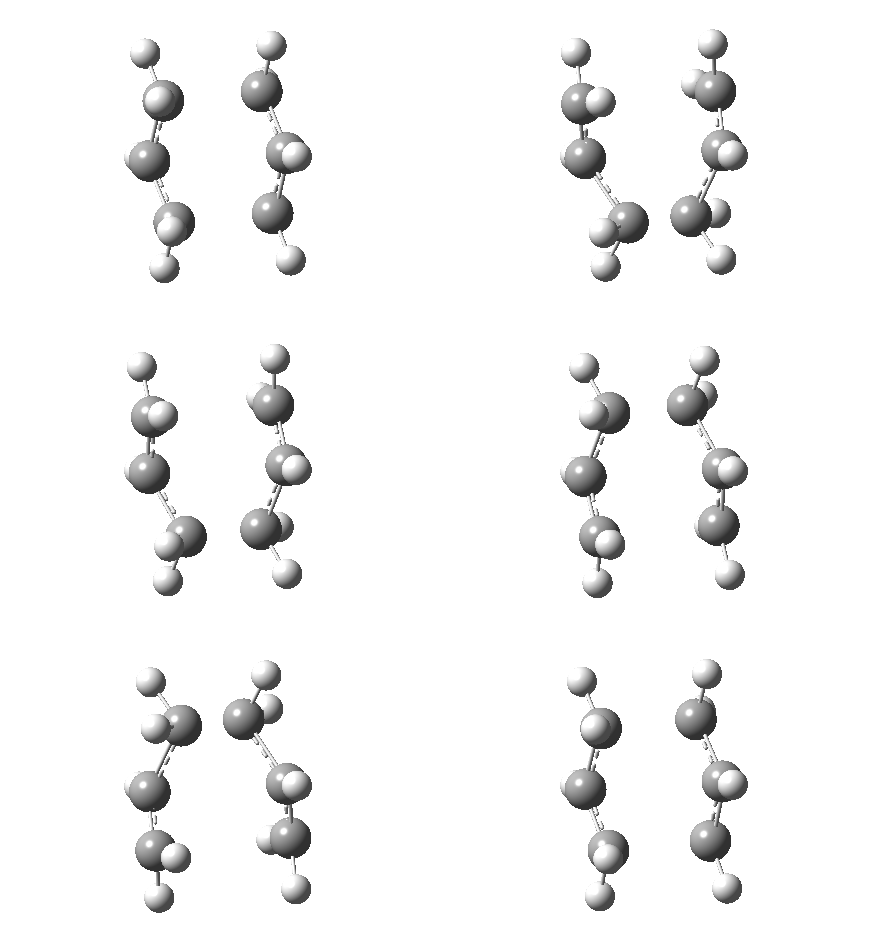 |
 |
| RB3LYP 6-31G(d) (ν cm-1) | -566 | -530.37 |
| HF 3-21G(d) (ν cm-1) | -818 | -840 |
It is evident from this imaginary frequency that the correct transition state has been found. The vibration highlights the motion the molecule would undertake during a Cope rearrangement, i.e. the out-of-phase stretch which looks very similar to that of a bond breaking (two carbon atoms moving away from each other thus and increase in separation) and a bond forming (shortening of distance between atoms to that of a length in accordance to a C-C bond). This also appears to be a concerted process since the increase in separation between two of the carbon atoms happens concertedly with the decrease in separation between a different set of carbon atoms.
Optimization of the Boat Transition State QST2 (Quadratic Synchronous Transit)
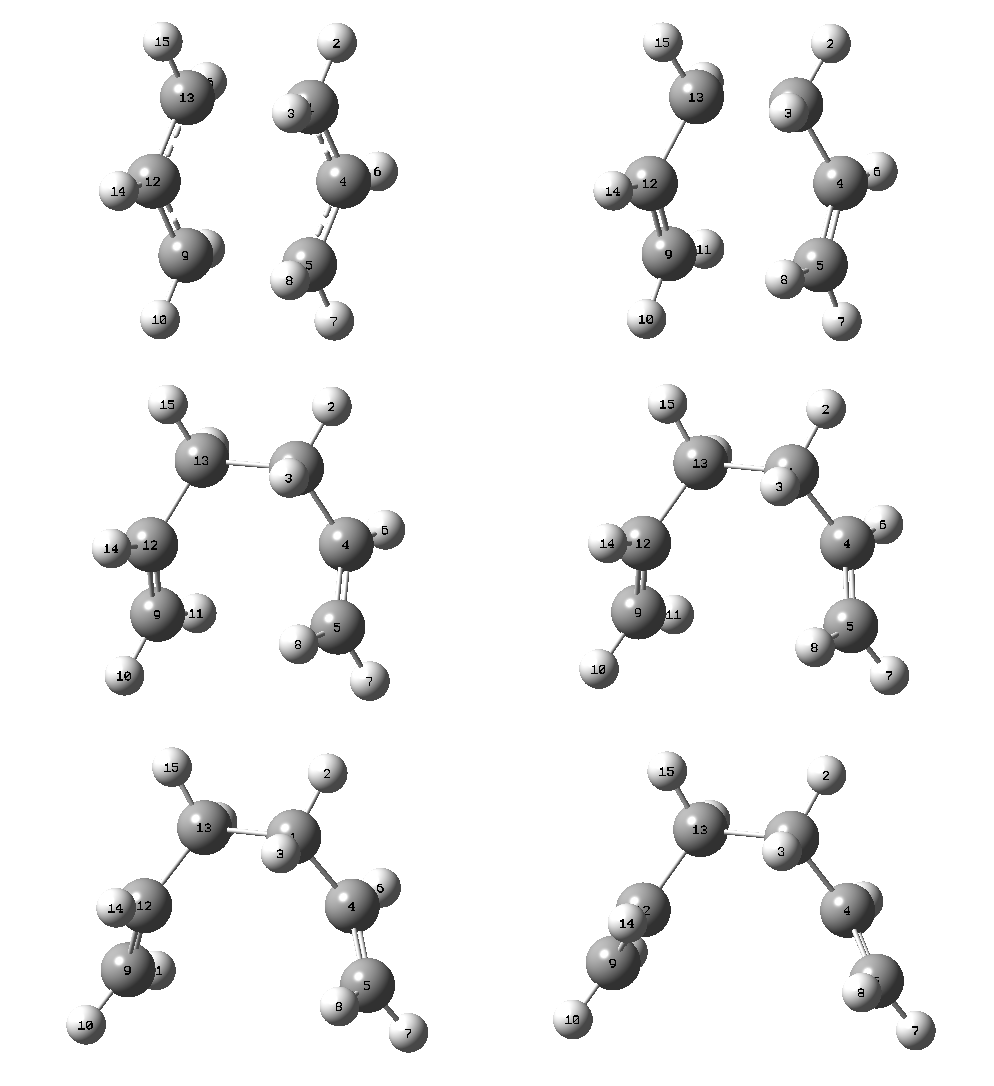
The boat transition state was identified using the QST2 method which uses the structures of the reactant and product as a guideline in determining the transition state. The method requires the molecules to be in a similar geometry to that of the transition state. So in this case, the molecules need to be orientated close to the boat transition state. The diagram to the right shows labelling of the atoms in a geometry which did not lead to the boat transition state.

The molecule was then re-orientated around to a geometry which more closely resembled the boat transition state, i.e. the central dihedral angle was set to 0° while the outer carbon atoms had an angle of 100°. This is exhibited in the Jmol file. This time the calculation did not fail and successfully converged to a stationary point as indicated in the item table below.
 |
 | |
| Property | Value | Value |
|---|---|---|
| Log File | [Log] | [OPT] [IRC] |
| File Name | JG_PARTE_QST2_OPTFREQ_NUMBERED_LIKETS | JG_CHAIRTS_QST2_IRC_OPT_DFT_631Gd |
| File Type | .log | .log |
| Calculation Type | FREQ | FOPT |
| Calculation Method | RHF | RB3LYP |
| Basis Set | 3-21G | 6-31G(d) |
| Energy | -231.60280226 a.u. | -234.61070158 a.u. |
| RMS Gradient Norm | 0.00006959 a.u. | 0.00000015 a.u. |
| Dipole Moment | 0.16 D | 0.44 D |
| Point Group | C2v | C2 |
| Job Time | 4.0 Seconds | 8 Minutes 8.3 Seconds |
| Item Table | Item Value Threshold Converged?
Maximum Force 0.000126 0.000450 YES
RMS Force 0.000034 0.000300 YES
Maximum Displacement 0.001229 0.001800 YES
RMS Displacement 0.000358 0.001200 YES
Predicted change in Energy=-2.334795D-07
Optimization completed.
-- Stationary point found.
|
         Item               Value     Threshold  Converged?
 Maximum Force            0.000000     0.000015     YES
 RMS     Force            0.000000     0.000010     YES
 Maximum Displacement     0.000010     0.000060     YES
 RMS     Displacement     0.000004     0.000040     YES
 Predicted change in Energy=-1.365575D-12
 Optimization completed.
    -- Stationary point found.
|
The frequency analysis of the QST2 method was carried out with the same method and basis set as shown in the summary table above. The imaginary frequency has a value of -840 cm-1 and the animation shows the asynchronous vibration of the Cope reaction.
There is also the presence of one imaginary frequency, which is what is expected if a transition state has been found. The low frequencies are also shown below,
 Low frequencies --- -840.4541   -6.9491   -4.3429    0.0008    0.0010    0.0035
 Low frequencies ---    4.2842  155.0551  381.8885
 ******    1 imaginary frequencies (negative Signs) ******
The QST3 Method for the Boat Transition State
This method involves specifying the reactants as well as the products like in the QST2 method but now we have the addition of a guess transition state. This method will try to pass through the guess transition state. This proves useful when there may be several possible transition states that are similar in energy and can be used as a way of honing in on the desired path. As with the QST2 method the labels on the atoms must match up in all three structures!
(NOTE: Reactant, Product, Guess transition state - In this specific order!)
Displayed below are the three structures used in this calculation.

The calculation itself involved an optimization to a transition state in which the force constants were calculated once. The Hartree-Fock method was used along with the 3-21G basis set. The log file for this calculation can be found [here]. The frequency of the imaginary vibration was found to be 840 cm-1 and correctly mirrors the motion expected in forming the product, i.e. one set of terminals in the transition state getting farther apart (bond breaking) and the other set of terminals getting closer together (bond formation). The transition state calculated by the QST3 method is identical to the transition state predicted by the QST2 method in terms of the electronic energy and the wave number corresponding to the imaginary frequency.
This method can be considered 'overkill' for the system it was applied too due to the systems relative simplicity. QST2 would suffice in this case. As previously mentioned the QST3 shows its true potential when there are multiple transition states for a more complicated system.
IRC Calculation
Inspection of the optimized structure gives no hint as to which conformer of the product it corresponds to (these conformers were investigated in part 1). One can use the IRC (intrinsic reaction coordinate) calculation to monitor how the fragments orientate and visualize the σ-bond formation followed by the optimization into the final structure. The number of points of the reaction coordinate has a default value of 10. This clearly was too few since the RMS was very large, it was then decided to set the number of points on the reaction coordinate to 150 with the keywords opt=tight scf=conver=9. Evidently after 44 points in the coordinate, the calculation stopped as a minimum was reached. The Jmol file shows this IRC
| Property | Value |
|---|---|
| Log File | [Log] |
| File Name | JG_CHAIRTS_321G_NOBERNY_REDUNDANT_DERIVATIVE_OPTFREQ2_IRC_T1_150STEPS |
| File Type | .log |
| Calculation Type | IRC |
| Calculation Method | - |
| Basis Set | - |
| Energy | -231.69166426 a.u. |
| RMS Gradient Norm | 0.00001170 a.u. |
| Dipole Moment | 0.38 D |
| Point Group | C2h (after Symmetrize) |
| Job Time | 6 Minutes 51.0 Seconds |
The graph of the potential energy with the reaction coordinate is also displayed below. Note the plateau at the latter stages of the reaction coordinate, indicating the structure has converged. One final optimization was carried out on the final recorded structure in the IRC due to the fact that the predicted final structure for the IRC method is much looser than the criteria that would be used for a standard optimization. The summary table for the final optimization is shown below with the corresponding log files for the IRC calculation and the optimization.
The summary table below shows that this final optimization was successful in finding a minimum energy. The final structure has an electronic energy equal to that of the gauche3 conformation.
 | |
| Property | Value |
|---|---|
| Log File | [Log] |
| File Name | JG_CHAIRTS_321g_IRC_T1_150steps_additionalOPTatHF321G_WED |
| File Type | .log |
| Calculation Type | FOPT |
| Calculation Method | RHF |
| Basis Set | 3-21G |
| Energy | -231.69166699 a.u. |
| RMS Gradient Norm | 0.00001001 a.u. |
| Dipole Moment | 0.38 D |
| Point Group | Ci |
| Job Time | 8.0 Seconds |
| Item Table | Item Value Threshold Converged?
Maximum Force 0.000038 0.000450 YES
RMS Force 0.000010 0.000300 YES
Maximum Displacement 0.001188 0.001800 YES
RMS Displacement 0.000323 0.001200 YES
Predicted change in Energy=-2.615873D-08
Optimization completed.
-- Stationary point found.
|

The RMS gradient levels off at the later stages of the reaction coordinate indicating that the structure is very close to being a minimum energy conformation. The peak in energy on the electronic energy vs. reaction coordinate plot indicates the conformation of the transition state.
Optimization of the Chair/Boat Transition Structure Using DFT 6-31G(d)
Now that the geometry of the reactants/products and the two transition states have been determined, a further optimization of each can be carried out to improve the accuracy of the calculated energies. Changing the method from Hartree-Fock to DFT will change the way in which the molecules are considered in the optimization calculations. A larger basis set was also adopted, further increasing the accuracy of the calculations. This includes the d-wavefunctions which deals with the more diffuse orbitals that may be present in the system.
 |
 | |
| Property | Chair Value | Boat Value |
|---|---|---|
| Log File | [Log] | [Log] |
| File Name | JG_CHAIRTS_631G_OPTFREQ_NOBERNY | JG_BOATTS_631G_OPTFREQ_NOBERNY |
| File Type | .log | .log |
| Calculation Type | FREQ | FREQ |
| Calculation Method | RB3LYP | RB3LYP |
| Basis Set | 6-31G(d) | 6-31G(d) |
| Energy | -234.55698298 a.u. | -234.54309307 a.u. |
| RMS Gradient Norm | 0.00002514 a.u. | 0.00000456 a.u. |
| Dipole Moment | 0.00 D | 0.06 D |
| Point Group | C2h | C2v |
| Job Time | 2 Minutes 38.0 Seconds | 1 Minutes 53.7 Seconds |
| Item Table | Item Value Threshold Converged?
Maximum Force 0.000091 0.000450 YES
RMS Force 0.000020 0.000300 YES
Maximum Displacement 0.000499 0.001800 YES
RMS Displacement 0.000145 0.001200 YES
Predicted change in Energy=-4.577362D-08
Optimization completed.
-- Stationary point found. |
         Item               Value     Threshold  Converged?
 Maximum Force            0.000009     0.000450     YES
 RMS     Force            0.000003     0.000300     YES
 Maximum Displacement     0.000171     0.001800     YES
 RMS     Displacement     0.000055     0.001200     YES
 Predicted change in Energy=-3.514547D-09
 Optimization completed.
    -- Stationary point found.
|
The thermodynamic properties were found at temperature of 298.15 K (1 atm) and also at 0 K (1 atm). These are given below.
| 298 K (1 atm) | 0 K (1 atm) | |
|---|---|---|
| Chair | [Log] Temperature 298.150 Kelvin. Pressure 1.00000 Atm. Sum of electronic and zero-point Energies= -234.414924 Sum of electronic and thermal Energies= -234.409003 Sum of electronic and thermal Enthalpies= -234.408059 Sum of electronic and thermal Free Energies= -234.443810 |
[Log]Temperature 0.000 Kelvin. Pressure 1.00000 Atm. Sum of electronic and zero-point Energies= -234.414924 Sum of electronic and thermal Energies= -234.414924 Sum of electronic and thermal Enthalpies= -234.414924 Sum of electronic and thermal Free Energies= -234.414924 |
| Boat | [Log]Temperature 298.150 Kelvin. Pressure 1.00000 Atm. Sum of electronic and zero-point Energies= -234.402342 Sum of electronic and thermal Energies= -234.396008 Sum of electronic and thermal Enthalpies= -234.395063 Sum of electronic and thermal Free Energies= -234.431097 |
[Log]
Temperature 0.000 Kelvin. Pressure 1.00000 Atm. Sum of electronic and zero-point Energies= -234.402342 Sum of electronic and thermal Energies= -234.402342 Sum of electronic and thermal Enthalpies= -234.402342 Sum of electronic and thermal Free Energies= -234.402342 |
Consideration of the Activation Energies
| Comparison of the Boat and Chair Transition States | ||
|---|---|---|
| Property | Chair | Boat |
| Final Energy (a.u.) | -234.55698298 | -234.54309307 |
| Point Group | C2h | C2v |
| C(1)-C(2) Length (A) | 1.41 | 1.39 |
| C(3)-C(6)(A) | 1.97 | 2.21 |
| C(1)-C(2)-C(3) Angle (°) | 119.9 | 122.3 |
| C(2)-C(3)-C(4) Angle (°) | 103.6 | 103.5 |

The difference in energy between the two transition structures has an energy difference of 0.0138899 a.u. which corresponds to a difference of 8.716045705 kcal/mol. This is similar to literature which states a difference in energy of 5-6 kcal/mol[3]. As expected the chair transition state has a lower energy transition state (more negative value). The key difference between the two energies is most likely due to the 1,4-flag pole interactions, a.k.a steric repulsion between para-hydrogens. Another key difference is the eclipsed conformation, as shown in the adjacent.
| HF/3-21G | B3LYP/6-31G* | |||||
|---|---|---|---|---|---|---|
| Electronic energy | Sum of electronic and zero-point energies | Sum of electronic and thermal energies | Electronic energy | Sum of electronic and zero-point energies | Sum of electronic and thermal energies | |
| at 0 K | at 298.15 K | at 0 K | at 298.15 K | |||
| Chair TS | -231.61932248 | -231.466700 | -231.461341 | -234.55698298 | -234.414924 | -234.409003 |
| Boat TS | -231.60280226 | -231.450926 | -231.445296 | -234.54309307 | -234.402342 | -234.396008 |
| Reactant (anti2) | -231.69253528 | -231.539539 | -231.532565 | -234.469203 | -234.469203 | -234.461856 |
| HF/3-21G | HF/3-21G | B3LYP/6-31G* | B3LYP/6-31G* | Expt. | |
| at 0 K | at 298.15 K | at 0 K | at 298.15 K | at 0 K | |
| ΔE (Chair) | 45.71 | 44.69 | 34.06 | 33.17 | 33.5 ± 0.5 |
| ΔE (Boat) | 55.61 | 54.76 | 41.96 | 41.32 | 44.7 ± 2.0 |
The computational results from the B3LYP 6-31G(d) are in accordance to that of literature data, more so than that of the HF 3-21G. These calculated values for the chair transition state (from B3LYP method) fall into the range of uncertainty of the stated literature which supports the predicted increase in accuracy of this method. There is a slight deviation of that of the calculated boat activation energy to that of literature but this may be due to steric interactions previously stated. The use of a larger basis set may aid to narrow the gap, but this would need to be tested with further study. It is also apparent from this data that the chair transition state has a much smaller activation energy to that of the boat, a difference of approx. 8-9 kcal/mol, this is in excellent accordance to the predictions.
The Diels-Alder Cycloaddition
Reaction Between Ethene and Butadiene
This is one of the conceptually simplest reactions of this type. The reaction proceeds via a 6-membered aromatic transition state and is characterised by the term [4π+2π] referring to the number of π-electrons involved (that being 4π electrons from the butadiene and 2π electrons from the ethene). Note that it is termed an aromatic transition state, for a reaction to be thermally allowed there must be 4n+2 π-electrons (i.e. Huckel) whereas if 4n π-electrons are involved it is deemed as anti-aromatic and will not be favoured thermally. The reactants in this case are not indicative of an 'idealised' example of a Diels-Alder reaction as this would require an electron rich diene and an electron poor dieneophile, which is termed normal electron demand. This has the character of a low-lying LUMO of the dieneophile relative to that of the diene.
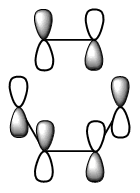
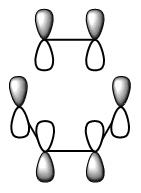
The diagram directly below exhibits the arrangement of the molecular orbitals involved in the reaction. The HOMO of the diene and the LUMO of the dieneophile can only interact constructively if the butadiene adopts a s-cis conformation rather than the thermodynamically more stable s-trans.

Optimization of the Reactants and Product
Initially the butadiene and ethene were optimized to a minimum value using the Semi-Empirical/AM1 method with the ZDO basis set. The cyclohexene (product) was also optimized with the same method and basis set. The details of this reaction is shown below along with the corresponding log files and item table. It is evident that all of the optimizations converged successfully to a stationary point.
 |
 |
 | |
|---|---|---|---|
| Property | Value | Value | Value |
| Log File | [Butadiene] | [Ethene] | [Cyclohexene] |
| File Name | JG_Butadiene_Opt_SemiEmpiAM1_keywords | JG_Ethene_SemiEmpi_AM1_OPT | JG_OPT_Product_output |
| File Type | .log | .log | .log |
| Calculation Type | FOPT | FOPT | FOPT |
| Calculation Method | RAM1 | RAM1 | RAM1 |
| Basis Set | ZDO | ZDO | ZDO |
| Energy | 0.04879717 a.u. | 0.02619024 a.u. | -0.01619479 a.u. |
| RMS Gradient Norm | 0.00000068 a.u. | 0.00000075 a.u. | 0.00002642 a.u. |
| Dipole Moment | 0.04 D | 0.00 D | 0.18 D |
| Point Group | C2v (after symmetrize) | D2h (after symmetrize) | C2 (after symmetrize) |
| Job Time | 33.9 Seconds | 14.6 Seconds | 36.3 Seconds |
| Item Table | Item Value Threshold Converged?
Maximum Force 0.000001 0.000015 YES
RMS Force 0.000000 0.000010 YES
Maximum Displacement 0.000011 0.000060 YES
RMS Displacement 0.000005 0.000040 YES
Predicted change in Energy=-5.692897D-11
Optimization completed.
-- Stationary point found. |
         Item               Value     Threshold  Converged?
 Maximum Force            0.000001     0.000015     YES
 RMS     Force            0.000000     0.000010     YES
 Maximum Displacement     0.000003     0.000060     YES
 RMS     Displacement     0.000001     0.000040     YES
 Predicted change in Energy=-4.201681D-12
 Optimization completed.
-- Stationary point found. |
         Item               Value     Threshold  Converged?
 Maximum Force            0.000040     0.000450     YES
 RMS     Force            0.000011     0.000300     YES
 Maximum Displacement     0.001438     0.001800     YES
 RMS     Displacement     0.000282     0.001200     YES
 Predicted change in Energy=-1.470411D-07
 Optimization completed.
    -- Stationary point found.
|
The optimization using Semi-Empirical/AM1 gave a near-planar structure for butadiene, this is shown in the Jmol file . However, upon optimization with B3LYP/6-311G(d) the structure was more distorted as shown in this Jmol file . The first case, it appears the molecule adopts an eclipsed conformation with respect to viewing down the central C-C bond where as in the second case, it adopts a conformation that resembles that of gauche. One cannot simply compare the optimized energies of these two optimized structures due to both of them being calculated by different methods and basis sets.
Optimization of the Transition State
The optimized structures of the reactants shown above were then used in constructing the guess of the transition state. The Hessian method was adopted to determine the transition state. The reason for this selected method was to gain insight into how reliable the method really is and to gain an understanding to what degree it depends on the operators understanding of the transition state itself. The graphical input file used as the guess is shown in the figure below. Drawing attention to the position of the double bond being presented as would be expected in the product, and the terminals of the new σ-bonds being formed having a valency of three as to encourage partial bond formation. Even with a reasonable guess as the one shown below, this method proved troublesome and much tweaking was needed to orientate the fragments correctly (that being the bond angles and separation between the reactive terminals) as to produce the correct transition state structure. This further highlights the none-specific approach in obtaining the transition state structure.

The calculation itself involved both an optimization and frequency analysis, optimizing to a TS(Berny) using the Semi-Empirical/AM1 method with the ZDO with the keywords opt=noeigen, the log files and summary table is given below. A secondary optimisation using the Hartree-Fock method with the 6-31G(d) basis set was also carried out.
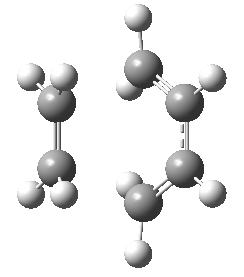 |
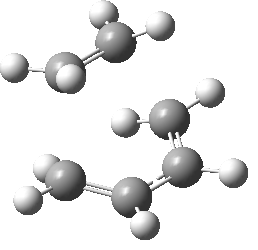 | |
| Property | Semi-Empirical AM1 Value | Hartree-Fock 6-31G(d) Value |
|---|---|---|
| Log File | [Log] | [Log] |
| File Name | JG_TS_DIELSALDER | JG_HF_631Gd_Transitionstate |
| File Type | .log | .log |
| Calculation Type | FREQ | FREQ |
| Calculation Method | RAM1 | RHF |
| Basis Set | ZDO | 6-31G(d) |
| Energy | 0.11165465 a.u. | -232.87960559 a.u. |
| RMS Gradient Norm | 0.00000112 a.u. | 0.00000126 a.u. |
| Dipole Moment | 0.56 D | 0.51 D |
| Point Group | C2h | Cs |
| Job Time | 2.0 Seconds | 1 Minutes 34.1 Seconds |
| Item Table | Item Value Threshold Converged?
Maximum Force 0.000003 0.000015 YES
RMS Force 0.000001 0.000010 YES
Maximum Displacement 0.000087 0.000060 YES
RMS Displacement 0.000019 0.000040 YES
Predicted change in Energy=-2.344567D-10
Optimization completed.
-- Stationary point found. |
         Item               Value     Threshold  Converged?
 Maximum Force            0.000004     0.000015     YES
 RMS     Force            0.000001     0.000010     YES
 Maximum Displacement     0.000035     0.000060     YES
 RMS     Displacement     0.000010     0.000040     YES
 Predicted change in Energy=-1.405173D-10
 Optimization completed.
    -- Stationary point found.
|
Both optimizations successfully converged to a stationary point.
| Transition State | |
|---|---|
| Terminal C-C Length (HF 6-31G(d)) | 2.20 A |
| Animation | 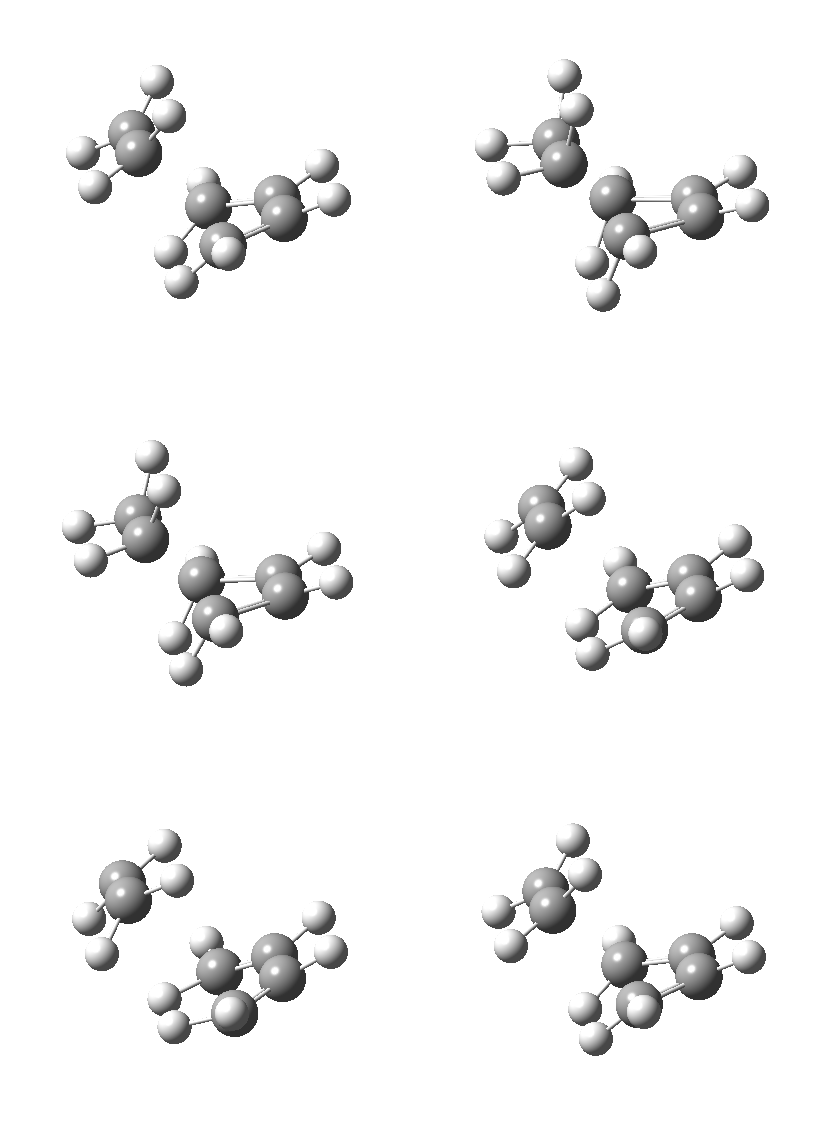 |
| Semi-Empirical AM1 (ν cm-1) | -956 |
| HF 6-21G(d) (ν cm-1) | -903 |
The mode of vibration above has a negative frequency, i.e. an imaginary frequency. Once again this indicates that the system is at a transition state, but does not indicate if it is the correct transition state (the one that refers to the cycloaddition). In-order to determine if this is the correct transition state, one needs to look at the animation of the vibration itself which is also shown above. It shows the synchronous formation of two new σ-bonds, since both bond forming terminals approach concertedly. This has the result of preserving the symmetry of the molecule. Optimization finds a stationary point, i.e. where the gradient is equal to zero. This can be the case for two very different states of the system. One being the ground state of either the products or reactants, this will be a minimum point. The other is a transition state, which is a maximum in energy. The second derivative for the two possibilities mentioned will be positive and negative respectively. If one looks at some of the exhibited extracts from the log files of the frequency analysis of reactants and products, one would see all the frequencies corresponding to vibration being positive in nature, hence optimization to a minimum. However in the case for a transition state, it is an energy maximum and will thus have a negative frequency.
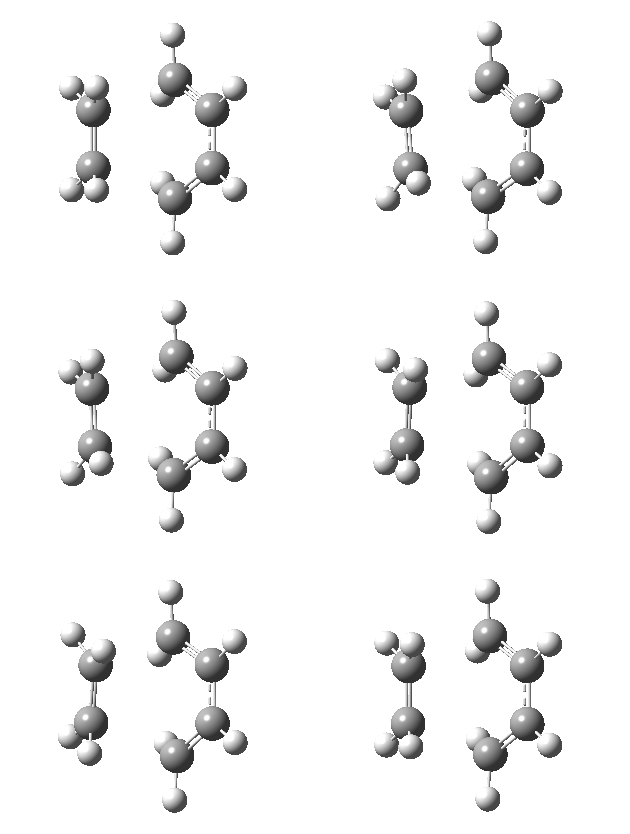
Below is the vibration of the first positive vibration. The most striking feature is that this motion is not synchronous like the imaginary frequency. A direct consequence of this is the destruction of the symmetry. Vibrations that are not symmetric appear on the IR spectrum (must include a change in dipole moment, those that display a change in polarisability appear in the Raman spectrum). The positive nature of this vibration rules it out as being the vibration relating to the transition state.
Calculation of the IRC
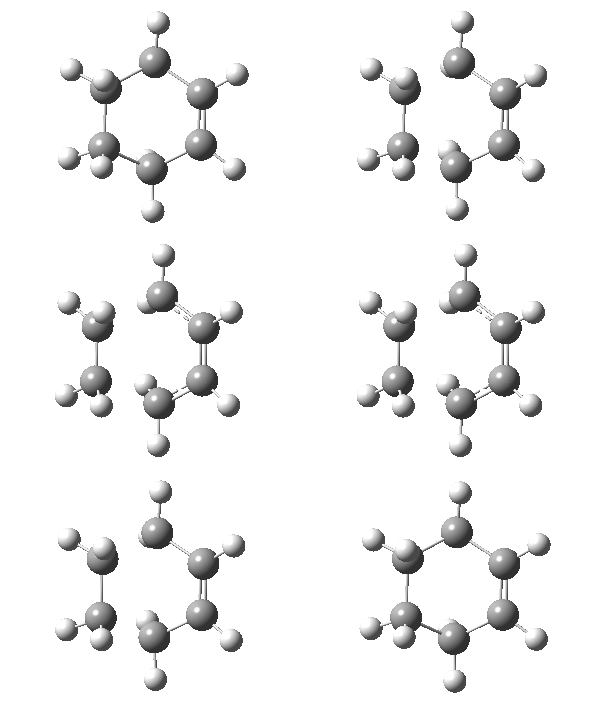
The IRC was also calculated for this reaction and it was found to successfully converge to a constant value in 44 steps. The final step, i.e. the one at which has no change in energy to the degree that the calculation dictates, was further optimized to a minimum by a standard optimization calculation using the DFT method and the 6-31G(d) basis set. As can be seen from the IRC plots, the reaction coordinate is shown in reverse initially starting at the product and then having the bonds break going to the transition state. There is the subsequent reformation of the product after this step, this is shown by the double hump in the RMS plot.


| Property | Value |
|---|---|
| Log File | [Log] |
| File Name | JG_CHAIRTS_321G_NOBERNY_REDUNDANT_DERIVATIVE_OPTFREQ2_IRC_T1_150STEPS |
| File Type | .log |
| Calculation Type | IRC |
| Calculation Method | - |
| Basis Set | - |
| Energy | a.u. |
| RMS Gradient Norm | a.u. |
| Dipole Moment | D |
| Point Group | C2h (after Symmetrize) |
| Job Time | 6 Minutes 51.0 Seconds |
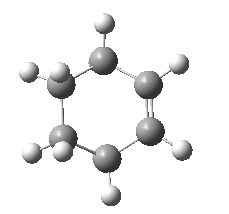
The energy of the final structure in the IRC calculation was found to have an electronic energy of -234.63913604 a.u. and as before, this structure was further optimized using a standard optimization to a minimum with the DFT method and a 6-31G(d) basis set. The details of this optimization is shown below. Note the energy difference between the electronic energies between the IRC final structure and the optimization. The difference corresponds to a value of 0.01 kcal/mol which is exceptionally small. This small deviation is due to the IRC being calculated with the same method and the same large basis set.
 | |
| Property | Value |
|---|---|
| Log File | [Log] |
| File Name | JG_Butadiene_IRC_furtherOPT |
| File Type | .log |
| Calculation Type | FOPT |
| Calculation Method | RB3LYP |
| Basis Set | 6-31G(d) |
| Energy | -234.63915430 a.u. |
| RMS Gradient Norm | 0.00000095 a.u. |
| Dipole Moment | 0.24 D |
| Point Group | Cs |
| Job Time | 10 Minutes 52.0 Seconds |
| Item Table | Item Value Threshold Converged?
Maximum Force 0.000001 0.000015 YES
RMS Force 0.000000 0.000010 YES
Maximum Displacement 0.000019 0.000060 YES
RMS Displacement 0.000006 0.000040 YES
Predicted change in Energy=-6.034913D-11
Optimization completed.
-- Stationary point found.
|
Comparisons of Methods and Basis Sets and the Activation Energy
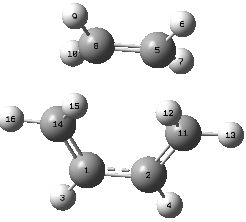
| |||
|---|---|---|---|
| Details of the transition state | |||
| Property | TS DFT B3LYP 6-31G(d) | TS HF 6-31G(d) | TS Semi-Empirical AM1 |
| Log File | [Log] | [Log] | [Log] |
| Final Energy (a.u.) | -234.54388563 | -232.87960559 | 0.11165465 |
| Point Group | Cs | Cs | Cs |
| C(14)-C(1) Length (A) | 1.38 | 1.38 | 1.38 |
| C(1)-C(2) Length (A) | 1.41 | 1.39 | 1.40 |
| C(14)-C(8) Length (A) | 2.27 | 2.20 | 2.12 |
| C(8)-C(5) Length (A) | 1.39 | 1.38 | 1.38 |
| C(14)-C(1)-C(2) Angle (°) | 122.0 | 121.5 | 121.2 |
| C(1)-C(14)-C(8) Angle (°) | 102.3 | 102.6 | 99.3 |
The Length of a single C-C bond is 1.544 A [4] and that of a double bond (C=C) has a literature value of 1.33[5]. With these values in mind, it is evident that the bond between C(1)-C(2) is somewhere between a single bond and double bond which is what would be expected in the transition state since it is initially a single bond and gains some double bond character in the transition state (observed shortening). This is also the case for the bond between C(1)-C(14) which initially has double bond character but in the transition state it gains single bond character. The distance between the terminal carbon atoms, i.e. C(14)-C(8), have a separation that is less than two van-der-waals radii apart (1.85 A [6]). This implies a bonding interaction since they are smaller than the minimum distance between two carbon atoms that case exist with no bonding-interaction. This distance doesn't correspond to a single bond, but it is obviously in the process of formation.
| 298 K (1 atm) | 0 K (1 atm) | |
|---|---|---|
| Transition State | [Log] Sum of electronic and zero-point Energies= -234.403329 Sum of electronic and thermal Energies= -234.396907 Sum of electronic and thermal Enthalpies= -234.395963 Sum of electronic and thermal Free Energies= -234.432902 |
[Log]Temperature 0.000 Kelvin. Pressure 1.00000 Atm. Sum of electronic and zero-point Energies= -234.403329 Sum of electronic and thermal Energies= -234.403329 Sum of electronic and thermal Enthalpies= -234.403329 Sum of electronic and thermal Free Energies= -234.403329 |
The thermodynamic values for the reactants can be found in the log files of the following links. [Ethene 298.15 K], [Ethene 0 K], [Butadiene 298.15 K] and [Butadiene 0 K]
| Semi-Empirical/AM1 | B3LYP/6-31G* | |||||
|---|---|---|---|---|---|---|
| Electronic energy | Sum of electronic and zero-point energies | Sum of electronic and thermal energies | Electronic energy | Sum of electronic and zero-point energies | Sum of electronic and thermal energies | |
| at 0 K | at 298.15 K | at 0 K | at 298.15 K | |||
| Transition State | 0.11165465 | 0.253275 | 0.259452 | -234.54388563 | -234.403329 | -234.396907 |
| Reactant (Diene + Dieneophile) | (0.04879717 + 0.02619024) | (0.134553 + 0.077200) | (0.138573 + 0.080254) | (-156.02239331 + -78.60695796) | (-155.937633 + -78.556114) | (-155.932936 + -78.553071) |
| HF/3-21G | HF/3-21G | B3LYP/6-31G* | B3LYP/6-31G* | Expt. | |
| at 0 K | at 298.15 K | at 0 K | at 298.15 K | at 0 K | |
| ΔE (Transition State) | 26.06 | 25.49 | 56.74 | 55.91 | - |
The activation energy will be compared to the Diels-Alder reaction between maleic anhydride and cyclohexadiene in a later section.
The Molecular Orbitals
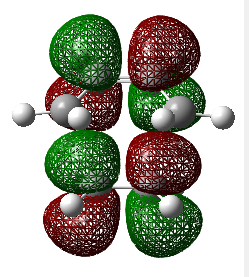
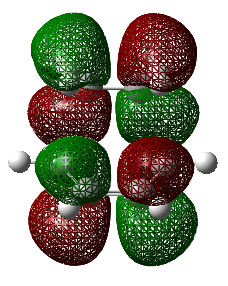
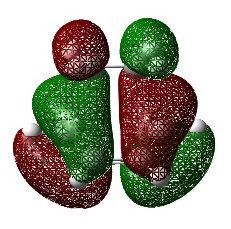
The molecular orbitals have been generated for the reactant molecules and also the transition states. A key feature is the ordering of the symmetry of the HOMO and LUMO in the reactant molecules. As seen directly below in the table, the symmetric orbital of the ethene is lower in energy than that of the antisymmetric. This is the opposite case for the butadiene molecule.
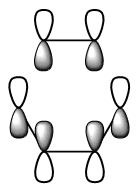
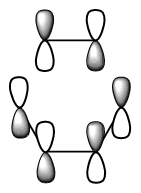
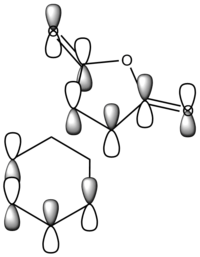
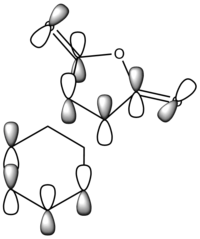
The table below shows the molecular orbital diagrams for selected transition state orbitals alongside corresponding LCAO diagrams.
Note: The LCAO for the HF 6-31G(d) for molecular orbitals 23 and 22 are swapped There has been a re-ordering of the molecular orbitals when a different method/basis set has been used. This is not surprising since the levels are relatively close in energy, thus the difference in energy that can manifest from changes in method and basis set may be large enough to give a different ordering. Personal experiences as an undergraduate usually involves looking at appearance of the HOMO-LUMO orbitals, however from the results shown above, it would be more appropriate to look at HOMO-1 or LUMO+1 to get a greater understanding of what orbitals play key roles. That aside, Both MOs 19 and 25 remain antisymmetric with respect to a nodal plane that is directly down the centre of the transition state structure. Both of the LUMO orbitals, 18 and 24, are still symmetric with respect to a plane running directly through the central C-C bond in the butadiene and the ethene.
The orbitals that contribute to the HOMO of the transition state (for Semi-Empirical/AM1) appears to be both the HOMO of diene with LUMO of dieneophile which can be justified by the antisymmetric HOMO orbital of the transition state. For the HOMO calculated by Hartree-Fock 6-31G(d), it appears to be constructed by the LUMO of the diene and the HOMO of the dieneophile, due to the plane of symmetry. A useful representation for this effect is shown in the diagram below. This is the case where there are no substituents which may affect the stabilisation of the orbitals involved, this is further investigated in a subsequent part of the wiki which looks at normal and inverse electron demand.
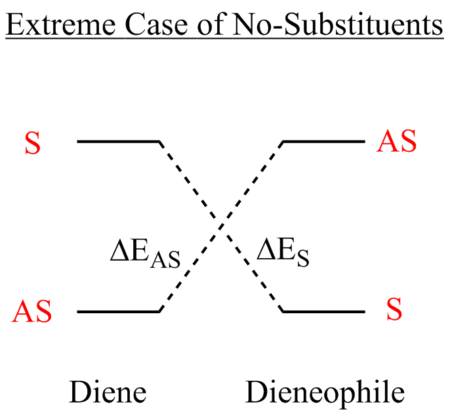
The reaction is allowed to proceed since there are molecular orbitals for each fragment that are of the same symmetry that are similar in energy which can combine to form new molecular orbitals. This is a symmetry requirement that must be met, since one cannot combine orbitals of different symmetry to form new molecular orbitals.
Reaction Between Cyclohexa-1,3-diene and Maleic Anhydride
This is a similar reaction to the previous Diels-Alder but now we have the dieneophile bearing an electron-withdrawing group, resulting in a more favourable reaction.

Optimization of the Reactants and Products
As before the reactants and products were constructed and subsequently optimized, these structures along with the log files are shown in the summary table situated below.
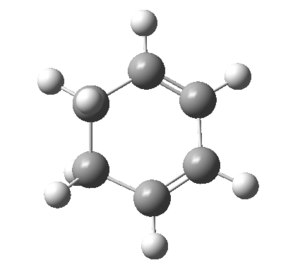 |
 |
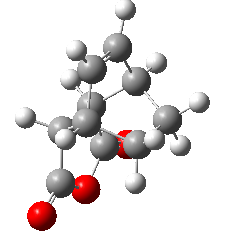 |
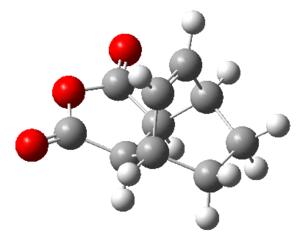 | ||
| Property | Value | Value | Value | Value | |
|---|---|---|---|---|---|
| Log File | [Cyclohexa-1,3-diene] | [Maleic Anhydride] | [Exo-Product] | [Endo-Product] | |
| File Name | Cyclohexadiene_DFT_OPT | Maleic_DFT_OPT | JG_EXO_DFT_OPT | JG_Endo_DFT_OPT | |
| File Type | .log | .log | .log | .log | |
| Calculation Type | FOPT | FOPT | FOPT | FOPT | |
| Calculation Method | RB3LYP | RB3LYP | RB3LYP | RB3LYP | |
| Basis Set | 6-31G(d) | 6-31G(d) | 6-31G(d) | 6-31G(d) | |
| Energy | -233.41891187 a.u. | -379.28953546 a.u. | -612.75577846 a.u. | -612.75831002 a.u. | |
| RMS Gradient Norm | 0.00000092 a.u. | 0.00000163 a.u. | 0.00000240 a.u. | 0.00000144 a.u. | |
| Dipole Moment | 0.38 D | 4.07 D | 4.76 D | 5.02 D | |
| Point Group | C2 | C2v | CS | CS | |
| Job Time | 9 Minutes 51.8 Seconds | 8 Minutes 24.0 Seconds | 35 Minutes 25.7 Seconds | 1 Hours 7 Minutes 12.3 Seconds | |
| Item Table | Item Value Threshold Converged?
Maximum Force 0.000001 0.000015 YES
RMS Force 0.000000 0.000010 YES
Maximum Displacement 0.000006 0.000060 YES
RMS Displacement 0.000002 0.000040 YES
Predicted change in Energy=-7.015658D-12
Optimization completed.
-- Stationary point found. |
    Item               Value     Threshold  Converged?
 Maximum Force            0.000003     0.000015     YES
 RMS     Force            0.000001     0.000010     YES
 Maximum Displacement     0.000015     0.000060     YES
 RMS     Displacement     0.000005     0.000040     YES
 Predicted change in Energy=-8.310319D-11
 Optimization completed.
-- Stationary point found. |
         Item               Value     Threshold  Converged?
 Maximum Force            0.000006     0.000015     YES
 RMS     Force            0.000001     0.000010     YES
 Maximum Displacement     0.000050     0.000060     YES
 RMS     Displacement     0.000008     0.000040     YES
 Predicted change in Energy=-2.061425D-10
 Optimization completed.
-- Stationary point found. |
         Item               Value     Threshold  Converged?
 Maximum Force            0.000003     0.000015     YES
 RMS     Force            0.000001     0.000010     YES
 Maximum Displacement     0.000038     0.000060     YES
 RMS     Displacement     0.000005     0.000040     YES
 Predicted change in Energy=-1.222830D-10
 Optimization completed.
    -- Stationary point found.
|
The frequency analysis was carried out to show that the optimisations correspond to a minimum in energy rather than a transition state.
| Frequency Analysis | Log File | |
|---|---|---|
| Maleic Anhydride | Low frequencies --- -0.0008 0.0004 0.0009 3.3135 4.2298 4.6784 Low frequencies --- 168.2392 264.2218 399.9235 |
[Log] |
| Cyclobuta-1,3-diene | Low frequencies --- 0.0007 0.0007 0.0008 6.0502 8.8268 12.0024 Low frequencies --- 189.2110 301.3095 481.0138 |
[Log] |
| Exo-Product | Low frequencies --- -8.0088 -3.4359 -0.0002 0.0004 0.0007 2.3793 Low frequencies --- 60.5921 140.1515 164.8203 |
[Log] |
| Endo-Product | Low frequencies --- -6.7430 -2.9487 -0.0006 0.0006 0.0007 5.1151 Low frequencies --- 57.8072 141.3117 158.5964 |
[Log] |
The frequency analysis shows that the optimization has successfully found a ground state, hence no negative frequencies corresponding to vibrations. The low frequencies corresponding to the translation and rotational are also very low (below the +/- 15 cm-1 thus a satisfactory optimization). The molecular orbitals involved in this interaction are similar to that of the previous reaction.
Calculation of the Transition State
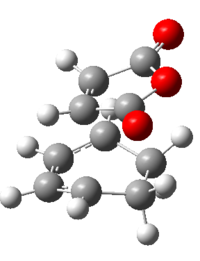
The transition state was calculated using two methods, that of using a guess as to what the transition state and that of providing the reactant and product structures. This reaction strongly highlights the benefits of the latter, which may take slightly longer in preparation of the molecules (i.e. correct numbers and arrangement) but wins out in being able to correctly identify the transition structure on the first calculation.
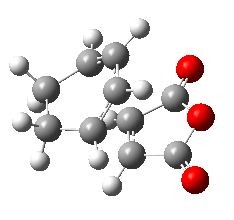 |
 | |
| Property | Value | Value |
|---|---|---|
| Log File | [Endo-TS] | [Exo-TS] |
| File Name | TS_OtherOne_DFT_631gd | TS_Works_dft_631Gd |
| File Type | .log | .log |
| Calculation Type | FREQ | FREQ |
| Calculation Method | RB3LYP | RB3LYP |
| Basis Set | 6-31G(d) | 6-31G(d) |
| Energy | -612.68339577 a.u. | -612.67933543 a.u. |
| RMS Gradient Norm | 0.00000295 a.u. | 0.00000045 a.u. |
| Dipole Moment | 6.11 D | 5.55 D |
| Point Group | CS | CS |
| Job Time | 1 Hour 7 Minutes 43.7 Seconds | 57 Minutes 37.5 Seconds |
| Item Table | Item Value Threshold Converged?
Maximum Force 0.000008 0.000015 YES
RMS Force 0.000001 0.000010 YES
Maximum Displacement 0.000054 0.000060 YES
RMS Displacement 0.000016 0.000040 YES
Predicted change in Energy= 4.393318D-11
Optimization completed.
-- Stationary point found. |
         Item               Value     Threshold  Converged?
 Maximum Force            0.000001     0.000015     YES
 RMS     Force            0.000000     0.000010     YES
 Maximum Displacement     0.000026     0.000060     YES
 RMS     Displacement     0.000008     0.000040     YES
 Predicted change in Energy=-4.371218D-11
 Optimization completed.
    -- Stationary point found.
|
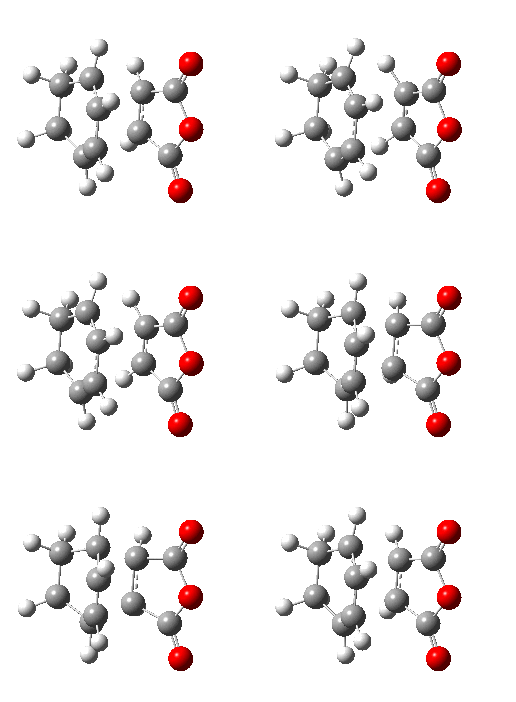
The table below highlights the vibrational mode that corresponds to the transition state (hence the negative wave number). The frequency at which this vibration occurs varies significantly depending on the method used.
| Exo- | Endo- | |
|---|---|---|
| Terminal C-C Length (B3LYP 6-31G(d)) | 2.29 A | 2.27 A |
| Animation | 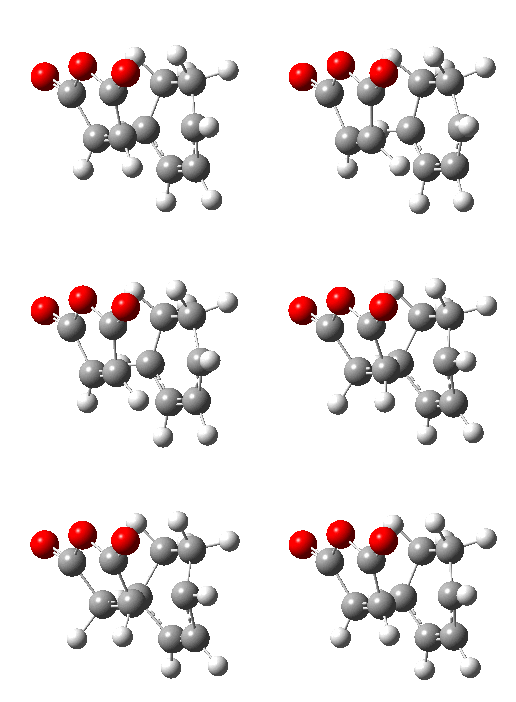 |
 |
| RB3LYP 6-31G(d) (ν cm-1) | -448 | -447 |
| Semi-Empirical AM1 (ν cm-1) | -812 | -806 |
The presence of the imaginary frequency shows that the structure is at the transition state and the animation shows the synchronous movement of the atoms involved in forming the new σ-bonds. This observation supports the claim that the correct transition state has been found. An unrelated example of another possible transition states that may have been found includes the syn conformation about a bond which has been shown to produce an imaginary frequency (shown in first part of the wiki),
| TS-IRC | IRC Path | Energy Plot | RMS Plot |
|---|---|---|---|
| Exo-IRC | 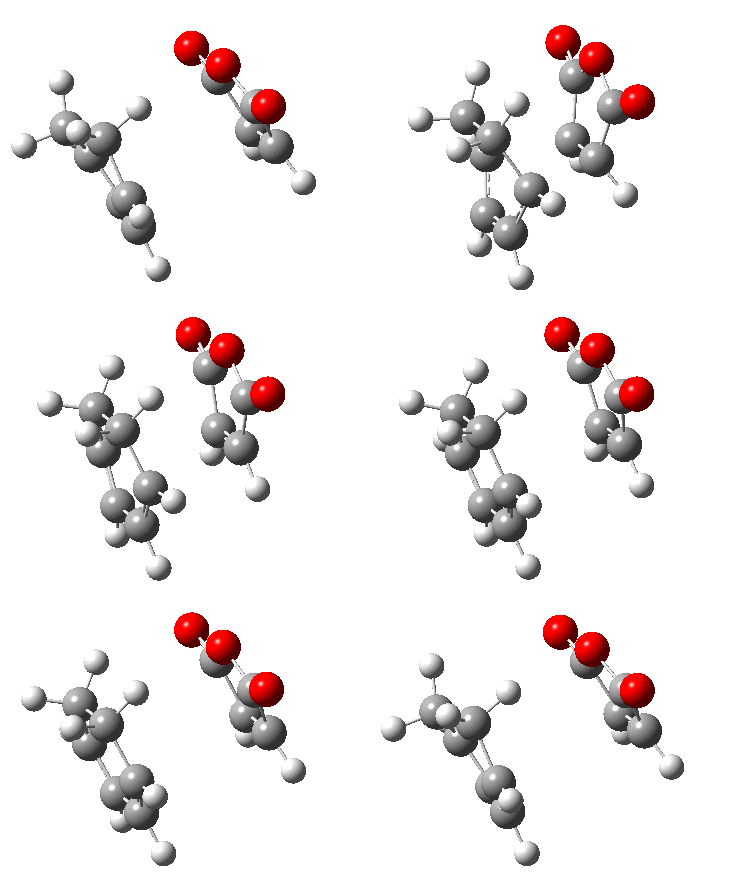 |
 |
 |
| Endo-IRC | 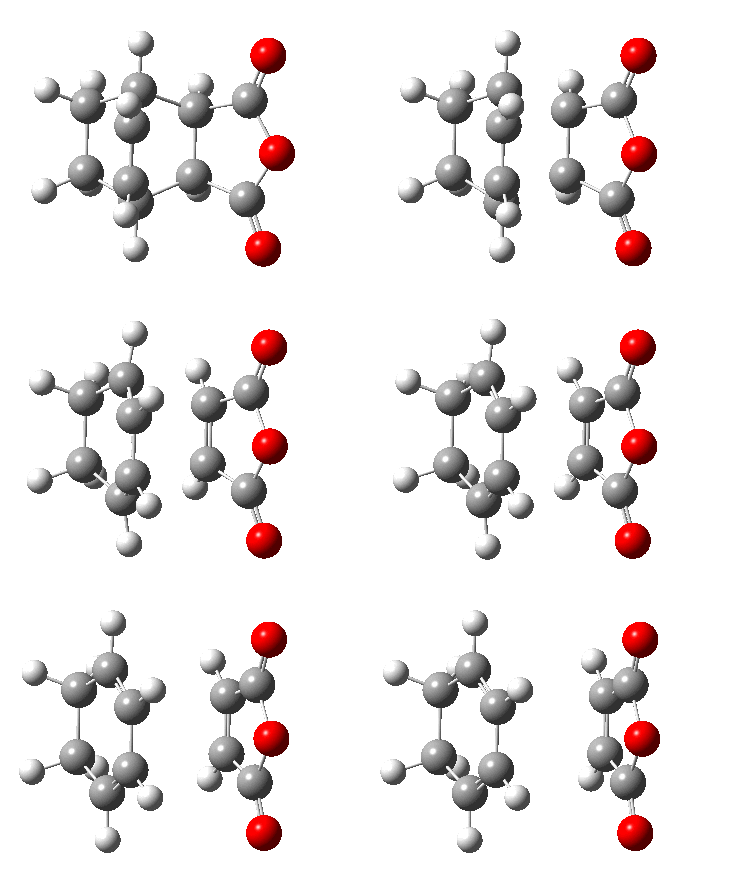 |
 |
 |
Note that the movies above run in the opposite direction, i.e. showing the product break down into the reactants. The log files for this calculation is given [here for exo] and [here for endo] and one can reverse the IRC if so wished. The IRC calculation correctly shows the formation of the desired product from the transition state.
It is also possible to compare the electronic energies between the transition state structure and the reactants. For the endo-TS the difference in energy corresponds to 15.77 kcal/mol, for the exo-TS it appears to be 20.23 kcal/mol. This implies that the exo form is higher in energy and will be less readily formed.
Calculation of Reaction Energies
The reaction energy, change in energy from going from reactants to products is shown in the table below. This energy will be compared with the energy of different Diels-Alder reactions in a later section.
| 298 K (1 atm) | 0 K (1 atm) | |
|---|---|---|
| Exo- Transition State | [Log] Temperature 298.150 Kelvin. Pressure 1.00000 Atm. Sum of electronic and zero-point Energies= -612.498005 Sum of electronic and thermal Energies= -612.487668 Sum of electronic and thermal Enthalpies= -612.486723 Sum of electronic and thermal Free Energies= -612.534193 |
[Log]Temperature 0.000 Kelvin. Pressure 1.00000 Atm. Sum of electronic and zero-point Energies= -612.498009 Sum of electronic and thermal Energies= -612.498009 Sum of electronic and thermal Enthalpies= -612.498009 Sum of electronic and thermal Free Energies= -612.498009 |
| Endo- Transition State | [Log]Temperature 298.150 Kelvin. Pressure 1.00000 Atm. Sum of electronic and zero-point Energies= -612.502207 Sum of electronic and thermal Energies= -612.491835 Sum of electronic and thermal Enthalpies= -612.490891 Sum of electronic and thermal Free Energies= -612.538437 |
[Log]
Temperature 0.000 Kelvin. Pressure 1.00000 Atm. Sum of electronic and zero-point Energies= -612.502143 Sum of electronic and thermal Energies= -612.502143 Sum of electronic and thermal Enthalpies= -612.502143 Sum of electronic and thermal Free Energies= -612.502143 |
| Semi-Empirical/AM1 | B3LYP/6-31G* | |||||
|---|---|---|---|---|---|---|
| Electronic energy | Sum of electronic and zero-point energies | Sum of electronic and thermal energies | Electronic energy | Sum of electronic and zero-point energies | Sum of electronic and thermal energies | |
| at 0 K | at 298.15 K | at 0 K | at 298.15 K | |||
| Exo- TS | -0.05041979 | 0.134882 | 0.144883 | -612.67933543 | -612.498009 | -612.487668 |
| Endo- TS | -0.05150474 | 0.133493 | 0.143682 | -612.68339577 | -612.502143 | -612.491835 |
| Reactant (Diene + Dieneophile) | (0.02771128 + -0.12182424) | (0.152501 + -0.063345) | (0.157726 + -0.058192) | (-233.41891660 + -379.28953546) | (-233.296118 + -379.233652) | (-233.290940 + -379.228469) |
| Semi-Empirical/AM1 | Semi-Empirical/AM1 | B3LYP/6-31G* | B3LYP/6-31G* | Expt. | |
| at 0 K | at 298.15 K | at 0 K | at 298.15 K | at 0 K | |
| ΔE (Endo) | -27.82 | -27.70 | 17.34 | 17.30 | - |
| ΔE (Exo) | -28.69 | -28.46 | 19.93 | 19.92 | - |
| 298 K (1 atm) | 0 K (1 atm) | |
|---|---|---|
| Exo-TS Reaction Energy | 19.92 | 19.93 |
| Endo- Transition State | 17.30 | 17.34 |
The activation energies above support the statement that the endo-TS is preferred, i.e. the activation energy for the endo-TS is approximately 3 kcal/mol less than that for the exo product. For a kinetic controlled reaction, the product that is formed the fastest will predominate, i.e. the lower the activation energy (energy difference between transition state and reactants) the faster the reaction. In this case the endo product is the kinetic product. If the temperature was increased to 1000 K, we are in the realms of looking at the thermodynamic product. The sum of electronic and thermal energies at 1000 K for the exo product was found to be -612.475514 a.u. and the endo was found to be -612.478126 a.u. and since the reactants are the same, it is evident that the endo product is still favoured but this time only by approximately 1.6 kcal/mol. The log files for the calculations at 1000 K (1 atm) can be found [here for the exo] and [here for the endo]
Looking at the difference in energies between the reactants and that of the two possible conformations of products, one can see that the exo-product resides at a lower energy, approximately 2.6 kcal/mol lower than that of the endo product. This shows that the exo-product is the thermodynamic product. The relatively large height of the exo-TS activation energy prevents this product from being formed predominantly. Thus the kinetic endo product is favoured due to lower activation energy.
The Molecular Orbitals
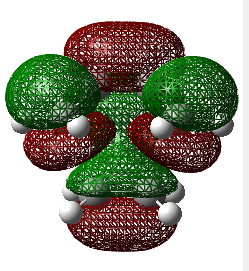
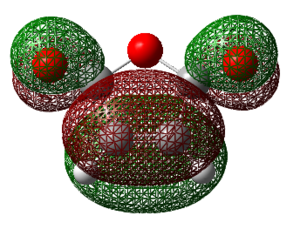
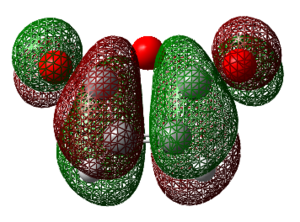
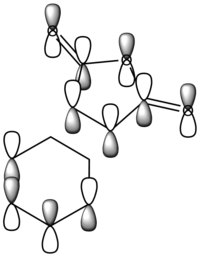
The molecular orbitals shown in the table directly below were calculated using the Hartree-Fock method and a 6-31G(d) basis set. This combination of method and basis set appears to show more defined mixing of orbitals relative to that of the semi-empirical; calculations. Due to this, one must try to visualize the molecular orbitals with less mixing using the LCAO diagrams as guidance to the actual orbitals involved.
The following molecular orbitals were calculated using Semi-empirical methods.
| Semi-Empirical AM1 EXO [chk file] | Semi-Empirical AM1 Endo [chk file] | |||||
|---|---|---|---|---|---|---|
| Molecular Orbital | Energy (a.u.) | Diagram | Molecular Orbital | Energy (a.u.) | Diagram | LCAO |
| 36 | 0.03378 | 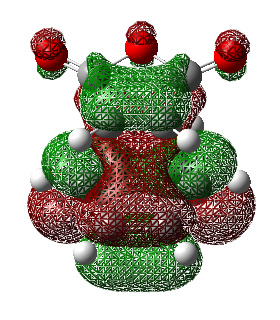 |
36 | -0.02014 | 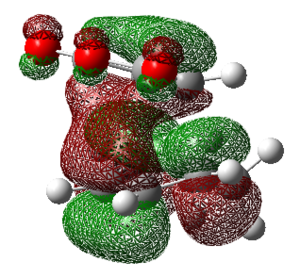 |
|
| 35 | 0.02315 | 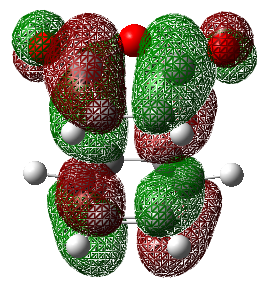 |
35 | -0.03570 | 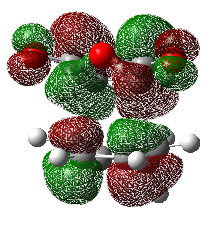 |
|
| 34 | -0.32394 | 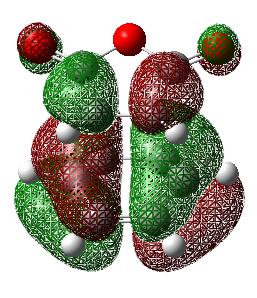 |
34 | -0.34505 | 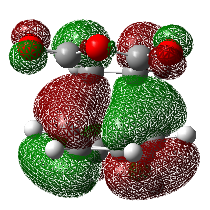 |
|
| 33 | -0.30030 | 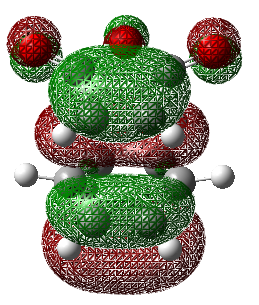 |
33 | -0.36843 | 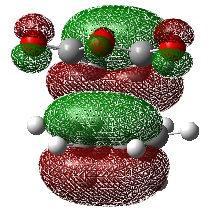 |
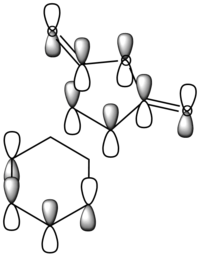
|
The molecular orbitals of exo- and endo- have the same symmetry as each other. The HOMO for both exo and endo was constructed from antisymmetric molecular orbitals of the two reactants, and this symmetry is maintained in the transition state.
For the Exo and Endo products themselves, the HOMO-LUMO energy gap was found to be 146.32 kcal/mol and 151.42 kcal/mol respectively (log files of the former can be found [here] and [here]). This HOMO-LUMO gap energy can be related to the stability of the molecules themselves. The endo experiences around 5 kcal/mol more stabilisation energy relative to that of the exo product. The reason for this may be due to the exo product having more strain, this will be looked at in more detail later.
Discussion on Selectivity
Unlike in the first Diels-Alder reaction investigated in this wiki, the previous one has the possibility of selectivity, i.e. the Exo- or Endo- products. As mentioned previously, the maleic anhydride can be thought of as electron deficient due to the electron-withdrawing character of the adjacent carbonyl groups. This EWG character acts to stabilise the molecule, lowering that of the HOMO and LUMO orbitals. This implies normal electron demand, i.e. The HOMO of the diene with the LUMO of the dieneophile. The reason for this is shown in the simplified molecular orbital diagram shown below.
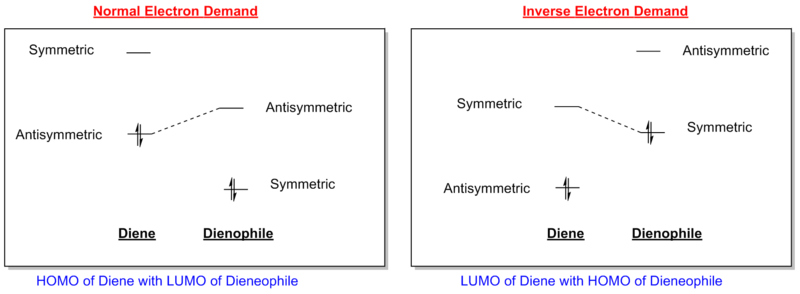
Only orbitals of the same symmetry can interact to form molecular orbitals, hence in the diagram above the antisymmetric-antisymmetric and vice-versa. The second consideration is the separation in energy, i.e. in the normal electron demand the antisymmetric energy levels are closer in energy than that of the symmetric levels thus a stronger interaction (as seen from the Klopman-Salem eqn).
One difference between the exo and endo products is the orientation of the maleic anhydride fragment in respect to the cyclohexadiene. The endo form has the maleic anhydride bent towards the only remaining C=C bond, sp2, whereas the exo is bent away in a direction towards an sp3 carbon which has two bonded hydrogens. Steric considerations very quickly become apparent in the comparison of the geometries. The exo-TS has the maleic anhydride fragment bending down directly over a C-H and thus there shall be a degree of steric repulsion. For the endo-TS the maleic anhydride fragment bends down over two sp2 carbons in which each carbon is only bonded to one hydrogen atom that is well out of the way and causes far less steric repulsion. A diagram of this is shown below.

These steric factors can contribute or even dominate the observed selectivity for the endo over that of the exo. A possible method for determining the size of this contribution would be to use molecular dynamics.
Secondary orbital Interaction (SOI)
Secondary overlap, i.e. the overlap between an additional π-orbital on the dieneophile with the HOMO of the diene (only available for endo structure), is often the prime explanation for preference of the endo-transition state. Throughout organic chemistry lectures, the lecturers have used this explanation without giving proof of its existence. This SOI explanation was initially proposed by Woodward and Hoffmann [7]. Simple molecular orbital theory shows that this explanation is indeed possible, but this raises the question on the validity of molecular orbital theory. This theory uses LCAO, the linear combination of atomic orbitals and can give a good account of observed bonding. However these orbitals are fictitious and the entire molecular orbital should be considered as this mirrors the real behaviour.
In the case of maleic anhydride and cyclohexadiene, the π-orbitals of the C=O bond may exhibit an interact with the HOMO of the cyclohexadiene. This is shown in the diagram below,
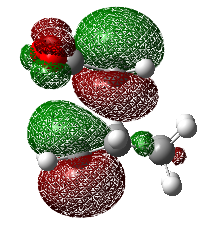
This is still not a satisfactory result as the appearance of the molecular orbitals is highly dependent upon the method and basis set that are used. It is important to not lose sight of the fact that the prime reason for the observed selectivity could essentially only be due to the steric factors previously mentioned and one should not try to force conclusions.
There is another method that has the potential to determine if any additional electronic contributions are being made. That method is the Nuclear Independent Chemical Shift, (NICS), and is shown in a subsequent section.
Inspection of the population analysis log file gave no insight into the presence of SOI since the E2 values are relatively small.
NICS Analysis
The NICS (nucleus independent Chemical Shift) method is a useful way of probing for aromaticity. It involves placement of a ghost atom (Bq) in the centre of a suspected aromatic molecule followed by the GIAO NMR calculation to look at the magnetic shielding that arises from the aromatic ring current. The presence of aromaticity will result in the ghost atom either being shielded or deshielded as dictated by the sign of the magnetic shielding value obtained (‘’in ppm’’). One takes the negative of the computed value, if this results in a negative number then aromaticity is present, if positive, then this is the case of anti-aromaticity. Much investigation using the NICS method has been carried out on aromatic and heteroaromatics systems, whereas much less has been carried out on suspected aromatic transition states. Theoretically it makes sense that this method should produce results consistent with aromaticity since the transition state involves donation of PI-electrons into PI* C=C bonds and SIGMA* C-C bonds, thus movement of PI electrons as is present in aromatic systems. An evident problem is whether the geometry of the transition state is too distorted to be thought of as aromatic. The criteria of aromaticity states that:
- There must be a 4n+2 PI-electrons involved
- A planar arrangement of p-orbitals
- Enhanced thermodynamic stability
Similar work has been done by Jiao et al. [8] on probing the aromatic nature of transition states. The literature value for the placement of the NICS probe in the centroid of the butadiene fragment in the reaction of butadiene and ethene yielded a NICS value of 23.5 ppm.
Reaction of Butadiene and Ethene
Initially the butadiene fragment was investigated. Since this is not aromatic one would expect a very low value of shielding (generally a NICS value larger than 7 ppm indicates that there is aromaticity). Ghost atoms were placed roughly in the plane of the molecule, slightly above the plane, and one was placed close to one of the C=C bonds. The values obtained are given in the table below. Note that this was done using a B3LYP 6-311G(d) optimized files, the NICS was carried out using GIAO calculation.
| NICS calculation at varying distances in a non-aromatic molecule[Log file] | |
|---|---|
| Atom | NICS (ppm) |
| In Plane | -0.23 |
| 1.37 A above plane | -0.78 |
| 3.00 A above plane | -0.23 |
| 1.56 A above C=C | -4.20 |
This data shows two key features clearly. The first being that in the plane of the molecule, the value obtained for the shielding corresponds to no aromaticity being present, which was what was predicted. Also positioning of the ghost atom in a region where the π-bond orbitals are expected to lie gives a larger NICS value, but still corresponds to no aromaticity. The reason for this is beyond the scope of this wiki.
When the transition state was probed by the same method, the NICS value for the ghost atom residing in the centre (between the butadiene and ethene carbons) was found to be -20.13 ppm. This is clearly in correspondence to aromaticity! Another calculation was carried out with the ghost atom placed in the centre of the butadiene molecule. This gave a value of 22.43 ppm, which is in correspondence to a literature value of 23.5 ppm [9]. The slight difference between these values can be accounted for by the use of a different basis set (literature used 6-311G** where as our calculation used 6-31G(d)), the log file for this calculation can be found [here]. The NMR spectrum is given below.
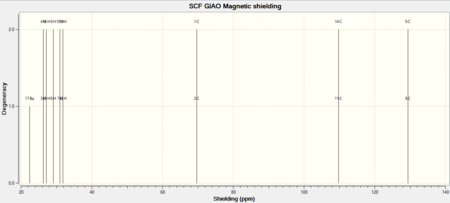
This data supports the claim that the transition state has aromatic character even though the arrangement of the p-orbitals are not planar. This highlights how resilience aromaticity can be to changes in geometry.
Reaction of Maleic Anhydride and Cyclohexadiene
As with the previous reaction, it is expected to pass through an aromatic transition state. There is more ambiguity in the placement of the ghost atom, but after several rough placements around the transition state it was determined that the position that had the most shielding was at the centre of the four reactive terminals. A discussion was had with Prof. Henry Rzepa about the placement of the ghost atom, where it was suggest that it should be placed slightly closer to the double bond that would be formed. This coincided with what was initial planned but was later rejected due to believing that this will introduce more uncertainty in σ-framework effects since the exo-TS will not have an over-hanging maleic anhydride fragment where the endo-TS will. Thus the centre of the bonding forming terminals was chosen.
Upon analysis of the exo and endo transition states two statements may be made:
- If the NICS values of the two transition states are the same (very small deviation allowed) then the degree of aromaticity is equal for both the exo and endo, which seems obvious
- If the NICS values differ, it implies there is a difference in the amount of electrons involved in the transition state or there may be a small change in geometry(change σ-contribution)
If the latter occurs, it may be explained as a manifestation of the secondary orbital overlap which acts to donate electron density into the transition state thus increasing the ring current and consequently the shielding.
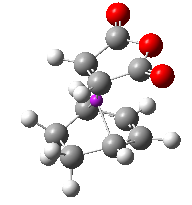 |
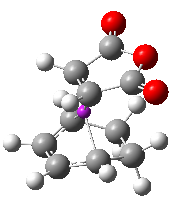 | |
| Property | Value | Value |
|---|---|---|
| Log File | [Endo-TS] | [Exo-TS] |
| File Name | TS_OTHERONE_DFT_631GD_GIAO1 | TS_WORKS_DFT_631GD_GIAO |
| File Type | .log | .log |
| Calculation Type | SP | SP |
| Calculation Method | RB3LYP | RB3LYP |
| Basis Set | 6-31G(d) | 6-31G(d) |
| Energy | -612.68339649 a.u. | -612.67931060 a.u. |
| RMS Gradient Norm | - | - |
| Dipole Moment | 6.11 D | 5.55 D |
| Point Group | Cs | Cs |
| Job Time | 2 Minutes 56.0 Seconds | 2 Minutes 58.0 Seconds |
| Bq Statement | 24 Bq Isotropic = 22.8480 Anisotropy = 42.7164 |
24 Bq Isotropic = 20.5643 Anisotropy = 35.7035 |
There can be seen a difference of 2.3 ppm in the shielding between the exo and endo transition state. The endo has a larger NICS value. The main problem with trying to draw conclusions to this observation is that the placement of the ghost atom is relatively close to the σ-framework. This framework also has shielding associated with it. However since these effects were minimized by the specific placement of the ghost atom, the 2.3 ppm difference can be considered significant.
This observation indicates that it is entirely possible that secondary orbital overlap effects of the endo-TS (which is a favourable interaction, donating electron density to the aromatic transition state) are present and contributing electron density into the transition state. A population analysis of the transition structure did not yield valuable information on this suspected effect. The E2 energies would have been expected to show the contribution of the C=O electron density to the HOMO of the diene (an E2 value greater than 20 kcal/mol is normally deemed a significant interaction but since this is secondary overlap, it may be slightly less).
Effect of Solvent
All the calculations done in this wiki assume there is no solvent present. In terms of making the computational data correlate closer to that of a real-world reaction one should consider adding a solvent. In synthesis it is uncommon to carry out a reaction in the solid state with no solvent, this is due to a poor mixing of the reactive species and thus a poor rate of reaction. Gaussian has the option of considering a solvent in a calculation. This has the effect of applying a dielectric value to the background that the molecule experiences. There are several different methods to choose from ranging from different considerations. It is important to point out that selecting a solvent, such as water, hydrogen bonding will not be considered! Hydrogen bonding can be a dominant factor in how some solvents interact with the reactants. If hydrogen bonding needs to be considered, it can be achieved by placing numerous water molecules around the reactant and selecting the solvent feature to apply a dielectric over the background. This has the drawback of being very expensive and is beyond the scope of this investigation. The effects of a dielectric value being applied to the background can be probed for species where there is a significant dipole moment.
The effect of a change in solvent polarity on the electronic energy has been investigated using a range of polar to non-polar solvents. It is expected that the transition state that has the largest dipole moment will feel the largest effect for changes in polarity.
The table below exhibits the electronic energies of the exo and endo transition states for the various solvents used.
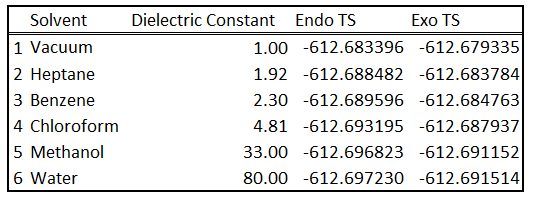
If the reaction kinetics were examined using this solvent method, it would not produce a representative account of what is happening at the molecular level. When the reactants are in solution, their solvent spheres will look very different to the solvent sphere of the transition state and the products. This difference will directly affect the local dielectric constants and the probability that the reactants will collide and successfully react. Further investigation into producing a representative picture of the solvent interactions at a molecular level may prove useful in understanding what features of a specific solvent makes it a good solvent for that particular reaction.
One cannot define what a polar solvent is by one simple quantity. The first figure shows the effect of increasing solvent polarity going left to right (this is an arbitrary measure of polarity combining dipole moments and dielectric constant), with the figure below that plotted against the different dielectric constants.
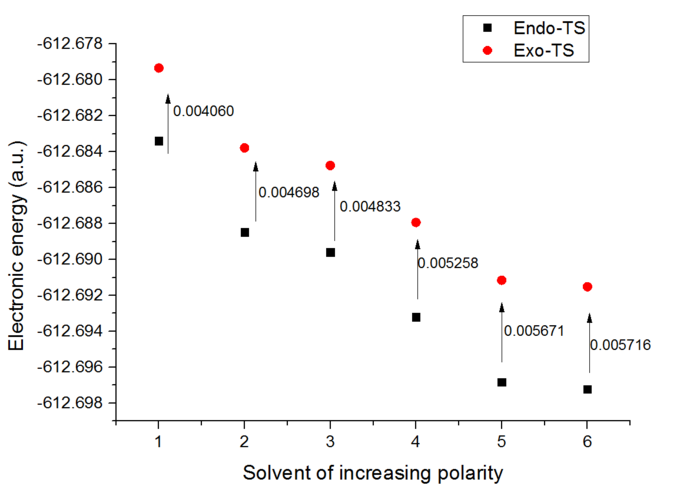
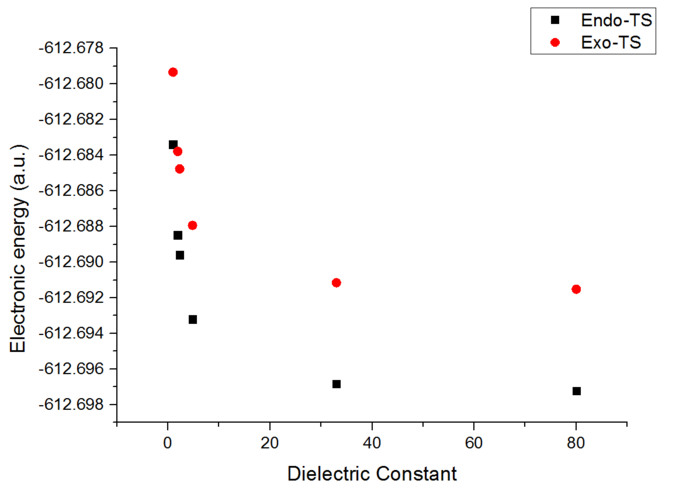
Some features present in these plots include:
- Addition of any solvent lowers the transition state energy
- The more polar the solvent, the lower the transition state energy
- An increase in polarity stabilises the endo structure more than that of the exo structure
At a greater dielectric constant, it can be seen that the increase in stabilisation becomes less and can be imagined to plateau off.
Conclusions
The methods adopted in this investigation into probing transition states yielded results that were consistent with accepted theory. Out of the methods used to determine the transition state, the QST2/3 method was favoured for not only being a specific method (unlike the hessian method) but also how in how it can be applied to more complicated systems in which there maybe more than one transition state that is similar in energy. The activation barrier of the Cope rearrangement was found to be small for the chair transition state than that of the boat for reasons including flag-pole interactions.
For the Diels-Alder reaction between maleic anhydride and cyclohexadiene, both the electronic and thermodynamic energy values suggest that the endo-product is more stable than that of the exo-product. Observing the structure of both of the optimized products it became obvious that the exo-form experiences a greater degree of steric repulsion (destabilising the product). The results from NICS calculations also implies the possible secondary orbital overlap between the orbitals on the (C=O)-O-(C=O) with the newly formed C=C bond which acts to stabilise the endo form. This SOI is likely to be highly dependent upon the system under study as stated by Wannere et al.[10]
The Diels-Alder reaction which involves no substituents on the dieneophile was shown to have a larger activation energy than that of the EWG of the maleic anhydride. This confirms the statements that the Diels-Alder cycloaddition works best for an electron deficient dieneophile and an electron rich diene (normal electron demand) due to the relative energies of the orbitals involved.
One of the key simplifications present in all of these calculations is that the system is only consisting of the molecules shown in the calculation input file. In the real world, there will be bulk effects acting, for example, hydrogen bonding with solvents, dipole dipole interactions, degrees of solvation. These effects will primarily be the reason that there is some deviation between calculated values and those values obtained by experimental practice.
Furutre Work
If one wishes to calculate the free energy of the reaction, the results we have obtained is for the case where the reaction strictly follows the path of reactants - transition state - products and nothing else. This is not the case however for a real system. Some reactants will go to a higher energy than the transition state, side reactions may be taking place. Further study into how the calculated enthalpies and free energies of reaction compare to those obtained experimentally can aide to show how well the computational approximations fit.
Another area that lies in particular interest to myself is using computational methods to explain and understand catalytic behaviour. This includes computational design of surface catalysts. As an undergraduate, there has not been much exposure to computational chemistry or catalysis for that matter beyond this lab which is what sparks my interest.
Supplementary Information
Summary Tables for Cope Reaction
Syn
| Property | Value |
|---|---|
| Log File | [Log] |
| File Name | JG_Cope_HF3-21G_syn_opt |
| File Type | .log |
| Calculation Type | FOPT |
| Calculation Method | RHF |
| Basis Set | 3-21G |
| Energy | -231.68302540 a.u. |
| RMS Gradient Norm | 0.00003415 a.u. |
| Dipole Moment | 0.3649 D |
| Point Group | Ci |
| Job Time | 19.0 Seconds |
| Item Table | Item Value Threshold Converged? Maximum Force 0.000080 0.000450 YES RMS Force 0.000020 0.000300 YES Maximum Displacement 0.000533 0.001800 YES RMS Displacement 0.000186 0.001200 YES Predicted change in Energy=-9.066469D-08 Optimization completed. |
 Low frequencies --- -154.8030   -3.2918   -2.3159   -0.0003   -0.0002    0.0007
 Low frequencies ---    1.4630   78.1617  111.3073
 ******    1 imaginary frequencies (negative Signs) ******
Syn Further Optimization
| Property | Value |
|---|---|
| Log File | [Log] |
| File Name | JG_Cope_HF3-21G_syn05_opt |
| File Type | .log |
| Calculation Type | FOPT |
| Calculation Method | RHF |
| Basis Set | 3-21G |
| Energy | -231.69266120 a.u. |
| RMS Gradient Norm | 0.00001891 a.u. |
| Dipole Moment | 0.3404 D |
| Point Group | Ci |
| Job Time | 43.0 Seconds |
| Item Table | Item Value Threshold Converged?
Maximum Force 0.000042 0.000450 YES
RMS Force 0.000011 0.000300 YES
Maximum Displacement 0.001763 0.001800 YES
RMS Displacement 0.000459 0.001200 YES
Predicted change in Energy=-2.057406D-08
Optimization completed.
-- Stationary point found.
|
 Low frequencies ---   -2.5849   -0.0009   -0.0008   -0.0004    1.4391    2.1443
 Low frequencies ---   74.6202  105.0151  130.5656
Maleic Anhydride and Cyclohexadiene Optimizations HF/6-31G(d)
 |
 |
 |
 | ||
| Property | Value | Value | Value | Value | |
|---|---|---|---|---|---|
| Log File | [Cyclohexa-1,3-diene] | [Maleic Anhydride] | [Exo-Product] | [Endo-Product] | |
| File Name | Cyclohexa13diene | maleic | JG_ExoProd_HF_631d_OPT | JG_EndoTS_OPT_HF_631Gd | |
| File Type | .log | .log | .log | .log | |
| Calculation Type | FOPT | FOPT | FOPT | FOPT | |
| Calculation Method | RHF | RHF | RHF | RHF | |
| Basis Set | 6-31G(d) | 6-31G(d) | 6-31G(d) | 6-31G(d) | |
| Energy | -231.83189770 a.u. | -377.23016625 a.u. | -609.11093668 a.u. | -609.11428197 a.u. | |
| RMS Gradient Norm | 0.00000036 a.u. | 0.00000473 a.u. | 0.00000011 a.u. | 0.00000096 a.u. | |
| Dipole Moment | 0.34 D | 4.57 D | 5.39 D | 5.55 D | |
| Point Group | C2 | C2v | CS | CS | |
| Job Time | 5 Minutes 2.9 Seconds | 3 Minutes 19.6 Seconds | 21 Minutes 40.1 Seconds | 41 Minutes 55.4 Seconds | |
| Item Table | Item Value Threshold Converged?
Maximum Force 0.000001 0.000015 YES
RMS Force 0.000000 0.000010 YES
Maximum Displacement 0.000008 0.000060 YES
RMS Displacement 0.000002 0.000040 YES
Predicted change in Energy=-1.179088D-11
Optimization completed.
-- Stationary point found. |
         Item               Value     Threshold  Converged?
 Maximum Force            0.000010     0.000015     YES
 RMS     Force            0.000004     0.000010     YES
 Maximum Displacement     0.000047     0.000060     YES
 RMS     Displacement     0.000018     0.000040     YES
 Predicted change in Energy=-6.087890D-10
 Optimization completed.
-- Stationary point found. |
       Item               Value     Threshold  Converged?
 Maximum Force            0.000000     0.000015     YES
 RMS     Force            0.000000     0.000010     YES
 Maximum Displacement     0.000002     0.000060     YES
 RMS     Displacement     0.000000     0.000040     YES
 Predicted change in Energy=-1.154444D-12
 Optimization completed.
-- Stationary point found. |
         Item               Value     Threshold  Converged?
 Maximum Force            0.000002     0.000015     YES
 RMS     Force            0.000000     0.000010     YES
 Maximum Displacement     0.000022     0.000060     YES
 RMS     Displacement     0.000004     0.000040     YES
 Predicted change in Energy=-8.474490D-11
 Optimization completed.
    -- Stationary point found.
|
Optimization Maleic Anhydride and Cyclohexadiene Transition State
 |
 | |
| Property | Value | Value |
|---|---|---|
| Log File | [Endo-TS] | [Exo-TS] |
| File Name | A_TRANSITION_STATE_THEOTHERONE2 | TransitionStateWorks |
| File Type | .log | .log |
| Calculation Type | FREQ | FREQ |
| Calculation Method | RAM1 | RAM1 |
| Basis Set | ZDO | ZDO |
| Energy | -0.05150474 a.u. | -0.05041979 a.u. |
| RMS Gradient Norm | 0.00002441 a.u. | 0.00002205 a.u. |
| Dipole Moment | 6.17 D | 5.56 D |
| Point Group | CS | CS |
| Job Time | 1.0 Seconds | 8.5 Seconds |
| Item Table | Item Value Threshold Converged?
Maximum Force 0.000066 0.000450 YES
RMS Force 0.000010 0.000300 YES
Maximum Displacement 0.001371 0.001800 YES
RMS Displacement 0.000197 0.001200 YES
Predicted change in Energy=-6.403229D-08
Optimization completed.
-- Stationary point found. |
         Item               Value     Threshold  Converged?
 Maximum Force            0.000040     0.000450     YES
 RMS     Force            0.000009     0.000300     YES
 Maximum Displacement     0.001758     0.001800     YES
 RMS     Displacement     0.000358     0.001200     YES
 Predicted change in Energy=-6.605220D-08
 Optimization completed.
    -- Stationary point found.
|
References
- ↑ H. Rzepa, [DOI]
- ↑ [DOI]
- ↑ O. Wiest, K. Black, K. Houk, J. Am. Chem. Soc., 1994, 116, 10336-10337
- ↑ L. S. Bartell, JACS, 1959, 3497, [DOI]
- ↑ L. S. Bartell, R. A. Bonham, JACS, 1959', 31, [DOI]
- ↑ Housecroft, Inorganic Chemistry, 2008
- ↑ R. Hoffmann, R. Woodward, 1965, [DOI]
- ↑ H. Jiao, P. Schleyer; J. Phys. Org. Chem.; 1998, 11, 655-662
- ↑ H. Jiao, P. Schleyer; J. Phys. Org. Chem.; 1998, 11, 655-662
- ↑ C. Wannere, A. Paul, R. Herges, K. Houk, H. Schaefer, P. Schleyer, 2006, 28, 1, [DOI]


