Rep:Mod:Jw1707
BH3 Optimisation
The Guassview programme was used to draw a planar BH3 molecule then a Gaussian calculation with B3LYP method and the 3-21G basis set, this is a relatively simple basis set which means that it is not overly accurate but it is good enough for the purposes of this calculation and also quick. As explained later the optimisation works by changing the geometry until the minimum point is found on the potential energy surface.
The jmol of the optimised structure can be seen here
The results of the optimisation were summarised in the following table:
| File Name | JONATHANWEINER_BH3_OPT.log |
|---|---|
| File Type | .log |
| Calculation Type | FOPT |
| Calculation Method | RB3LYP |
| Basis Set | 3-21G |
| Charge | 0 |
| Spin | Singlet |
| E(RB3LYP) | -26.46226338au = -69476.67779664 Kj/mol |
| RMS Gradient Norm | 0.00020672au = -0.54274340134 Kj/mol |
| Imaginary Freq | |
| Dipole Moment | 0.0000 Debye |
| Point Group | D3H |
| Job cpu time: 0 days 0 hours 0 minutes 19.0 seconds. |
A quick check with the inquiry tool in Gausview found the bond angles to be 120.0° and the bond lengths to be 1.19Å. Which is exactly the values found in the Handbook of Chemistry & Physics Online by the CRC.
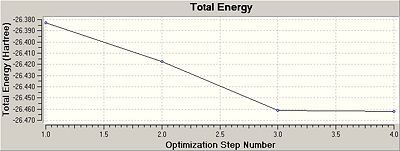
Under Results- optimisation, the following graphs were displayed showing that the result was at the minimum energy and at the lowest gradient.

Frequency Analysis of BH3
A further calculation was made on the optimised molecule, to calculate the frequency. This is an important second stage, not just to let to us know the vibrational frequencies of the molecule but also to confirm that the molecule is truly at a the optimised geometry. The geometry optimisation works by analysing the first derivative of the potential energy surface, by changing the geometry until the first derivative is equal to zero and hence hopefully the lowest energy and the optimised structure. Although it is possible that the potential energy surface is flat because it has reached a maxima which would mean that the geometry is that of a transition state. To confirm that the structure isn't a transition state we do a second derivative calculation and if the answer is positive we know that a minima has been reached. These second derivative values also tell us the vibrational frequencies, which were reported as follows:
Full mass-weighted force constant matrix:
Low frequencies ---  -66.7625  -66.3592  -66.3589   -0.0020    0.0031    0.2123
Low frequencies --- 1144.1483 1203.6413 1203.6424
Diagonal vibrational polarizability:
       0.6013547       0.6012848       1.9090953
Harmonic frequencies (cm**-1), IR intensities (KM/Mole), Raman scattering
activities (A**4/AMU), depolarization ratios for plane and unpolarized
incident light, reduced masses (AMU), force constants (mDyne/A),
and normal coordinates:
                    1                      2                      3
                   A"                     E'                     E'
Frequencies --  1144.1483              1203.6413              1203.6424
Red. masses --     1.2531                 1.1085                 1.1085
Frc consts  --     0.9665                 0.9462                 0.9462
IR Inten    --    92.8665                12.3148                12.3173
 Atom  AN      X      Y      Z        X      Y      Z        X      Y      Z
    1   5     0.00   0.00   0.16     0.00   0.10   0.00    -0.10   0.00   0.00
    2   1     0.00   0.00  -0.57     0.00   0.08   0.00     0.81   0.00   0.00
    3   1     0.00   0.00  -0.57    -0.38  -0.59   0.00     0.14   0.38   0.00
    4   1     0.00   0.00  -0.57     0.38  -0.59   0.00     0.14  -0.38   0.00
                    4                      5                      6
                   A'                     E'                     E'
Frequencies --  2598.4249              2737.4364              2737.4371
Red. masses --     1.0078                 1.1260                 1.1260
Frc consts  --     4.0092                 4.9714                 4.9714
IR Inten    --     0.0000               103.7400               103.7333
 Atom  AN      X      Y      Z        X      Y      Z        X      Y      Z
    1   5     0.00   0.00   0.00     0.11   0.00   0.00     0.00   0.11   0.00
    2   1     0.00   0.58   0.00     0.02   0.00   0.00     0.00  -0.81   0.00
    3   1     0.50  -0.29   0.00    -0.60   0.36   0.00     0.36  -0.19   0.00
    4   1    -0.50  -0.29   0.00    -0.60  -0.36   0.00    -0.36  -0.19   0.00
It is interesting to note that although the initial molecule was given a fixed symmetry of D3h, when the calculation returned from the frequency calculation the symmetry point group reported in the summary file had switched to C3h. The difference between these two point groups is the presence of a plane of symmetry.
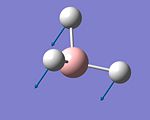
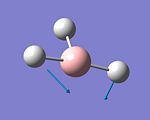
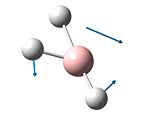
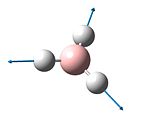
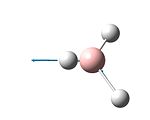
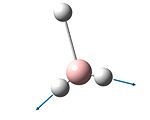
Using the Gaussview program to analyze the output from the frequency calculation we can visualise these vibrations:
IR Spectrum

From the vibrational information calculated, it is possible to predict what the infra red spectroscopy spectrum will look like, in this case the predicted spectrum has been flipped in both the x and the y axes so that it will be more like the experimental spectra obtained in a lab.
In the spectrum only three peaks can be seen, this is odd considering the frequency data clearly showed 6 different vibrational modes. However a closer look at the frequency calculation data will reveal that the some of the peaks were close in frequency value so i nthe spectra the lines overlap and only result in one peak. In addition the fourth vibration had an intensity of 0, this is because of the way the IR calcualtion works. The IR intensity is related to the change of dipole in the molecule, the fourth vibration is entirely symmetric around the centre of charge distribution so there is no change in dipole so no peak can be seen in the spectrum.
Population Analysis BH3
A Molecular orbital calculation was performed on the optimised BH3 molecule using Gaussian with the same method and Basis Set but using the Energy calculation instead of the optimisation or frequency. The resulting energy levels and Molecular Orbital images were produced form the checkpoint file. A Molecular Orbital diagram was produced using the Linear Combination of Atomic orbitals (LCAO) approach and the resulting orbitals were compared with the calculations and images from Gaussian as seen below:

The molecular orbitals calculated look extremely similar to those predicted by the LCAO approach and allows us to appreciate just how useful the LCAO is a tool for the approximation of the molecular orbitals. However the LCAO gives us very little information on the relative energies of the molecular orbitals, here the MO calculations have been helpful in showing that the 3a' MO is of higher energy (just) than the 2e' orbital, although this may be due to the simplistic basis set used. Perhaps a higher basis set would put the 3a' MO lower.
BCl3 Optimisation
The BCl3 was optimised with a more advanced, medium level basis set LanL2MB. Having fixed the symmetry to D3h, the following molecule was produced the optimisation results can be seen in the following table:
| File Name | jonathanWeiner_BCl3_Opt |
|---|---|
| File Type | .log |
| Calculation Type | FOPT |
| Calculation Method | RB3LYP |
| Basis Set | LANL2MB |
| Charge | 0 |
| Spin | Singlet |
| E(RB3LYP) | -69.43926345 a.u. = -182312.8000758kl/mol |
| RMS Gradient Norm | 0.00082067 a.u. = 2.15466924913kj/mol |
| Imaginary Freq | |
| Dipole Moment | 0.0000 Debye |
| Point Group | D3H |
| B-Cl bond length | 1.87Å |
| Cl-B-Cl bond angle | 120.0° |
Structural Analysis
What is the calculation method? The calculation method used was B3 LYP
What is the basis set? LANL2MB Why must you use the same method and basis set for both calculations?
The method and basis set in the optimisation calculation find the minimum point on the potential energy surface for the molecule, each method and basis set take into account different interactions and properties so will find different energies so the minimum for one basis set is not necessarily the minimal point for another. If you use one method and basis set for your optimisation and then another basis set for your frequency analysis or other calculation then the geometry you are using will be relatively excited compared to the ideal geometry for the second basis set and will not give you the correct results.
Why do you have to carry out a frequency analysis? The frequency analysis does a second derivative which which will tell us whether the zero gradient point found is as a result of a minima or a maxima, we are only interested in looking at the minima which is the optimised geometry of the molecule and not the maxima which would be the geometry of a transition state, by checking that the frequency values are all positive we can confirm that the geometry found is at a minimal energy on the potential energy surface
Compare the the optimised B-Cl bond distances and Cl-B-Cl bond angles to the literature
| Lit values[1] | Calculated values | |
|---|---|---|
| Cl-B-Cl Bond angle | 120.0° | 120.0° |
| B-Cl Bond Length | 1.72Å | 1.87Å |
The calculation clearly shows an agreement with the experimental values when it comes to the bond angle however the bond length differs significantly. This is probably due to the Minimum Basis method used, which doesnt take into account the extra backbonding between the Cl- and the Boron centre, which shortens the bond length,
In some structures gaussview does not draw in the bonds where we expect, does this mean there is no bond? Why? Gaussview doesn't really know where the bonds are, as discussed later, there is no such physical thing as a bond, rather we use bonds to help us conceptualise the interaction between the atomic nuclei. Gaussview has preset distance values which it uses to guess what is or isn't bonded, however the calculations don't always conform to those values, so sometimes even though an atom is covalently bonded, due to the specific geometry of that molecule the bond length will be different from what Gaussview would expect and hence gaussview will not draw a bond there.
What is a bond?
A bond is when two atomic nuclei are held together by some electrostatic force. There are many types of bonding resulting from different electrostatic forces resulting in different strengths and properties of the bonds. For example an ionic bond is caused by the electrostatic attraction between the overall negative charge on one anion and the positive charge on the cation, this is a very strong bond compared to something like hydrogen bonding. The perhaps more important type of bonding is the covalent bond where the sharing of electron density between two atomic nuclei is favourable enough to overcome the nuclear repulsion and hence both atomic nuclei are held in place.
What symmetry do you expect for the ground state structure, and what symmetry does gaussview use? Comment briefly on this.
VSEPR theory tells us that the electrons and hence the bonds will try and move as afar apart as possible, around the Boron atom there are three bonds and hence the most favourable conformation will be where the Cl groups are each 120° apart which will give us the planar BCl3 molecule. Which has a D3h symmetry. Gaussview indeed calculates a D3h point group. This is in contrast with BH3 where in fact Gaussview assigned a point group of C3h, this is perhaps due to the very basic basis set used which may have given the molecule a slightly pyrimidal structure just due to the lack of accuracy and hence the C3h point group
How long did your calculations take?
The calculation took 13s to run
Cis and Trans isomers of Mo(CO)4(PCl3)2
Optimisations
The Mo(CO)4(PCl3)2 molecule can be found in both the cis and trans isomers. These molecules are significantly more complicated than the boron molecules dealt with until now so a more significant optimisation with higher basis sets was required.
Initial Optimisation
The initial optimisation was performed with a B3LYP-LANL2MB basis set, this is still a minimal basis set but uses pseudo functions to take into account the larger atoms.
Trans Isomer: http://hdl.handle.net/10042/to-3764
Cis Isomer: http://hdl.handle.net/10042/to-3765
Pentahelicene |
Pentahelicene |
Secondary Optimisation with better basis set
The optimised molecule was then further optimised using the higher basis set LANL2DZ, Trans: http://hdl.handle.net/10042/to-3766
Cis: http://hdl.handle.net/10042/to-3767
Frequency Calculation
The optimisation was confirmed to be a minima using a frequency calculation. The frequencies all came out positive for both isomers confirming that the molecule was in an optimised geometry.
Trans: http://hdl.handle.net/10042/to-3779
Cis: http://hdl.handle.net/10042/to-3780
Note in this final calculation, both the calculations both came back with the two displacement calculations reported as unconverged, although the vibrations came out all positive. After consultation with a demonstrator it was decided that this wasn't an issue and it was ignored..
A comparison of the Cis and Trans Isomers
An analysis of the two isomers was performed by comparing the structure, relative energies and frequencies:
Structural Comparison with literature
| Mo-P Bond Length (Å) | P-Cl bond length(Å) | P-Cl eclipsed with Mo-C(Å) | Geometry | |
|---|---|---|---|---|
| Literature Value | 2.462 (standard deviation 0.046) [2] | 2.027 [3] | ||
| Trans Isomer | 2.45 | 2.24 | 2.24 | Octahedral |
| Cis Isomer | 2.51 | 2.24 | 2.23 | Octahedral |
| Free P-Cl3 = 2.043 |
The cis isomer has a significantly longer Mo-P bond length than the trans equivalent. A likely explanation is that the change in bond length is due to the PCl3 being a relatively bulky group. In the case of the trans isomer the two groups were across from each other so there is no risk of a steric clash, in the case of the the cis isomer the molecule tries to distance the two PCl3 groups from each other by extending the bond length slightly and hence limiting the steric clash. The literature values were more akin to the trans system. There was a slight difference noted in both isomers between the P-Cl bond length of the P-Cl bond length eclipsed with the Mo-C and those which weren't. Once the errors of the calculation had been accounted for the effect was almost negligible though, a possible explanation could be a small repulsion between the C=O and the Cl.
Relative Energies
| Energy (Hartree) | Energy (KJ/mol) | |
|---|---|---|
| Trans isomer | -623.576 | -1637200 |
| Cis Isomer | -623.577 | -1637200 |
The calculated energies are very close in value, this may be due to the the geometries not being entirely optimised, a better basis set would give more accurate results. The results show the trans isomer to be marginally lower in energy than the cis equivalent. This is a logical result as the thing that could effect the relative energies of the isomers is the steric and coloumbic effect of the PCl3 ligands on each other and on the CO ligands. The trans isomer has it's PCl3 groups away from each other so there is no interaction between them while in cis isomer it is likely that the steric or electrostatic repulsion between the two PCl3 ligands cause the molecule to take a slightly higher energy . It may be interesting to replace the Cl atoms with the smaller H atoms and see the effect on the relative energies. One would expect less of a difference in relative energy as the H is both smaller and less polar.
Frequency Analysis
Although the two isomers have the same molecular formula, they have significantly different IR spectra in a few key areas. This is mainly due to the different symmetry of the two groups whilst the trans isomer has a D4h symmetry point group the cis has the less symmetric C2v point group. One of the more noticeable differences is in the carbonyl stretching frequencies. As shown below, the peaks have also been compared to literature values:
| Calculated C=O stretching frequencies (cm-1) | Relative intensities | Literature frequencies (cm-1)[4] | |
| Trans | 1950 | 1475 | 1944 |
| 1951 | 1467 | 2018 | |
| 1977 | 0.7 | 1889 | |
| 2031 | 3.8 | 1904 | |
| Cis | 1946 | 764 | 1867 |
| 1949 | 1498 | 1896 | |
| 1959 | 633 | 1924 | |
| 2024 | 599 | 2026 |
While the cis isomer has four highly intense peaks, the trans isomer only has two significant peaks and two almost negligeable ones. This is because the intensity arises due to a change in dipole as a result of the vibration. In the case if the trans isomer, two of the vibrations have equal stretching of the CO in parallel directions resulting in no overall change of dipole which is why the peak has no intensity in the IR spectrum. See for example in the following C=O stretch where there is no overall change in dipole due to the symmetric stretch and hence an almost negligeable peak:
Vibration |
Shamir et al[4], explain that the reason this peak exists at all is probably due to a breakdown of the selection rules in the solid state. The IR frequencies initially seem to compare well with the literature values however that is before the 10% systematic error is taken into account for the calculated errors. Once that is accounted for, the values are about 100cm-1 off the reported values, it is possible that using a higher basis set would give better answers.
There were two particularly low energy vibrations ( 4.98 and 6.17 cm-1 and both of very low intensity too) for the Trans isomer both of which involved the rocking motion of the PCl3 group relative to the carbonyl groups (one with the PCl groups in sync and one where they were spinning in opposite directions), this is because this bond is almost entirely labile and free to turn and only the weak gauche repulsion of the carbonyl groups forces it to sit in its minimal conformation.
The equivalent vibrations in the cis isomer were of higher energy (10.79 and 16.79cm-1) this is because the neighbouring PCl3 is more bulky and will have a stronger steric effect on holding the other PCl3 group still. The effect of having such a low energy vibration means that at room temperature we can assume these vibrations to be active and we can't assume that the actual molecules will have the optimal geometry calculated.
Mini Project: - Influence of ligand field tetragonality on the ground state spin on Nickel Complex
Introduction
The neutral Ni(II)(diamine)2(anion)2 complexes have different visible and magnetic properties (diamagnetic or paramagnetic) depending on the anion or diamine used. In this project the two complexes Ni(II)(Et2en)2Cl2 and Ni(II)(Et2en)2I2 will be optimised using computational methods to work out the the effect of changing the ligand on the Nickel complex.
Optimisation
The molecules in question were relatively complicated and it was necessary to do the optimisation in several steps to limit the calculation time and maximise accuracy. Initially the complex was drawn on Gaussview without any anion ligands and sent off for optimisation using a basic basis set (B3LYP LANL2MB) to ensure that the diamine ligands were optimised before adding the anion ligands. optimisation file: http://hdl.handle.net/10042/to-3837
In the next stage the Cl− and I− anions were added to the metal centre on Gaussview. Rather than rely on the default bond length setting from Gaussview, the literature values for Ni-I and Ni-Cl bonds were found from the CRC Handbook of Chemistry and Physics which were 2.348 and 2.076A respectively. This was supposed to limit the optimise the calculation time by starting the calculation nearer the ideal optimisation. the optimisation was continued with the minimal basis set. Chloride output file http://hdl.handle.net/10042/to-4114 Iodide output file: http://hdl.handle.net/10042/to-4116
In the case of the iodide complex the molecule failed to optimise after 50 cycles and after a further 70 cycles and over 7 hours of cpu time it still hadn't converged. Although a close look at the optimisation profile showed the that the gradient was almost flat. After consulting with a demonstrator it was clear that the minima was clearly very broad and that large change in geometry had a relatively small change on the energy and hence the calculation was having difficulty in converging. So it was decided to continue with the optimisation.
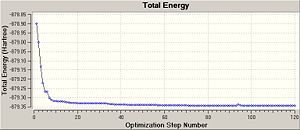
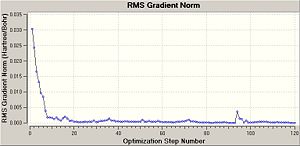
The optimisation was continued using the higher basis set LANL2DZ,
iodide: http://hdl.handle.net/10042/to-4105 chloride: http://hdl.handle.net/10042/to-3846
These optimisations had interesting results, in the chloride complex the chlorides were more or less symmetrically arranged around the Ni centre although the bond lengths were quite different from the Ni-Cl bond length found in the literature (2.32Å and 2.31Å as opposed to 2.08Å). Also the nitrogens weren't arranged evenly in a square planar arrangement, rather they were in a diamond formation around the Ni. Two were bonded at a reasonable covalent bond length of 1.93Å and the other two were further apart at 3.02Å from the Ni centre. More peculiar was the iodide complex, here one of the iodine anions is held inplace 3.33Å away from the Ni centre and the other appears to have almost dissociated, with a bond length of 4.49Å. I think it is fair to assume that this iodine is held in place by the three neighbouring hydrogens and not the Ni atom. Iodine is known to be a very polarizeable atom so it probably isn't just a purely ionic interaction with the overall positively charged molecule.
Vibrational calculation
The final part of the optimisation was a frequency calculation which as noted earlier also serves to confirm that the optimisation is at a minima.
chloride complex: http://hdl.handle.net/10042/to-4134 iodide complex: http://hdl.handle.net/10042/to-4104
The frequencies all came out with positive values which confirms that both optimisations were at minima on the potential energy surface (although there is still the possibility that this is a localised minima and that a lower energy optimisation exists, although looking at the optimisation profile this seems unlikely). Looking at the vibrational frequencies, there are a few interesting differences in the vibrations. Whilst the there are two significant Ni-Cl bending frequencies at 128 and 172cm-1, while there are no equivalent Ni-I bending equivalent. This seems to further suggest that the I and Cl anions are coordinated differently to the complex.
Singlet and triplet calculations
The magnetic susceptibility of the two compounds is known to differ. While the NiY2Cl2 is known to be paramagnetic and the NiY2I2 complex is known to be diamagnetic, this difference has been assumed to be as a result of the anion ligand affect on the ground state spin. So a comparison was done with the triplet spin states of the same molecules.
Ni chloride triplet spin state optimisation: http://hdl.handle.net/10042/to-3924 and frequency calculation http://hdl.handle.net/10042/to-4103
Ni Iodide triplet spin state optimisation: http://hdl.handle.net/10042/to-4107 and frequency calculation http://hdl.handle.net/10042/to-4102
The results don't seem to differ drastically from those of the singlet spin state, both in terms of optimised geometry and in terms of vibrational frequencies. A further comparison was done in terms of the molecular orbitals:
Molecular Orbital calculations
Singlet Chloride compound http://hdl.handle.net/10042/to-4106 Triplet Chloride compound http://hdl.handle.net/10042/to-4101
Singlet iodide compound http://hdl.handle.net/10042/to-4100 Triplet iodide compound http://hdl.handle.net/10042/to-4099
A comparison of the HOMO-LUMO orbitals and the orbitals a bit higher and lower in energy showed that there is little difference in the orbitals between the singlet and triplet states.
Conclusion
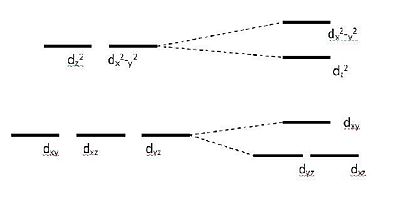
Overall the calculations seem to imply that the difference in magnetic susceptibility between the iodine and chlorine anion complexes is mainly due to the change in geometry. The chloride anion complex has the Ni in a slightly distorted octahedral coordination while the iodine anion complex has one iodide not really bonded to the metal centre so the Ni can be said to be in a square pyramidal coordination. Using a Ligand Field theory approximation we can assume that removing one of the ligands from the z axis will have the following effect:
References
- ↑ S. Reinhardt M. Gastreicha and C. M. Marian Phys. Chem. Chem. Phys., 2000, 2, 955 - 963, DOI:10.1039/a908247f
- ↑ (From Handbook of Chemistry & Physics Online, CRC the Bond Length is for Mo-PMe3 which is assumed to be similar)
- ↑ for Mo(CO)5PCl3 see M. S. Davies, M. J. Aroney, I. E. Buys, T. W. Hambley, J. L. Calvert Inorg. Chem., 1995, 34 (1), pp 330–336 DOI:10.1021/ic00105a051
- ↑ 4.0 4.1 J. Shamir , A. Givan, M. Ardon, G. Ashkenazi Journal Of Raman Spectroscopy 1993, 24, 101 DOI:10.1002/jrs.1250240208

