Rep:Mod:Jun Lore
Borane (BH3)
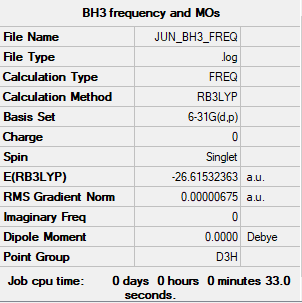
- BH3 B-H bond length:1.192 Å
- BH3 H-B-H bond angle:120.0°
Calculation information
Frequency file can be found here JUN_BH3_FREQ.LOG
B3LYP/6-31G(d,p)
         Item               Value     Threshold  Converged?
 Maximum Force            0.000014     0.000450     YES
 RMS     Force            0.000007     0.000300     YES
 Maximum Displacement     0.000053     0.001800     YES
 RMS     Displacement     0.000027     0.001200     YES
 Predicted change in Energy=-1.076094D-09
 Optimization completed.
    -- Stationary point found.
Summary table of results
Vibrational Information
Low frequency lines
 Low frequencies ---   -7.5936   -1.5614   -0.0054    0.6514    6.9319    7.1055
 Low frequencies --- 1162.9677 1213.1634 1213.1661
Rotatable 3d image of optimized BH3
BH3 molecule |
Table of vibrational results
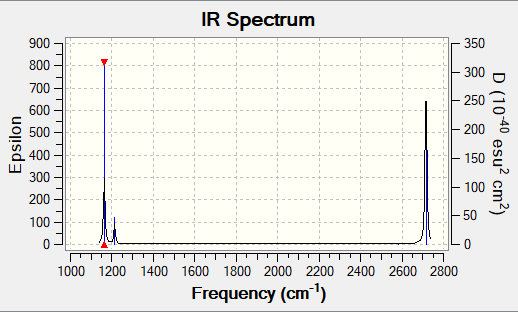
| wavenumber (cm-1 | Intensity (arbitrary units) | symmetry | IR active? | type |
| a) 1163 | 93 | A2" | yes | out-of-plane bend |
| b) 1213 | 14 | E' | very slight | bend |
| c) 1213 | 14 | E' | very slight | bend |
| d) 2582 | 0 | A1' | no | symmetric stretch |
| e) 2716 | 126 | E' | yes | asymmetric stretch |
| f) 2716 | 126 | E' | yes | asymmetric stretch |
Vibrational spectrum
Despite the fact that there are 6 vibrations that arise from the calculation,
only 3 peaks are present. This is due to two reasons. Firstly some of the vibrations
are double degenerate ( E') and thus they only lead to one peak in the spectrum
i.e. vibrations b&c (1213.16 cm-1) and vibrations e&f (2715.56 cm-1). Secondly, vibration
d is not IR active as it is a symmetric stretch that doesn't lead to a change in the
dipole moment of the molecule. Thus it doesn't appear in the spectrum.
Molecular orbital calculations
The molecular orbital diagram for BH3 is illustrated below:
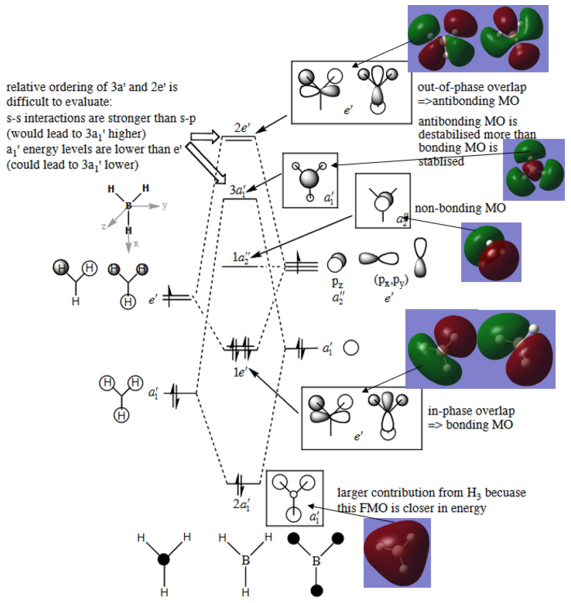
T.Hunt, 2018, The MO diagram of BH3 - Model answers
Molecular Orbitals in Inorganic Chemistry, Imperial College London
The calculated Molecular Orbitals are in close agreement with the LCAO's diagrams drawn.
This illustrates the usefulness of LCAO's approach and how MO's can be easily and quickly be
derived from a simple model, with great accuracy without the need of a rigorous calculation.
However, there is still some difference comparing 3a1 and 2e MOs.
Correct inclusion of all of the calculated MOs with the corresponding LCAO MOs on the diagram. You've made an ok evaluation of the usefulness of the LCAO approach but it is very brief and you haven't really discussed the similarities and differences, i.e. what differences are there when comparing the 3a1' and 2e' MOs? Smf115 (talk) 12:33, 2 June 2019 (BST)
Ammonia (NH3)
Calculation information
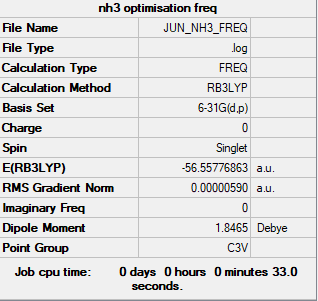
Complete optimisation calculations and generated data can be found here JUN_NH3_FREQ.LOG
B3LYP/6-31G(d,p)
         Item               Value     Threshold  Converged?
 Maximum Force            0.000013     0.000450     YES
 RMS     Force            0.000006     0.000300     YES
 Maximum Displacement     0.000039     0.001800     YES
 RMS     Displacement     0.000013     0.001200     YES
 Predicted change in Energy=-3.862150D-10
 Optimization completed.
    -- Stationary point found.
Low frequency lines
Low frequencies ---   -8.5646   -8.5588   -0.0044    0.0454    0.1784   26.4183
Low frequencies --- 1089.7603 1694.1865 1694.1865
Summary table of results
Rotatable 3d image of optimized NH3
NH3 molecule |
NH3BH3
calculation information
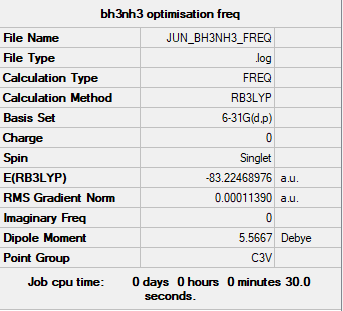
Complete optimisation calculations and generated data can be found here JUN_BH3NH3_FREQ.LOG
B3LYP/6-31G(d,p)
         Item               Value     Threshold  Converged?
 Maximum Force            0.000372     0.000450     YES
 RMS     Force            0.000114     0.000300     YES
 Maximum Displacement     0.001434     0.001800     YES
 RMS     Displacement     0.000444     0.001200     YES
 Predicted change in Energy=-5.375428D-07
 Optimization completed.
    -- Stationary point found.
Low frequency lines
Low frequencies ---   -0.0674   -0.0572   -0.0066   16.7271   16.7329   41.6572
Low frequencies ---  265.4971  634.5783  640.0015
Summary table
Rotatable 3d image of optimized NH3BH3
BH3NH3 molecule |
- ASSOCIATION ENERGY:
- E(NH3) = -56.55777 a.u.
- E(BH3) = -26.61532 a.u.
- E(NH3BH3) = -83.22469 a.u
- ΔE= -83.22469 - (-56.55777 -26.61532) =-0.05160 a.u. or -135.476 kJ/mol
Comparing to the typical Carbon-Carbon in an alkyl chain with bond energy
around 348 kJ/mol and the typical C-N bond of strength 308 kJ/mol,
the dative covalent bond in BH3NH3 of strength 135 kJ/mol can be considered a weak bond.
Correct calculation and good comparisons made. To improve though, you need to consider the accuracy of the final reported value (nearest kJmol-1) and any literature values should be referenced. Smf115 (talk) 12:42, 2 June 2019 (BST)
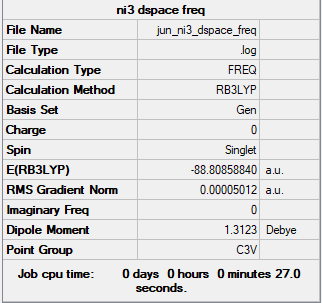
PP and basis sets for NI3
Calculations and Optimisation
Complete optimisation calculations and generated data can be found here JUN_NI3_DSPACE_FREQ.LOG
B3LYP/6-31G(d,p)LANL2DZ NI3
         Item               Value     Threshold  Converged?
 Maximum Force            0.000140     0.000450     YES
 RMS     Force            0.000092     0.000300     YES
 Maximum Displacement     0.001083     0.001800     YES
 RMS     Displacement     0.000807     0.001200     YES
 Predicted change in Energy=-1.750931D-07
 Optimization completed.
    -- Stationary point found.
Low frequency lines
Low frequencies ---  -12.7235  -12.7174   -6.4219   -0.0039    0.0189    0.0620
Low frequencies ---  101.0768  101.0775  147.4583
Summary table
Rotatable 3d image of optimized NI3
Optimised NI3 molecule |
The optimised distance is 2.184 Å
Correct implementation of the pseudopotential and nice structure information throughout. Smf115 (talk) 12:43, 2 June 2019 (BST)
MINI PROJECT-IONIC LIQUIDS
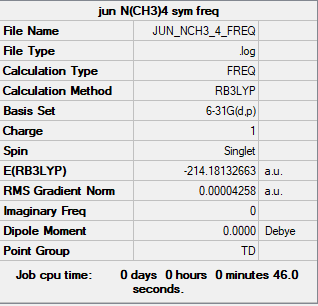
[N(Me)4]+
Calculations and Optimisation
Complete optimisation calculations and generated data can be found here JUN_NCH3_4_FREQ.LOG
B3LYP/6-31G(d,p)
         Item               Value     Threshold  Converged?
 Maximum Force            0.000083     0.000450     YES
 RMS     Force            0.000044     0.000300     YES
 Maximum Displacement     0.000929     0.001800     YES
 RMS     Displacement     0.000356     0.001200     YES
 Predicted change in Energy=-3.710295D-07
 Optimization completed.
    -- Stationary point found.
Low frequency lines
Low frequencies ---   -0.0011   -0.0007   -0.0006   34.3580   34.3580   34.3580
Low frequencies ---  216.2193  315.7261  315.7261
Summary table
Rotatable 3d image of optimized [N(CH3)4]+
Optimised [N(Me)4]+ molecule |
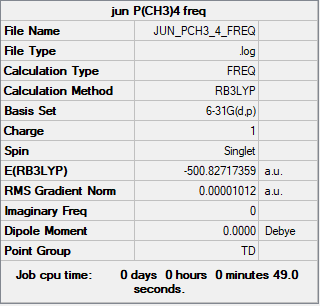
[P(Me)4]+
Calculations and Optimisation
Complete optimisation calculations and generated data can be found here JUN_PCH3_4_FREQ.LOG
B3LYP/6-31G(d,p)
          Item               Value     Threshold  Converged?
 Maximum Force            0.000035     0.000450     YES
 RMS     Force            0.000010     0.000300     YES
 Maximum Displacement     0.000241     0.001800     YES
 RMS     Displacement     0.000133     0.001200     YES
 Predicted change in Energy=-2.345692D-08
 Optimization completed.
    -- Stationary point found.
Low frequency lines
Low frequencies ---    0.0018    0.0026    0.0029   50.6302   50.6302   50.6302
Low frequencies ---  187.9222  213.0070  213.0070
Summary table
Rotatable 3d image of optimized [P(CH3)4]+
Optimised [P(Me)4]+ molecule |
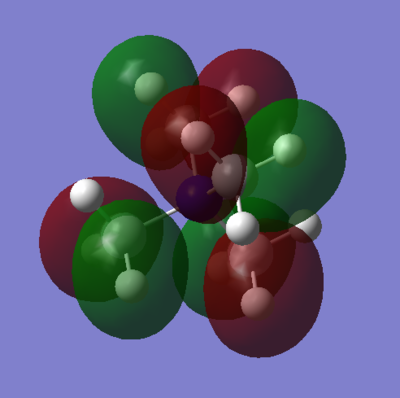
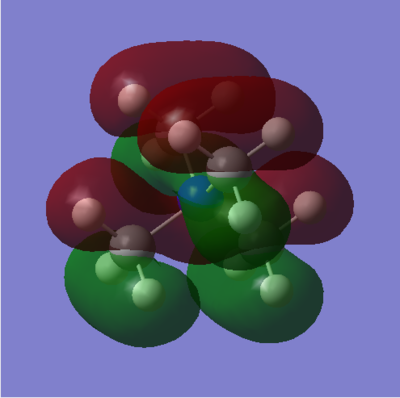
Molecular Orbital Calculations
| MO 9 | 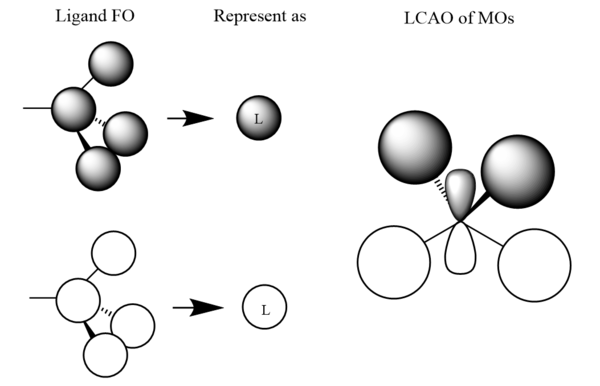
|

|
|---|
| MO 16 | 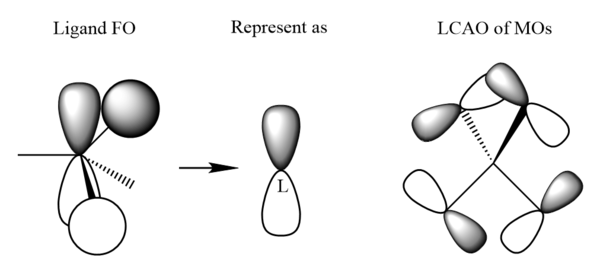
|
|
|---|
| MO 19 | 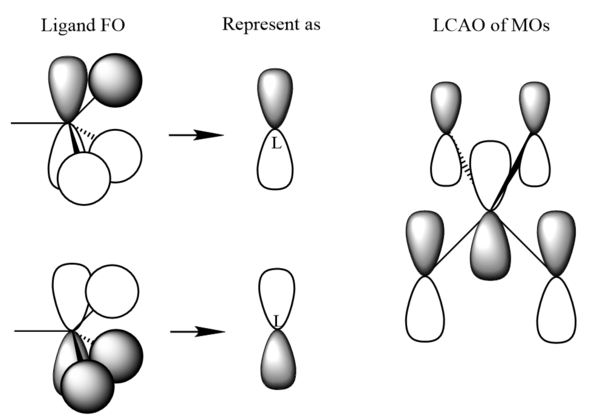
|
|
|---|
A good range of MOs selected and your FOs and LCAOs are all correct. To improve, it would have been good to include some analysis of the MOs and an evaluation of the overall character to illustrate the range selected. Smf115 (talk) 19:24, 4 June 2019 (BST)
Charge Distribution Calculation
A full NBO charge analysis was performed with a range of -1.7 to +1.7
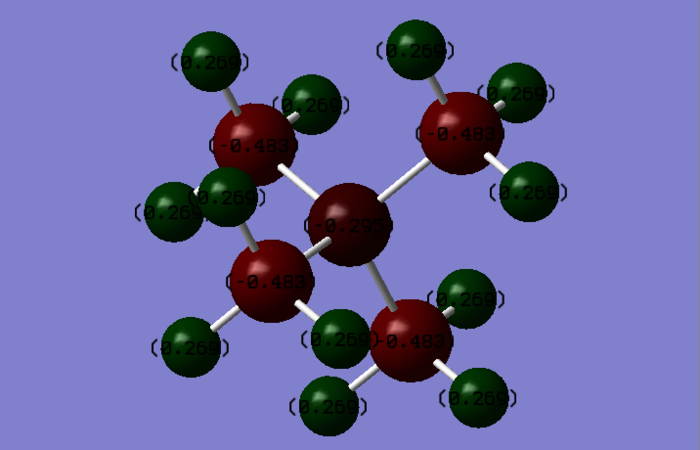
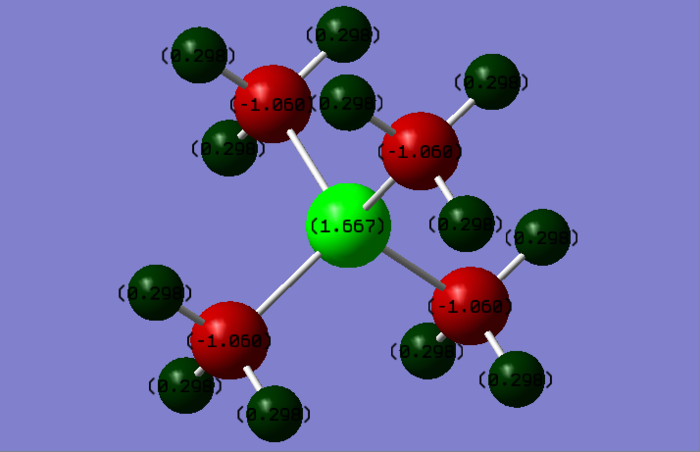
[N(CH3)4]+ charges (DEBYE):
- Nitrogen: -0.30
- Hydrogen: 0.27
- Carbon: -0.48
[P(CH3)4]+ charges (DEBYE):
- Phosphorous: 1.67
- Hydrogen: 0.30
- Carbon: -1.06
From the data shown, it can be noticed that in [N(CH3)4]+, N and C atoms carry
the negative charge and the hydrogen carries the positive charge. That is due to the different
electronegativity of the atoms, the order of which is N > C > H. Therefore, carbon is the most
negative atom in the cation which pull the electrons toward themselves and make the hydrogen
become positive in the cation. N is also electronegative so also carries the negative charge on
it. For [P(CH3)4]+, the decreasing order of electronegativity is C > P > H. The carbon pulls electrons
on hydrogens and phosphorus making itself and hydrogens more positive, due to carbon is higher
in electronegativity.
Another information can be derived is that there exist a dative N-H bond and a dative P-H bond.
The lone pair of electrons on nitrogen and phosphorus contribute to the formation of the dative bond.
From this presentation, the phosphorus shows positive charge because sharing the electrons to the
hydrogen as well as its lower electronegativity compared to carbon and nitrogen. In addition, the
hydrogen atoms are carrying the positive charge from the calculation in Gaussian.
Correct NBO charges calculated and nice use of a uniform colour distribution across both ILs. You've made a good attempt of using the relative electronegativities to analyse the charges. However, in places, it isn't very clear and there are mistakes (e.g. carbon doesn't pull electrons on H and P making itself more positive? The P is also not positive because of electron sharing to the hydrogen).
To improve, you needed to clearly analyse the charges and then discuss the question of how the +1 formal charge arises in the N, for which you should consider formal electron counting. Smf115 (talk) 19:20, 4 June 2019 (BST)
A good report overall and nice structure information throughout with the method and basis set presented for each calculation. Smf115 (talk) 19:25, 4 June 2019 (BST)

