Rep:Mod:JennySamphire
The aims of this computational course is to learn how to use Gaussview software and to write a wiki page as well as initially investigating molecular structures, vibrational modes and bonding in optimised molecules and then examining ionic liquids and functionlised ionic liquids in a second week project.
EX3 section
BH3 optimisation
Initially, to get accustomed with the software, I ran a simple optimisation on a BH3 molecule. The bong lengths were set to; 1.55 Å, 1.53 Å and 1.54 Å. The method was set to B3LYP and the basis set was 3-21G. Using solutions to the Schrodinger equation, the SCF part of the calculation finds the energy of the electronic density. Then, by periodically moving the nuclei in the OPT part of the calculation and recalculating the SCF for each position the optimised geometry with the lowest energy can be obtained.
| Summary Data | Convergence | Jmol | |||
|---|---|---|---|---|---|
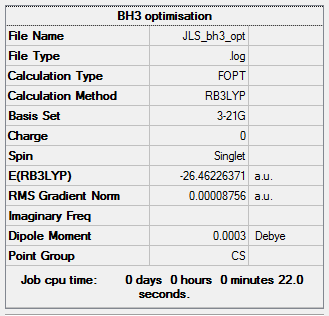 |
 |
|
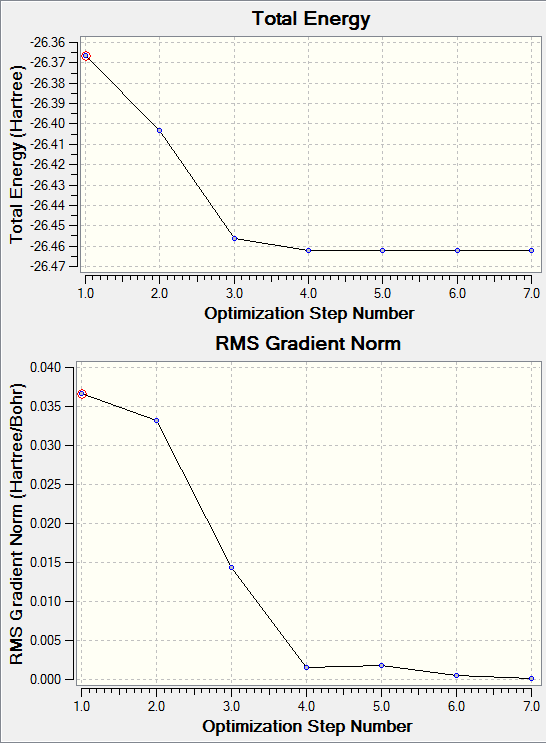
The two graphs calculated by Gaussview show information about the energy of optimisation. The first shows the total energy curve, showing the changes in energy over the optimisation steps, following the curve down until it is at the optimised geometries with the minimum energy. This is the stable state equilibrium position. The graph moves along the potential energy surface for the molecule until reaching the lowest energy geometry.
The second graph is the Root Mean Square gradient of the total energy. The gradient represents the force from nuclear-nuclear repulsion or nuclear-electron attraction which changes the positions of the nuclei. When at the energy minima the gradient will reach zero as no geometry change will lower the energy so there will be no force on the molecule. The graph reaches zero when at the least optimisation step showing the energy minima is reached.
The log file can be found here
Basis set: 6-31G(d,p)
Basis sets are determinants of how precise the optimisation is, with basis sets with a higher number of functions allowing higher precision but calculations take a longer amount of time.
For the previous calculation a relatively small basis set, 3-21G, was use to optimise BH3. However, now a higher level basis set, 6-31G(d,p), will be used to get a more accurate calculation.
| Summary Data | Convergence | Jmol | |||
|---|---|---|---|---|---|
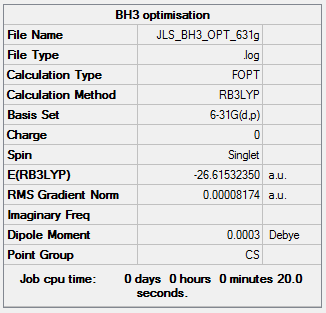 |
 |
|
The log file can be found here
Pseudo Potentials
Pseudo potentials are used for molecules containing heavier atoms when the calculations become to lengthy due to the large number of electrons. This means an simpler approximation is used for core electrons than the valence electrons as these are those most involved in bonding.
GaBr3
The symmetry was set at D3h and a medium basis set was used, LanL2DZ. This uses a separate basis set for the first row atoms and heavier elements.
| Summary Data | Convergence | Jmol | |||
|---|---|---|---|---|---|
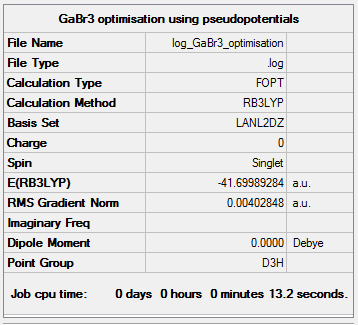 |
 |
|
The optimsation log file can be found here DOI:10042/143675
BBr3
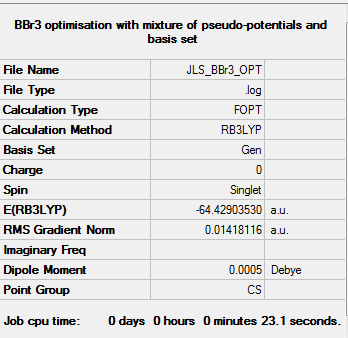
For BBr3 a mixture of pseudo-potentials and basis sets was used. For the lighter boron atom a basis set 6-31G(d,p) was used and for the heavier bromine atoms a pseudo-potential LanL2DZ is used. This is achieved by using basis set GEN in GaussView which allows the assigning of basis sets manually. The results are given below:
| Summary Data | Convergence | Jmol | |||
|---|---|---|---|---|---|
 |
 |
|
The symmetry should be C3v. The optimsation log file can be found here DOI:10042/143682
Structural Comparison [BH3, GaBr3, BBr3 ]
From the above three optimisations, the following data was found regarding bond length and bond angle:
| BH3 | GaBr3 | BBr3 | ||
|---|---|---|---|---|
| r(E-X) [Å] | 1.19 | 2.35 | 2.02 | |
| θ(X-E-X) | 120.0 | 120.0 | 120.0 |
Ligands: From the values comparing BH3 and BBr3 it can be seen that changing the ligand does not effect the bond angle but does affect the bond length. Bromine and hydrogen are similar in that they both monovalent and so bonding to boron completes the outer orbital of electrons. It was found that the B-H bond is relatively much smaller than the B-Br bond, indicating that it is a much stronger bond. This is likely due to the difference in energies between the orbitals. Boron and Hydrogen are both small atoms, so compared to the larger bromine, the hydrogens core orbital can get much closer to the boron. Also, the valence electron on hydrogen sits in a 1s orbital means it is denser and so forms a stronger bond compared to the valence electrons in bromine which sit in more diffuse p orbitals. Also, hydrogen 1s orbitals will sit much closer in energy to bromine valence p orbitals leading to stronger bonding.
Central Element: Again, changing the central atom has no observed effect on the bond angles but does affect the bong length. Gallium and boron are both in group 13 so have 3 electrons in their valence p orbital. This leads to them both forming trigonal planar complexes. Gallium, as further down the group has a larger atomic radius and so has larger more diffuse outer orbitals, as there is also a set of d orbitals between the valence and the nucleus. This leads to the gallium having longer and therefore weaker bonds.
Bonding: A classical view of a covalent bond is that a pair of electrons is shared between two atoms due to an electrostatic attraction between electrons and protons. Double and triple bonds are the sharing of a two or three electron pairs respectively. Ionic bonds are held together by electrostatic forces as opposing charges are formed from exchange of electrons to complete electron 'shells'. However, this is a very simple outlook on bonding and there is actually a wide continuum of bonding, which can be examined more with molecular orbital theory. This enables the bond order of the molecule to be worked out, which is a parameter which assess the two atoms molecular orbitals and how many bonds are formed between. [1] Many bonds are not simply ionic or covalent and can be on the spectrum between the two. Also, there are weaker, partial bonds such as hydrogen bonds and van der waals forces. These are due to the polarisation of electron density and consequential small attractive interactions between the slight charges caused by the difference in electron density. A strong bond is formed from good overlap of interacting orbitals. Also, a large difference in electronegativity can form strong ionic bonds, especially those at the top of the periodic table where the nucleus has greater effect on the electrons as there is less shielding.
An example of a strong, covalent bond is that between N2, this has high bond order as it is a triple bond and because it is a homonuclear bond, energy levels are the same increasing orbital overlap of orbitals that are dense so form a very strong bond at 948.1 kcal/mol. [2] This is comparison to the comparitvely very weak homonuclear bond between the large diffuse orbitals of Cs2 which is 43.5 kJ/mol [2] which is a weak bond. A medium bond is the C-H bond in methane which is 432.9 kJ/mol [3]
For some structures in gaussview there are no bonds joining molecules where we would expect them, for example with the intial calculations on BH3. This is due to the bond distance being longer than the one gaussview has assigned for those atoms and so does not necessarily mean there is no bonding. There could still be bonding character where orbitals are overlapping.
BH3 with no apparent bonds |
Frequency Analysis
BH3
Deriving the second derivative of the potential energy allows energy minima to be determined as if it is a positive value for a stationary point it indicates that this is a minimum as it gives the curvature of the potential energy curve. This frequency analysis allows the stationary points to be resolved into minimum, if all positive, stationary point and if one is negative then it is a stationary point. It also allows computation of the different vibrational modes of the molecule, 3N-6 if non-linear, which as well as being visualised can also be compared with the IR spectrum of experiment.
This analysis was performed on the 6-31G(d,p) optimised BH3 molecule but with symmetry set at D3h.
| Summary Data | Low frequencies |
|---|---|
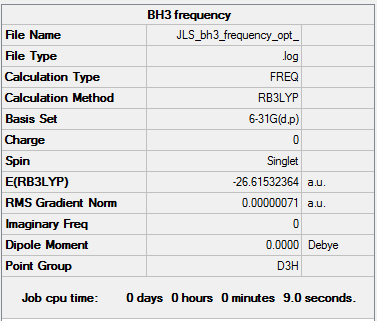 |
The log file can be found here
| Vibration (cm-1) | Intensity | Active | Type |
|---|---|---|---|
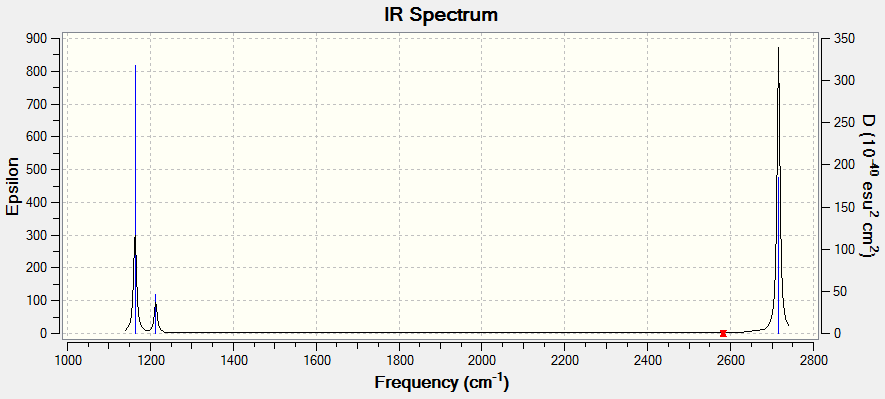
| 1163 | 93 | Yes | bend |
| 1213 | 14 | Slight | bend |
| 1213 | 14 | Slight | bend |
| 2583 | 0 | No | Stretch |
| 2716 | 126 | Yes | Stretch |
| 2716 | 126 | Yes | Stretch |
The predicted IR spectrum shows fewer peaks, 3, to number of vibrations found, 6. This is due to degeneracy of the peaks meaning they overlay on the spectrum and also for one of the vibrations there is no change in dipole therefore will not be IR active. The spectrum shows clearly 2 large peaks which corresponds to the strong active vibrations 1163 and 2716 cm-1. Then also there is a weaker signal at 1213cm-1 to the degenerate peak which has relatively small intensity, due to a smaller change in dipole.
GaBr3
Frequency analysis was also run on GaBr3 with basis set LANL2DZ and B3LYP method used. The frequency data is shown below:
| Summary Data | Low frequencies |
|---|---|
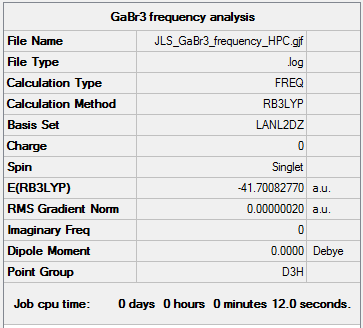 |
The frequency log file can be found here DOI:10042/149182
| Vibration (cm-1) | Intensity | Active | Type |
|---|---|---|---|
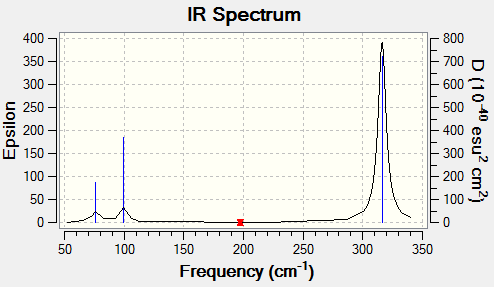
| 76 | 3 | Slight | bend |
| 76 | 3 | Slight | bend |
| 100 | 9 | Slight | bend |
| 197 | 0 | No | Stretch |
| 316 | 57 | Yes | Stretch |
| 316 | 57 | Yes | Stretch |
Vibrational comparison between GaBr3 and BH3
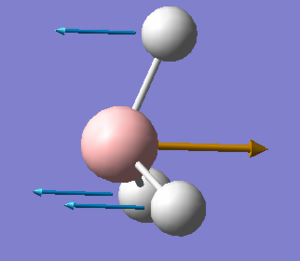
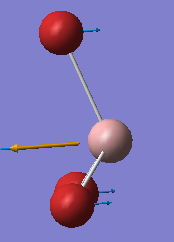
Vibrational frequency is dependent on the mass and force constant, which reflects the strength of the bond. ν = (1/2π)(k/μ)1/2 where k is the force constant and μ is the reduced mass. This shows that the heavier the atoms the lower the frequency as the frequency is inversely proportional to the square of the reduced mass. Also, the stronger the bond, the the larger the force constant, which frequency is proportional to the square of.
Both GaBr3 and BH3 have six vibrational modes due to equation 3N-6 where N is 4. The infrared spectrum of GaBr3 is in the range of lower frequencies than BH3 due to heavier mass of the atoms and so a larger reduced mass. This consequently means lower vibrational frequency. For GaBr3 the energy of the vibrational modes is reordered. For example, the A2" umbrella motion. For BH3 is the lowest frequency and for GaBr3 it is the highest bending frequency, this difference is due to the difference in the mass of the atoms in the different molecules. As can be seen on the images, the displacement vectors are smaller than the for GaBr3 bromine atoms than for BH3 hydrogen atoms. This is due to the difference in mass, as bromine is heavier than the central atom, so the motion is more in the central gallium atom than in bromine whereas for BH3, the hyrdogens are much lighter and so move more easily than the boron. This difference in the nature of the vibration can be seen on the gaussview animation. Then considerable difference to hydrogen in mass for the gallium is why it is a higher in the vibration order as more energy is needed for it to move.
Review of Frequency Analysis
The same method for optimisation and frequency must be used as because the optimised structure is highly dependent on the type of basis set and method used so will not be same structure the frequency is being calculated for as previous optimisation. The purpose of the frequency analysis is too confirm the optimised structure found is at the energy minimum as the structure is just optimised to a stationary point. By using the second derivative of this energy profile the vibrational analysis confirms that this stationary point is in fact a minima. The 'low frequencies' correspond to the motions of the center of mass of the molecule being observed. Ideally they should be zero, and get smaller with the better method used as the center of mass is moving less.
Calculating Molecular Orbitals
Using the 6-31G(d,p) optimised BH3 molecule the molecule orbitals were calculated and can be found here: DOI:10042/146859
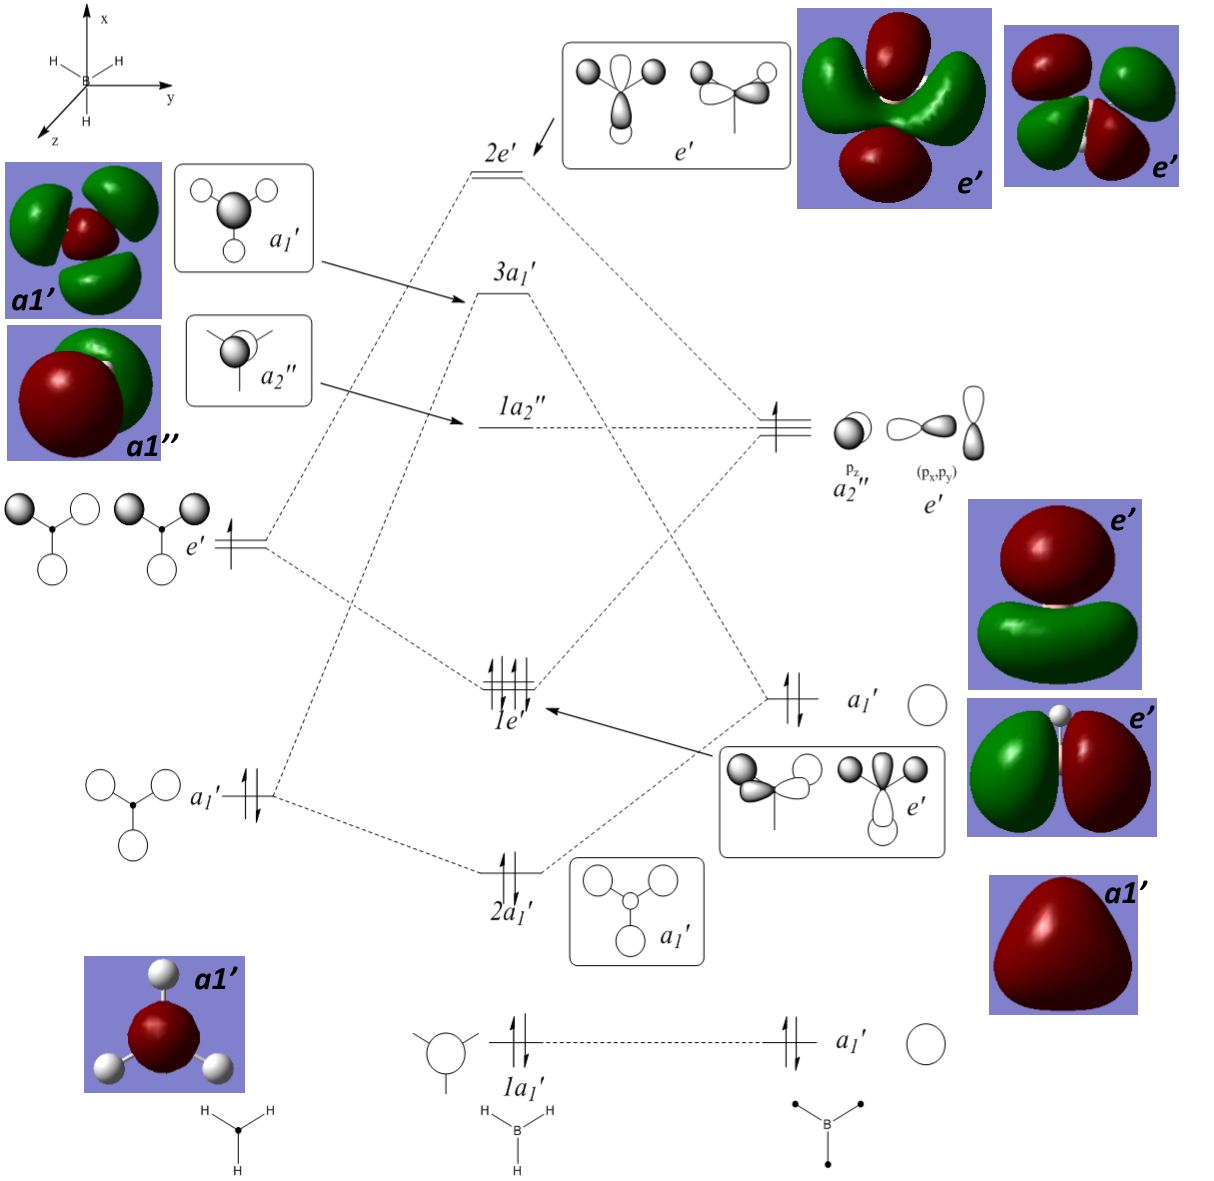
Comparing the predicted orbitals in the molecular orbital diagram with that calculated there is reasonable agreement. The small constricted nature of the 1s orbital can be seen in both, the more diffuse nature of the higher energy orbitals is only really seen in the calculated orbitals opposed those from the MO diagram. Also, some of the contributions from specific orbitals to certain molecular orbitals are not in agreement, for example in 3a1' the computed contribution of the 2s orbital is smaller than that predicted. However, for a qualitative method the MO diagram is reasonably accurate and therefore useful to predict orbitals in smaller simpler molecules without computational methods.
NH3
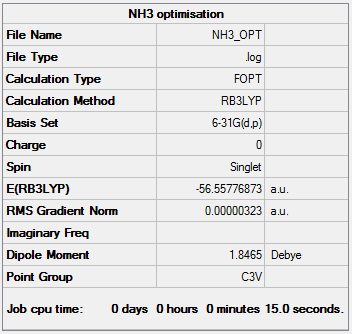
Optimisation Using basis set 6-31G(d,p), NH3 was optimised. The bond angle between the N-H bonds was found to be 106° and the bond length was found to be 1.02 Å.
| Summary Data | Convergence | Jmol | |||
|---|---|---|---|---|---|
 |
 |
|
The log file can be found here
Frequency analysis Using the optimised molecule and setting the point group to C3v a frequency analysis was run as before, with basis set 6-31G(d,p) and the B3LYP method, to confirm the energy minima.
| Summary Data | Low frequencies |
|---|---|
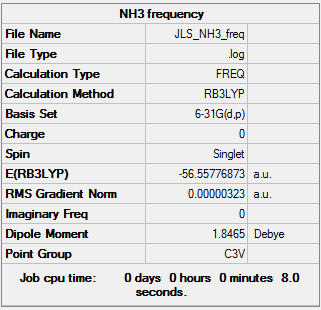 |
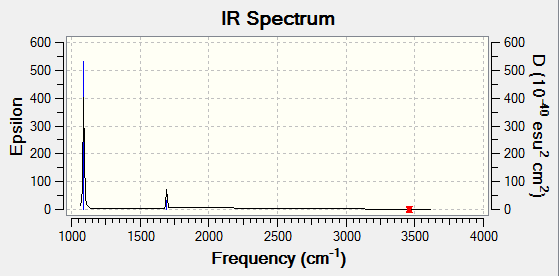
It can be seen that the the frequencies are low and that there is no negative frequencies showing the energy minima has been found.
| Vibration (cm-1) | Intensity | Active | Type |
|---|---|---|---|
| 1089 | 145 | Yes | bend |
| 1694 | 14 | Yes | bend |
| 1694 | 14 | Yes | bend |
| 3461 | 1 | Slight | Stretch |
| 3590 | 0 | No | Stretch |
| 3590 | 0 | No | Stretch |
The log file can be found here
MO and NBO
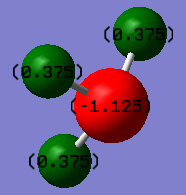
The molecular orbitals were computed again using 6-31G(d,p) basis set and the B3LYP method with set C3v symmetry. The log file can be found here: DOI:10042/147006 .
The charge distribution is shown, with nitrogen possessing a negative charge of -1.125 and the hydrogen's with 0.375 each.
Association Energies
Ammonia-Borane
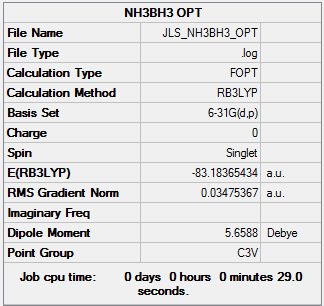
Ammonia-borane is a Lewis acid-base complex where by definition the nitrogen is donating a pair of electrons to the boron however the nature of this bond is not so straight forward and can be investigated by examining association energies. The energies of the reactants and products are needed to calculate reaction energy which will give the energy for the dative bond between nitrogen and hydrogen. NH3 and BH3 have already been calculated and so NH3BH3 was optimisation was run.
| Summary Data | Convergence | Jmol | |||
|---|---|---|---|---|---|
 |
 |
|
The log file can be found here
Frequency analysis was then also performed on NH3BH3
| Summary Data | Low frequencies |
|---|---|
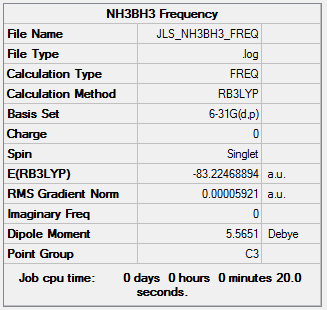 |
The log file for the frequency analysis can be found here
The energies calculated for the reagents and products were found to be:
| NH3 | BH3 | NH3BH3 | |
|---|---|---|---|
| Energies (a.u) | -56.5577687 | -26.6153235 | -83.2246889 |
The dissociation energy is given by ΔE=E(NH3BH3)-[E(NH3)+E(BH3)]. So ΔE= -0.0515967 a.u ΔE= -135.44 KJ/mol This is a relatively weak bond as in much smaller than the medium bond of C-H of 432.9 kJ/mol [3], this is likely due to the nature of the dative covalent bond not being as strong as a fully covalent bond. However it is not a weak as that between Cs2 which is 43.5 kJ/mol [2].
Ionic Liquids: Designer Solvents
Green chemistry is a large growing field in chemistry and has led to the development of replacements for traditional solvents which are flammable and volatile leading to unwanted wastage. Ionic liquids have good solvating properties and are recyclable and non-volatile/non-flammable so are good potential replacements for usual solvents. [4]
Their composition is that of room temperature liquid ions which is achievable through bulky groups so the ions cannot pack together well generating the property of low melting points. This property can be fine tuned by the use of smaller anions and increasing the bulkiness and unsymmetrical nature of the cation, leading to a decrease in melting point. [4]
This shows that the chemical composition and nature of these ions affect the properties of these solvents and therefore their use in synthesis thus using computational techniques different ionic liquids cations will be investigated at the molecular level. The difference in central atom will be explored and also considered is the affect of additional functional groups, compareing electron withdrawing groups with electron donating.
Onium Cations
[N(CH3)4]+
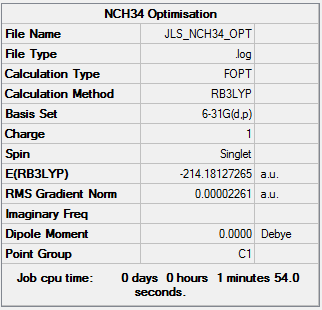
The cation was optimised using 6-31G(d,p) basis set and the B3LYP method. The symmetry was not constrained as this would increase computing time and may lend it to error.
| Summary Data | Convergence | Jmol | |||
|---|---|---|---|---|---|
 |
 |
|
The log file can be found here
It was found that the optimised bond lengths were: N-C [1.51 Å], C-H [1.09 Å] and the bond angles around nitrogen was 109.5 ° but for the carbon there was less perfect sp3 hybridization as the angles between the hydrogens, 110.1 °, were larger than between the nitrogen and hydrogens, 108.9 °. This could be due to the high electronegativity of the nitrogen central atom meaning a larger build up of electron density in the centre so hydrogens repulsed more away the nitrogen centre.
Frequency analysis was also ran with 6-31G(d,p) basis set and the B3LYP method to confirm the minimum energy point found. The low frequencies are checked at +/-15 cm-1.
| Summary Data | Low frequencies |
|---|---|
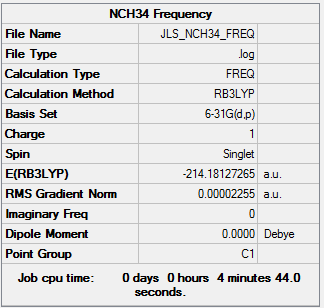 |
The log file can be found here
Molecular orbital analysis was also run and the log file for the molecular optimisation calculations can be found here. The molecular orbitals are analysed more below as well as the charge distribution in the molecule.
[P(CH3)4]+
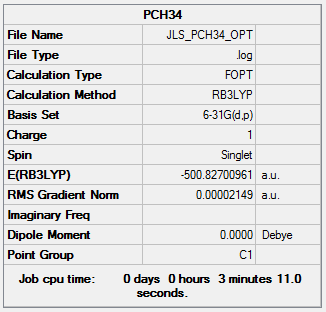
[P(CH3)4]+ was optimised using 6-31G(d,p) basis set and the B3LYP method.
| Summary Data | Convergence | Jmol | |||
|---|---|---|---|---|---|
 |
 |
|
The log file can be found here
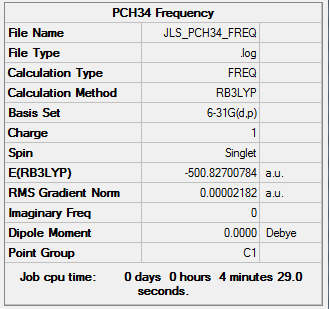
Analysis of the bond angles shows that the around the carbon, the angle between hydrogen and nitrogen is 109.9 ° compared to angle between the hydrogens at 109.0 °. The angle around the nitrogen is 109.5 °. The P-C bond is 1.82 Å and the C-H bond is 1.09 Å. This data shows that the molecule is nearly perfectly sp3 hybridised as all angles are very close to 109 °. The lack of slight distortion found in [N(CH3)4]+ is likely due to the difference in elctronegativities in the two central atoms.
Again vibrational analysis was run on the cation with 6-31G(d,p) basis set and the B3LYP method to confirm minima.
| Summary Data | Low frequencies |
|---|---|
 |
The log file can be found here
The log file for the molecular optimisation calculations can be found here and the charge distributions are discussed and compared below aswell as the nbo population for the C-P being analysed.
[S(CH3)3]+
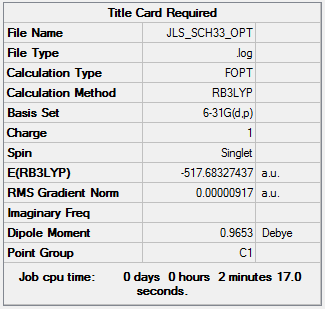
[S(CH3)3]+ was optimised using 6-31G(d,p) basis set and the B3LYP method.
| Summary Data | Convergence | Jmol | |||
|---|---|---|---|---|---|
 |
 |
|
The log file can be found here
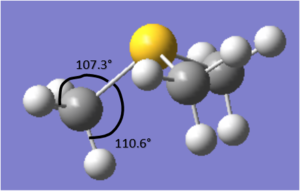
The structure of the molecule is not planar, due to the lone pair situated on the sulphur. This means the angle between the carbons is 102.8 °. The angle between the hydrogen and sulphur is 107.3 ° for the hydrogens pointing 'up' and 110.6 for those pointing 'down'. This difference in angles is due to the different environments the hydrogens are in due to the unsymmetrical nature of the molecule. However, the both C-H bond lengths are 1.09 Å and the S-C length is 1.82 Å.
Frequency analysis was run on the molecule with a B-31G(d,p) basis set and the B3LYP method to confirm the energy minimum.
| Summary Data | Low frequencies |
|---|---|
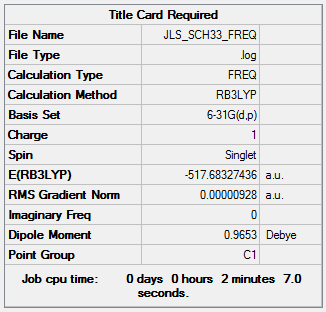 |
The log file can be found here
The log file for the molecular optimisation calculations can be found here and the charge distribution and nbo population in analysed below.
Geometries comparison
The bond lengths and the bond angles of the above cations were taken from their optimised structure and compared in the table below.
| Molecule | X-C length (Å) | C-H length (Å) | C-X-C angle (°) | X-C-H angle (°) | H-C-H angle (°) |
|---|---|---|---|---|---|
| [N(CH3)4]+ | 1.51 | 1.09 | 109.5 | 108.9 | 110.1 |
| [P(CH3)4]+ | 1.82 | 1.09 | 109.5 | 109.9 | 109.0 |
| [S(CH3)3]+ | 1.82 | 1.09 | 102.8 | 110.6/107.3 | 111.1/109.4 |
It can be seen that the bond length between N-C is significantly smaller than the P-C or S-C showing that is a stronger bond. This is due to the higher electronegativity of nitrogen and lower outer p orbitals that are at similar energy to carbon so have very good overlap leading to stronger interaction. Phosphorus and sulphur are of similar energy in comparison so form similarly strong bonds with the carbon. It can be seen that changing the central atom does not affect the length of the C-H bonds as they are the same in all three molecules. Both the nitrogen and sulphur molecules have the same angles of the methyl groups round the central atom, showing perfect sp3 hybridisation. However, it can be seen that the sulphur has a much smaller angle than 109 ° which can probably be attributed to the lone pair on the central atom which is more repulsive than the methyl groups, therefore distorting the geometry.
MO and NBO analysis of [N(CH3)4]+
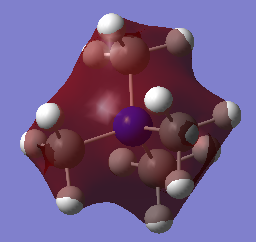
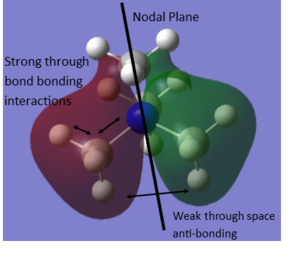
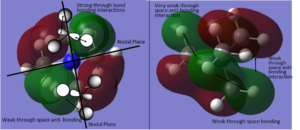
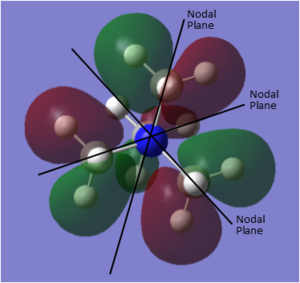
Using five different molecular orbitals found from calculations on the electronic structure of [N(CH3)4]+ to get a better picture of the different levels of bonding. Core electrons are not considered as they are so low in energy they are not involved in bonding. Bonding interaction are produced from in-phase overlap and anti-bonding from out-of-phase overlap. Boundaries between phase changes are defined as nodes and indicate anti-bonding character. Due to the smaller directionality and more diffuse nature pi interactions are weaker than sigma type.
Charge Distribution Comparison
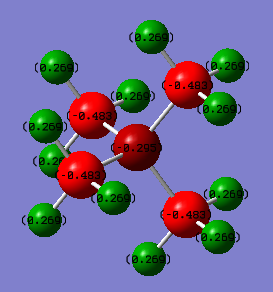
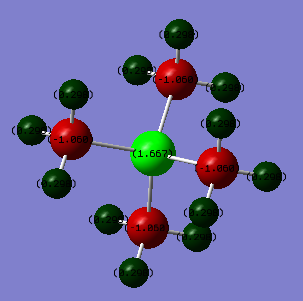
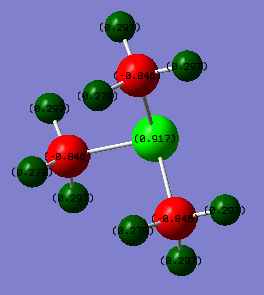
From the natural bond orbital analysis of the cations the distribution of charge across the molecules could be calculated over the molecule. The differing central atom can be seen, by the tables below, to greatly effect the way that charge is disbursed across the molecule.
| [N(CH3)4]+ | [P(CH3)4]+ | [S(CH3)3]+ |
|---|---|---|
 |
 |
|
| Atom | [N(CH3)4]+ | [P(CH3)4]+ | [S(CH3)3]+ |
|---|---|---|---|
| Central[N/P/S] | -0.295 | 1.667 | 0.917 |
| C | -0.483 | -1.060 | -0.846 |
| H | 0.269 | 0.298 | 0.297/0.279 |
All three molecules hold a positive charge which is usually placed at the central atom. However, the central atoms differs in charge from -0.342 on the nitrogen to 1.667 on the phosphorus. This difference is due to the difference in electronegativity of the central atom. . Nitrogen has a the highest electronegativity at 3.04[1] this is compared to carbon which has a Pauling electronegativity of 2.55[1]. This means that in comparison to phosphorus and sulphur the nitrogen has lower energy atomic orbitals, closer in energy to the carbons allowing efficient overlap for the positive charge to be distributed farthest away from the electronegative nitrogen and which can be seen as all positive charge is situated on the hydrogens. Also carbons are significantly smaller negative charge than the other two cations due to the spreading of the positive charge and the electronegative pull of the nitrogen drawing electron density towards it in the bond.
In comparison, the phosphorus is a row down from nitrogen so is less electronegative, 2.19[1], and has larger, more diffuse orbitals. This leads to poorer orbital overlap with the carbon so does not show the spread of charge that can be seen in [N(CH3)4]+. This means that the central atom now holds onto the positive charge. Also, due to carbon being more electronegative and the lack of overlap and more electrons in the system means that the carbon is much more negatively charged than on the other two molecules. Sulphur is more electronegative, 2.58[1], than phosphorus so atomic orbitals will be lower in energy than and will be able to overlap more than phosphorus hence the positive charge on the central atom is smaller as the charge is able to distribute more, hence making the charge on the carbon less negative. Also, the sulphur has one less substituent which means that the charge on the hydrogens is not evenly distributed as those hydrogens facing 'up' are more positive than those facing towards other hydrogens, this could be due to a build up of electron density between the hydrogens.
[NR4]+
In the traditional characterisation of [NR4]<suop>+ cations the charge is placed on the central nitrogen. This formal assignment is made as the nitrogen is the atom with the higher number of substituents and in basic valence bond theory would be the atom lacking one electron so would be positively charged. However, as can be seen from the charge distribution this is clearly not the case and the positive charge is actually distributed across the hydrogens. This shows that the formal description is not valid for the [N(CH3)4]<suop>+ molecule. However, it is more true for the the phosphorus and sulphur cations as these have more of a positive charge on the central atom.
Relative contributions of C-X
In comparison between the C-X bonds of the molecule the NBO analysis can be evaluated from the MO calculations run on the three different molecules. The nitrogen contributes 66% to the bond whereas phosphorus contributes 40% and sulphur contributes 51%. This correlates to the different electronegativities of the 3 atoms which are stated above. The higher the electronegativity the more the larger the pull on electrons in the bond and so the higher the contribution. These relative contributions can also be seen in the charge distributions discussed above as it is seen that nitrogen has the highest percentage contribution and so has a higher amount of electron density on its centre and therefore has the more negative charge. And phosphorus which has the lowest contribution also has the most positive charge situated on it.
The NBO analysis also confirms that the central atom is sp3 hybridised as there is about a 25% contribution from s orbital and 75% from p orbital. This is in the 1:3 ratio as expected in sp3 hybridised orbitals. However, as discussed in the geometry analysis the sulphur molecule is not perfect sp3 hybridised and this is reflected in the s and p contributions as the s contribution is 20% and p is 80%, meaning that there is less s character to the bond than would be expected.
Influence of functional groups
Additional functional groups will affect the chemical properties of the solvent as due to their electron withdrawing or donating properties can change charge distribtuion and therefore energy levels in the molecule.
[N(CH3)3(CH2OH)]+
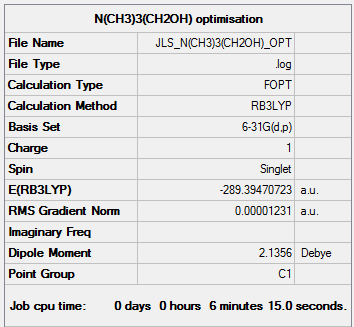
[N(CH3)3(CH2OH)]+ was optimised using the B3LYP method and using the basis set 6-31G(d,p).
| Summary Data | Convergence | Jmol | |||
|---|---|---|---|---|---|
 |
 |
|
The log file can be found here
A vibrational analysis was also performed using the B3LYP method and using the basis set 6-31G(d,p) to confirm the stationary point found in the optimsiation is in fact a minima.
| Summary Data | Low frequencies |
|---|---|
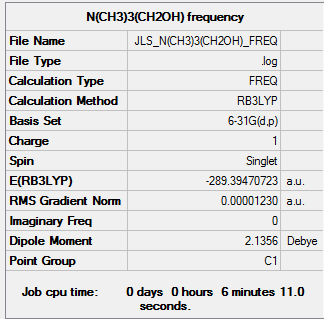 |
The log file can be found here
The log file for the molecular optimisation calculations can be found here and the charge distribution and MOs are discussed below.
[N(CH3)3(CH2CN)]+
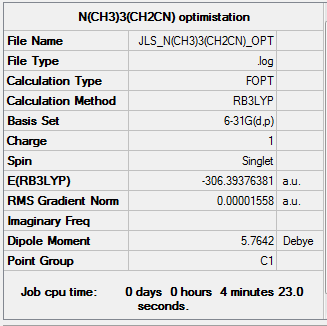
[N(CH3)3(CH2OH)]+ was optimised using the B3LYP method and using the basis set 6-31G(d,p).
| Summary Data | Convergence | Jmol | |||
|---|---|---|---|---|---|
 |
 |
|
A frequency analysis was run using B3LYP method and using the basis set 6-31G(d,p) to confirm the energy minimum was found.
The log file can be found here
| Summary Data | Low frequencies |
|---|---|
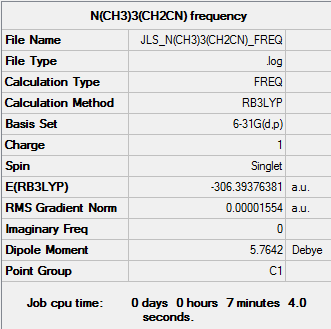 |
The log file can be found here
The log file for the molecular optimisation calculations can be found here and the charge distribution and MOs are discussed below.
Charge distribution analysis
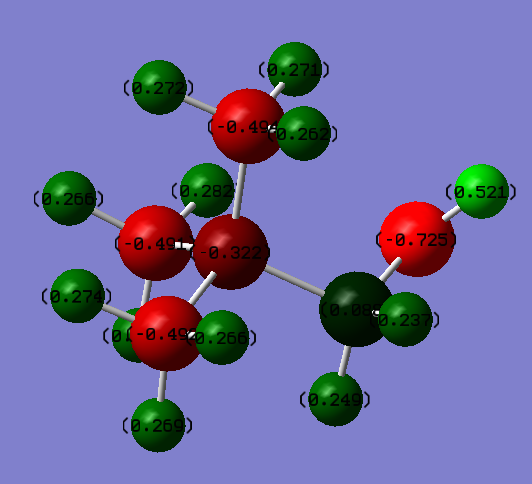
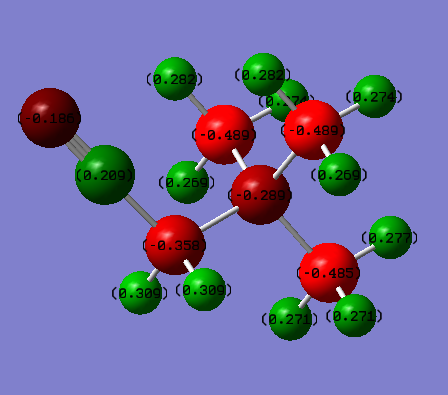
Using the molecular orbital calculation the charge distributions of the two optimised cations could be analysed. The table below shows the distribution of charge in both molecules;
 |
|
|---|
The difference between in charge distribution can be explained by the nature of the attached functional group. The lone pairs on the oxygen in the OH group can be donated, this would explain why the central nitrogen has a more negative charge than in N(CH3)3(CH2CN)+. The attached carbon however is more positive which is due to oxygen being much higher in electronegativity than carbon so polarising the bond. The cyanide group however is electron withdrawing hence the carbon it attached to being less negatively charged than the other methyl groups. Also, it can be seen that more of the negative charge sits on the nitrogen in the functional group. Also, the nitrogen is slightly less negative than in N(CH3)4+ but not significantly so.
HOMO LUMO comparison
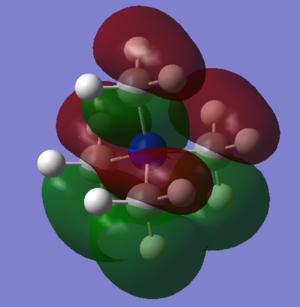
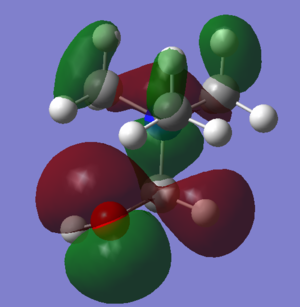
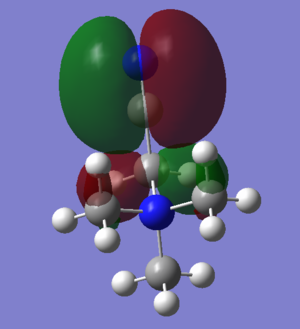
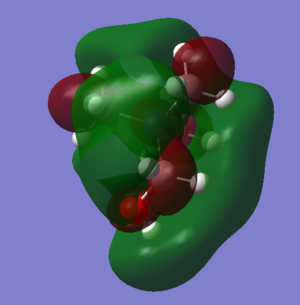
Also from the molecular orbital calculations the highest occupied orbitals (HOMOs) and lowest unoccupied molecular orbitals (LUMOs) can be analysed. Below is a table of the three different cations
| N(CH3)4+ | [N(CH3)3(CH2OH)]+ | [N(CH3)3(CH2CN)]+ |
|---|---|---|
| HOMO | ||
 |
 |
 |
| LUMO | ||
 |
 |
 |
It can be seen that the shape of the HOMO and LUMO orbitals has changed across the three different molecules, most dramatically between the HOMO orbitals. It can be seen that for the molecules with functional groups the HOMO orbitals are centred around these groups, this can be especially seen in [N(CH3)3(CH2CN)]+ whereas for N(CH3)4+ it is spread across the molecule and is more diffuse. The shape of the LUMO between N(CH3)4+ and [N(CH3)3(CH2OH)]+ changes less, but with more spreading along the OH bond. Again for N(CH3)4+ the LUMO is now more focused on the functional group but still is spread over the entire molecule.
Comparison of energies is important in discerning the chemical impact of the differences in the HOMO/LUMOs.
| HOMO Energies (a.u) | ||
|---|---|---|
| N(CH3)4+ | [N(CH3)3(CH2OH)]+ | [N(CH3)3(CH2CN)]+ |
| -0.57932 | -0.48762 | -0.50048 |
| LUMO Energies (a.u) | ||
| -0.13304 | -0.12460 | -0.18181 |
| HOMO-LUMO gap (kJ/mol) | ||
| 1171 | 953 | 837 |
Compared to N(CH3)4+ the energy of the HOMO has increased for both functional group molecules and for [N(CH3)3(CH2OH)]+ the LUMO has also increased as the addition of an electron donating group has added more electron density to the molecule therefore destabilising it. In contrast, the electron withdrawing group CN decreases the energy of the molecule showing the stabilising effect. This means that it can now more readily accept electrons so would be better oxidant or lewis acid.
The HOMO-LUMO energy gap in N(CH3)4+ is the largest and so means this is likely the most stable and less likely to donate electrons. The addition of the two functional groups decreases the gap meaning they are more likely to promote an electron from the HOMO to the LUMO creating an excited state molecule.
Stability is important in solvents as they should not participate in the reaction they are solvating so unreactivity in important.This shows that N(CH3)4+ would be useful as the large HOMO-LUMO gap indicates a higher stability. However, the use of functionalised is being developed to allow a dual functionality as not only a solvent but also participation in reactions for example as acid in acid catalysis. [5] This means that in comparison, [N(CH3)3(CH2CN)]+ will be at acid catalysis as having a lower LUMO is better at accepting electrons and therefore a better lewis acid than [N(CH3)3(CH2OH)]+. Also, the functionalised cations may have lower melting points as they are more unsymmetrical and larger however, their possession of polarised bonds could mean that they form stronger dipole induced intramolecular bonds.
Conclusion
The objectives of this computational project have been achieved with skills developed in software to optimise and then analyse molecules successfully. In the first week molecules were optimised using different basis set and using pseudo potentials. Also, using vibrational analysis, vibrational modes were shown and evaluated with corresponding predicted IR spectra explained. Molecular orbitals were also computed of NH3 and compared to those predicted with an MO diagram. Finally, the bond dissociation enthalpies were calculated for ammonia borane using already analysed fragments and optimisation of the molecule.
The mini-project for week two was an investigation into ionic liquids. First, using the same basis set and method both N(CH3)4+, P(CH3)4+ and S(CH3)3+ were optimised which was confirmed with frequency analysis. Geometries of the three cations could be compared, with sulphur shown to be the most distorted from perfect sp3 hybridisation. From molecular orbital analysis, the MOs could for N(CH3)4+ were investigated showing that they became more diffuse and possessed higher anti-bonding character as they got higher in energy. Charge distribution could also be analsyed which was shown to be highly influenced by the difference in electronegativities in the the central atoms and the difference in energy in their atomic orbitals, with nitrogen being the most electronegative and so the only one not possessing the positive charge. The addition of a functional group to the cation was also analysed by looking at [N(CH3)3(CH2OH)]+ and [N(CH3)3(CH2CN)]+. These were optimised and then their charge distribution and HOMO/LUMO gap was compared, showing that the addtion of functional groups allow the dual use of ionic liquids as solvents and also catalysts. If time had permitted, ionic liquid systems would have been more closely evaluated as well as their potential uses in industry.
References
- ↑ 1.0 1.1 1.2 1.3 1.4 C. Housecroft, A. Sharpe, Inorganic Chemistry,2012, Pearson, 4 ed, 50 & 30.
- ↑ 2.0 2.1 2.2 T. Ghanty and S. Ghosh, J. Phys. Chem., 1991, 6512–6514.
- ↑ 3.0 3.1 G. K. Jarvis, K.-M. Weitzel, M. Malow, T. Baer, Y. Song and C. Y. Ng, Phys. Chem. Chem. Phys., 1999, 1, 5259–5262.
- ↑ 4.0 4.1 S. Keskin, D. Kayrak-Talay, U. Akman and Ö. Hortaçsu, J. Supercrit. Fluids, 2007, 43, 150–180.
- ↑ 1 X. Li, D. Zhao, Z. Fei and L. Wang, Sci. China, Ser. B Chem., 2006, 49, 385–401.

