Rep:Mod:Janie92
Computational analysis of Borane
Optimisation of borane
The optimisation of chemical structures using gaussview involves the use of quantum chemistry to discover the most stable structure of a molecule. Optimisation is achieved by solving the schrodinger equation for the electron density and energy of a molecule at particular nuclear positions. By changing the nuclear positions of a molecule,its geometry is modified and the schrodinger equation is solved for different nuclear positions until a minimum energy is found. All calculations can be conducted and analysed on the gaussview program.
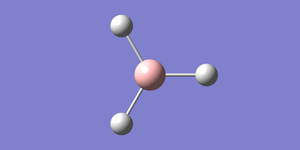
A small molecule such as borane,BH3 can be easily optimised using gaussview.To optimise borane, a borane molecule is initially created on guassview using the periodic table button on the control pallete. All bond lengths are fixed to 1.5 Angstroms(Å), In gaussian calculation setup, optimisation is selected as the job type and B3LYP as the method. Using a simple basis set such as 3-21G an optimised structure of borane can be quickly determined since 3-21G has low accuracy.Here is a link to the log file for an optimised borane moelcule with a 3-21G basis set.The table below provides a summary of the fundamental information that has been obtained from the calculation
| File Name | BH3_OPT |
| File Type | .log |
| Calculation Type | FOPT |
| Calculation Method | RB3LYP |
| Basis Set | 3-21G |
| E(RB3LYP) | -26.46226338 au |
| RMS Gradient Norm | 0.00020672 au |
| Dipole Moment | 0.00D |
| Point Group | D3H |
| Job cpu time | 39.0 seconds |
One method to check that the optisimation calculation is successful it to prove the submitted job has 'converged'. This means that small displacements in the nuclear postions results in no change in energy and hence an optimium structure has been found. The evidence for a converged job can found in the item table,located in the output file. An example of the item table is shown below. The item table also provides useful information about the optimised angle and bond length. Alternatively,the optimised angle and bond length can be determined using the bond tools on the gaussview program
The item table below highlights that the job has converged and gives an optimised B-H bond length and H-B-H angle of 1.19 Angstroms (Å) and 120.0 degrees (°) respectively.
Item table for BH<sub>3</sub> Optimisation using a 3-21G basis set


       Item               Value     Threshold  Converged?
 Maximum Force            0.000413     0.000450     YES
 RMS     Force            0.000271     0.000300     YES
 Maximum Displacement     0.001610     0.001800     YES
 RMS     Displacement     0.001054     0.001200     YES
 Predicted change in Energy=-1.071764D-06
 Optimization completed.
    -- Stationary point found.
                           ----------------------------


                           !   Optimized Parameters   !
                           ! (Angstroms and Degrees)  !
 --------------------------                            --------------------------
 ! Name  Definition              Value          Derivative Info.                !
 --------------------------------------------------------------------------------
 ! R1    R(1,2)                  1.1935         -DE/DX =0.0004              !
 ! R2    R(1,3)                  1.1935         -DE/DX =0.0004              !
 ! R3    R(1,4)                  1.1935         -DE/DX =0.0004              !
 ! A1    A(2,1,3)              120.0            -DE/DX =   0.0                 !
 ! A2    A(2,1,4)              120.0            -DE/DX =   0.0                 !
 ! A3    A(3,1,4)              120.0            -DE/DX =   0.0                 !
  D1    D(2,1,4,3)            180.0            -DE/DX =   0.0
 --------------------------------------------------------------------------------
Using a larger basis set such as 6-31G (d,p) will provide a more accurate optimisation calculation. The calculation may take longer to run on the gaussview program. Here is a link to the log file of optimised borane molecule with a 6-31G(d,p) basis set. The table below summarises the fundamental information obtained from the calculation
| File Name | BH3_OPT_631G_dp |
| File Type | .log |
| Calculation Type | FOPT |
| Calculation Method | RB3LYP |
| Basis Set | 6-31G(d,p) |
| E(RB3LYP) | -26.61532252 au |
| RMS Gradient Norm | 0.00021672 au |
| Dipole Moment | 0.00 Debye |
| Point Group | D3H |
| Job cpu time | 33 seconds |
The item table below shows that the optimisation calculation was successful, since the submitted job has converged. The optimised bond length and angle is shown to be 1.19Angstroms (Å) and 120.0 degrees when using a 6-31G basis set.
Item table for BH3 optimisation using a 6-31G basis set


       Item               Value     Threshold  Converged?
 Maximum Force            0.000433     0.000450     YES
 RMS     Force            0.000284     0.000300     YES
 Maximum Displacement     0.001702     0.001800     YES
 RMS     Displacement     0.001114     0.001200     YES
 Predicted change in Energy=-1.189019D-06
 Optimization completed.
    -- Stationary point found.
                           ----------------------------
                           !   Optimized Parameters   !
                           ! (Angstroms and Degrees)  !
 --------------------------                            --------------------------
 ! Name  Definition              Value          Derivative Info.                !
 --------------------------------------------------------------------------------
 ! R1    R(1,2)                  1.1914         -DE/DX =   0.0004              !
 ! R2    R(1,3)                  1.1914         -DE/DX =   0.0004              !
 ! R3    R(1,4)                  1.1914         -DE/DX =   0.0004              !
 ! A1    A(2,1,3)              120.0            -DE/DX =    0.0                 !
 ! A2    A(2,1,4)              120.0            -DE/DX =    0.0                 !
 ! A3    A(3,1,4)              120.0            -DE/DX =    0.0                 !
 ! D1    D(2,1,4,3)            180.0            -DE/DX =    0.0                 !
 --------------------------------------------------------------------------------
BH3 total energy summary
The total energy of a BH3 optimised molecule using a 3-21G basis set is found to be -26.462266338 au
which is equivalent to -69476.68Kjmol-1. The total energy of the 6-31G basis set is found to be -26.61532252 au which is equivalent to -69878.53Kjmol-1. Since different basis sets are used, it would invalid to compare the two energies.
Frequency analysis of Borane
Frequency and vibrational analysis is essential to provide evidence that a calculated optimised molecule is at an energy minimum and hence can be confirmed as a stable structure. During a frequency analysis, the same method and basis set used during optimisation is applied. This is because frequency analysis is based on an optimised molecule and so the same method and basis set must be applied otherwise the results would be invalid. Frequency analysis of borane is carried out on gaussview by initially opening the output log file of previously optimised borane. Then in gaussian calculation setup select frequency as the job type. It is also useful to add the phrase 'int=grid=ultrafine' in the additional keyword before submitting the job to gaussian.By adding this phrase this tightens the electron density and hence reduces the noise.Here is a link to the output log file for the frequency analysis of borane.The results below provides a summary of the calculated frequencies
| File Type | .log |
| Calculation Type | FREQ |
| Calculation Method | RB3LYP |
| Basis Set | 6-31G(d,p) |
| E(RB3LYP) | -26.61532252au |
| RMS Gradient Norm | 0.00021669 au |
| Dipole Moment | 0.00D |
| Point Group | D3H |
| Job cpu time | 20.0 seconds |
    item table for frequency analysis of borane

 Low frequencies ---   -7.0794   -7.0439   -0.0279    0.0007    0.7084    6.6303
 Low frequencies --- 1163.0023 1213.1577 1213.1579
All non-linear molecules have vibrational degrees of freedom of the form: 3N-6. The low frequencies shown above represent the -6 part of the 3N-6 term, which are simply motions of the centre of mass of the molecule. The six low frequencies should be as close to zero as possible (preferably in the range of +15 to -15 cm-1. If so, this gives evidence that the optimised molecule is at an energy minimum. The largest zero frequency is approximately 7cm-1 which is relatively much smaller than the first real frequency at 1163cm-1.The low frequencies range from -7 to +6 which falls within the suitable range of low frequencies.
The table below provides a useful summary of the vibrational motions, frequencies and intensities of borane.The real frequencies under each symmetry label are all positive, this gives evidence that the frequency analysis was carried out correctly in gaussview.
IR Spectrum of Borane
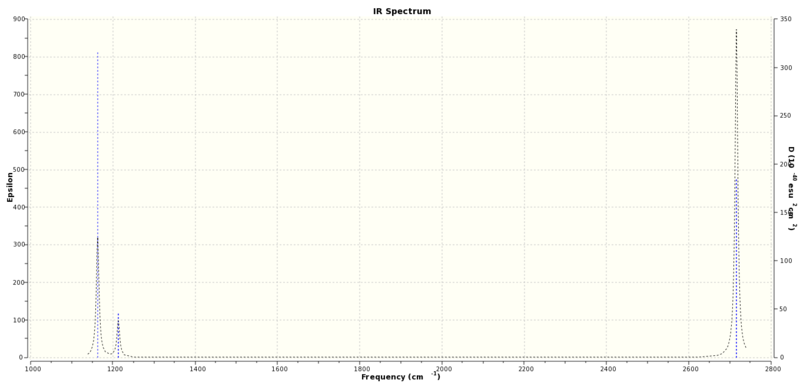
The summary table highlights there are 6 different vibrational motions of borane however, only 3 peaks are shown in the IR spectrum. Only three peaks are present since two sets of vibrational motions (with E' symmetry) have the same frequency at 2715cm-1 and 1213cm-1, hence only one peak for each frequency is present in the IR spectrum. Also the symmetrical vibrational motion at a frequency of 2582cm-1 has an intensity of zero.This is becauase this particular vibrational motion invloves no change in dipole and so is not present in the IR spectrum. Therefore the three peaks present in the IR spectrum have frequencies of 2715cm-1, 1213cm-1 and 1163cm-1.
Molecular Orbital Analysis of Borane
Determining the quantitive/ calculated molecular orbitals(MO's) of borane can be achieved by calculating its electronic structure using gaussview. Knowing the quantitive molecular orbitals of borane is useful when comparing the qualitative MO's approximated using the MO theory. Calculation of the electronic structure of borane is achieved by initially opening the .chk file of optimised borane. Then in 'gaussian calculation setup' select 'energy' as the job type and 'full NBO' under the NBO tab and add the phrase 'pop=full' in the additional keyword box. The calculation is carried out on the High Performance Computing(HPC) service. Here is link to the population analysis of borane published on D-spaceDOI:10042/22484
By opening the 'output file', the calculated MO's can be viewed and analysed. Below shows a calculated molecular orbital diagram of borane.
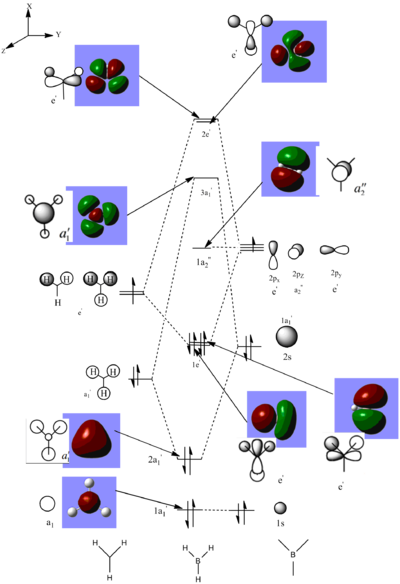
The MO diagram shows there is a good correlation between the calculated MO's and the LCAO MO predicted using MO theory. The calculated MO's are shown to have the same orbital phases as the LCAO MO's such that the LCAOs can be easily predicted by interpreting the images of the calculated MOs. The images of the calculated MOs are useful as they are able to show the distribution of the MO's across the borane molecule.
Computational Analysis of Thallium Tribromide
Optimisation of Thallium Tribromide
Thallium tribromide,TlBr3 can be optimised using a LanL2DZ basis set which is a medium level basis set. TlBr3 is restricted to a point group of D3h and the tolerance is set to very tight (0.0001). Optimisation calculations are submitted to the HPC service when using larger atoms or molecules. The calculations are then submitted to the digital depository D-space. Here is a link to the DOI for optimised TlBr3 published on D-space DOI:10042/22475 .
The table below summaries the fundamental information from an optimisation calculation of TlBr3

| File Name | log_69191logfile TlBR3 |
| File Type | .log |
| Calculation Type | FOPT |
| Calculation Method | RB3LYP |
| Basis Set | LANL2DZ |
| E(RB3LYP) | -91.21812851au |
| RMS Gradient Norm | 0.00000090 au |
| Dipole Moment | 0.00D |
| Point Group | D3H |
| Job cpu time | 19.2 seconds |
The item table below shows that the optimisation calculation was successful since the job had converged. The optimised Tl-Br bond length is 2.65 Angstrom (Å) and the optimised Br-Tl-Br bond angle is 120.0 degrees. A literature value for the Tl-Br bond length is found to be 2.5122 Angstrom (Å)[1]. Thus the optimised bond length is in good correlation to the literature value and proves that the optimisation calculation is accurate.
===='''Item table for TlBr<sub>3</sub> Optimisation '''====

         Item               Value     Threshold  Converged?
 Maximum Force            0.000002     0.000450     YES
 RMS     Force            0.000001     0.000300     YES
 Maximum Displacement     0.000022     0.001800     YES
 RMS     Displacement     0.000014     0.001200     YES
 Predicted change in Energy=-6.084045D-11
 Optimization completed.
    -- Stationary point found.
                           ----------------------------
                           !   Optimized Parameters   !
                           ! (Angstroms and Degrees)  !
 --------------------------                            --------------------------
 ! Name  Definition              Value          Derivative Info.                !
 --------------------------------------------------------------------------------
 ! R1    R(1,2)                  2.651          -DE/DX =    0.0                 !
 ! R2    R(1,3)                  2.651          -DE/DX =    0.0                 !
 ! R3    R(1,4)                  2.651          -DE/DX =    0.0                 !
 ! A1    A(2,1,3)              120.0            -DE/DX =    0.0                 !
 ! A2    A(2,1,4)              120.0            -DE/DX =    0.0                 !
 ! A3    A(3,1,4)              120.0            -DE/DX =    0.0                 !
 ! D1    D(2,1,4,3)            180.0            -DE/DX =    0.0                 !
 --------------------------------------------------------------------------------
Frequency analysis of Thallium Tribromide
Since thallium tribromide contains larger atoms compared to Borane, the frequency analysis calculations are run on the HPC service. Here is the DOI link to the calculations of frequency and vibrational analysis published on D-Space DOI:10042/22480
Below summarises the results from the frequency analysis:
| File Name | log_69335TlBr3frequency analysis |
| File Type | .log |
| Calculation Type | FREQ |
| Calculation Method | RB3LYP |
| Basis Set | LANL2DZ |
| E(RB3LYP) | -91.2183024 au |
| RMS Gradient Norm | 0.00000090 au |
| Dipole Moment | 0.00D |
| Point Group | D3H |
| Job cpu time | 22.6 seconds |
Low frequencies ---   -0.0012   -0.0006   -0.0001    1.8732    2.6583    2.6583
Low frequencies ---   46.6999   46.7000   51.9500
Harmonic frequencies (cm**-1), IR intensities (KM/Mole), Raman scattering
activities (A**4/AMU), depolarization ratios for plane and unpolarized
incident light, reduced masses (AMU), force constants (mDyne/A),
and normal coordinates:
                    1                      2                      3
                   ?A                     ?A                     A2"
Frequencies --    46.6999                46.7000                51.9500
Red. masses --    88.4542                88.4542               117.7209
Frc consts  --     0.1137                 0.1137                 0.1872
IR Inten    --     3.6815                 3.6815                 5.8464
 Atom  AN      X      Y      Z        X      Y      Z        X      Y      Z
    1  81     0.00   0.28   0.00    -0.28   0.00   0.00     0.00   0.00   0.55
    2  35     0.00   0.26   0.00     0.74   0.00   0.00     0.00   0.00  -0.48
    3  35     0.43  -0.49   0.00    -0.01  -0.43   0.00     0.00   0.00  -0.48
    4  35    -0.43  -0.49   0.00    -0.01   0.43   0.00     0.00   0.00  -0.48
                    4                      5                      6
                   ?B                     ?A                     ?A
Frequencies --   165.2732               210.7519               210.7519
Red. masses --    78.9183               101.4126               101.4126
Frc consts  --     1.2701                 2.6539                 2.6539
IR Inten    --     0.0000                25.4731                25.4732
 Atom  AN      X      Y      Z        X      Y      Z        X      Y      Z
    1  81     0.00   0.00   0.00     0.00   0.42   0.00     0.42   0.00   0.00
    2  35     0.00   0.58   0.00     0.00  -0.74   0.00     0.01   0.00   0.00
    3  35    -0.50  -0.29   0.00    -0.32  -0.18   0.00    -0.55  -0.32   0.00
    4  35     0.50  -0.29   0.00     0.32  -0.18   0.00    -0.55   0.32   0.00
The six low frequencies are very close to zero and they lie within the acceptable range of low frequencies. The largest zero frequency, ~3cm-1 is also much smaller than the first real frequency at~ 47cm-1.The real frequencies are all positive, which shows that the frequency analysis was carried our correctly. The lowest 'real' normal mode has a reported frequency of 46.6999cm-1.
IR Spectrum of Thallium Tribromide
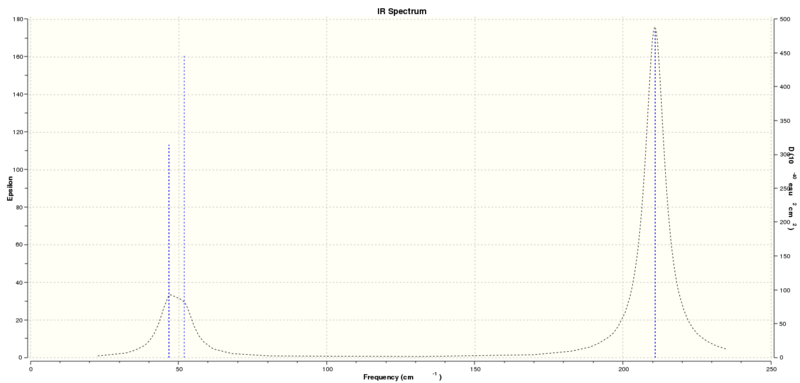
The IR spectrum of Thallium Tribromide is shown to have three peaks. The peaks at approximately 46 and 51cm-1 creates a broad peak since the frequencies are very close to each other. The third peak has a frequency of 210cm-1. The frequency at 165cm-1 is not present in the spectrum since it has an intensity of zero.
Comparison of Vibrational Frequencies of BH3 and TlBr3
| BH3 | 1163.00 | 1213.16 | 1213.16 | 2582.48 | 2715.61 | 2715.61 |
| TlBr3 | 46.70 | 46.70 | 51.95 | 165.27 | 210.75 | 210.75 |
The table above provides a summary of the vibrational frequencies of borane and thallium tribromide. By comparing these values it's evident that the vibrational frequencies of borane are much larger than that of thallium tribromide. This because the strength of the B-H bond is much greater than that of the Tl-Br bond.Since Thallium and Bromine are lower down in the periodic table compared to boron and hydrogen, their orbitals are more diffuse. Diffuse orbitals result in less efficient orbital overlap and so the bonding in Thallium Tribromide is weaker.
There is no reordering of the vibrational modes for BH3 and TlBr3 since both molecules have the same point group and so the symmetry labels for the various vibrational modes will also be the same.
The spectra of TlBr3 and BH3 are very similar such that they both contain three peaks. The peaks corresponding to the A2'' and E' vibrational modes are close in energy since they both correspond to bending modes. The A1' and the E' vibrational modes are also similar in energy since they both correspond to stretching modes. The stretching modes are higher in energy than the bending modes as they tend to have higher vibrational energy barriers compared to the bending modes.
Computational analysis of Boron Tribromide
Optimisation of Boron Tribromide
The optimisation of boron tribromide requires the use of mixed basis sets and pseudo potentials to take into account both light and heavy atoms. Using the BH3 6-31G (d,p) optimised log file, the hydrogen atoms are replaced by bromine atoms. A GEN basis set is selected and the phrase "pseudo=read gfinput" is added to the additional keyword box. The GEN basis set specifies the basis sets for each atom individually. Since heavier atoms are present in BBr3 optimisation calculations are run on the HPC service.However before the input file is submitted to the HPC service, the file must be modified to take into account the use of different basis sets for the boron and bromine atoms. The following format must be included in the input file:
coordinates
(blank line)
atomic symbols (space) 0 (zero)
normal basis set
- (four stars)
- (four stars)
atomic symbols (space) 0 (zero)
pseudo-potential basis set
- (four stars)
- (four stars)
(blank line)
atomic symbols (space) 0 (zero)
pseudo-potential
(blank line)
Here is a link to the optimised file published on D-space DOI:10042/22474
The table below summaries the results
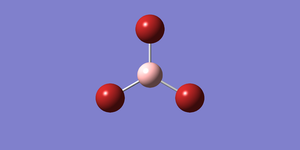
| File Name | log_69212OPT gen |
| File Type | .log |
| Calculation Type | FOPT |
| Calculation Method | RB3LYP |
| Basis Set | 3-21G |
| E(RB3LYP) | -64.43645253 au |
| RMS Gradient Norm | 0.00012323 au |
| Dipole Moment | 0.00D |
| Point Group | D3H |
| Job cpu time | 35.3 seconds |
The BBr3 optimisation calculation was successfully converged as shown in the item table below. The values are all very close to zero
The optimised B-Br bond length is 1.93 Angstroms(Å)and the optimised Br-B-Br angle is 120.0 degrees. The optimised B-Br bond length is in relatively good agreement with the literature value for a B-Br bond at 1.96 Å[2]
Item table for BBR3 optimisation using GEN basis set


   Item               Value     Threshold  Converged?
 Maximum Force            0.000246     0.000450     YES
 RMS     Force            0.000161     0.000300     YES
 Maximum Displacement     0.001151     0.001800     YES
 RMS     Displacement     0.000754     0.001200     YES
 Predicted change in Energy=-4.716315D-07
 Optimization completed.
    -- Stationary point found.
                           ----------------------------
                           !   Optimized Parameters   !
                           ! (Angstroms and Degrees)  !
 --------------------------                            --------------------------
 ! Name  Definition              Value          Derivative Info.                !
 --------------------------------------------------------------------------------
 ! R1    R(1,2)                  1.9333         -DE/DX =    0.0002              !
 ! R2    R(1,3)                  1.9333         -DE/DX =    0.0002              !
 ! R3    R(1,4)                  1.9333         -DE/DX =    0.0002              !
 ! A1    A(2,1,3)              120.0            -DE/DX =    0.0                 !
 ! A2    A(2,1,4)              120.0            -DE/DX =    0.0                 !
 ! A3    A(3,1,4)              120.0            -DE/DX =    0.0                 !
 ! D1    D(2,1,4,3)            180.0            -DE/DX =    0.0                 !
 --------------------------------------------------------------------------------
Structure Comparison of BH3 ,BBr3 and TlBr3
The table below provides a summary of the bond lengths for molecules BH3 ,BBr3 and TlBr3. The results show that a change in bond length is induced by both changes to the central atom and ligand.
Comparing the bond lengths in BH3 and BBr, the B-H bond is approximately 0.7 Å shorter than the B-Br bond at 1.93 Å. Hydrogen and Bromine are similar as they both require an additional electron to complete a full shell in the n=1 and n=2 shells respectively. However, Bromine lies in a lower period than Hydrogen which subsequently makes it a larger atom with more diffuse orbitals.In BH 3 sigma bonding is achieved through H1S and B2S and H1S and B2Pz orbital overlap whereas in BBr3 sigma bonding involves more diffuse orbitals such as the 4p orbitals. More diffuse orbitals leads to less efficient orbital overlap which results in weaker sigma bonding and hence the B-Br bond length is longer than the B-H bond
Comparing the bond lengths in BBr3 and TlBr3, the B-Br bond length is shown to be 0.7 Å shorter than the Tl-Br bond length at 1.93Å. Boron and Thallium are similar since they are both in group 3 and so both contain three valence electrons. The difference in bond length is attributed to Thallium lying lower down the group compared to Boron.Hence thallium is a larger atom containing more diffuse oribtals. Thallium contains 6S and 6Pz orbitals which makes orbital overlap and hence sigma bonding with bromine orbitals less efficient. The strength of the Tl-Br bond will therefore be weaker and longer than the B-Br bond.
| Molecule | Bond length (Å) |
| BH3 | 1.19 |
| BBr3 | 1.93 |
| TlBr3 | 2.65 |
Computational Analysis of Ammonia
Optimisation of Ammonia
A molecule of ammonia was created on gaussview. An optimisation calculation was then carried out using a 6-31G (d,p) basis set and B3LYP as the method. Here is a link to the output log file for the optimisation of ammonia.
The table below summaries the fundamental information obtained from an optimisation calculation of Ammonia
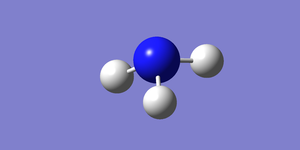
| File Name | NH3OPT |
| File Type | .log |
| Calculation Type | FOPT |
| Calculation Method | RB3LYP |
| Basis Set | 6-31G(d,p) |
| E(RB3LYP) | -56.55776856 au |
| RMS Gradient Norm | 0.00000885 au |
| Dipole Moment | 0.00D |
| Point Group | C1 |
| Job cpu time | 46.0 seconds |
The item table below shows that the optimisation calculation of Ammonia was successful since the job the that submitted to guassian converged. The optimised N-H bond length is 1.02 Angstroms(Å) and the optimised H-N-H bond angle is 105.7 degrees. The literature value for a N-H bond in ammonia is 1.0109 Å, which is in close agreement with the optimised bond length. The literature H-N-H bond angle is 106.75°, which is also it close agreement with the optimised angle.[3] Hence it can be concluded that the optimsation calculations carried out for ammonia has a good degree of accuracy.
Item table for NH3 optimisation

         Item               Value     Threshold  Converged?
 Maximum Force            0.000024     0.000450     YES
 RMS     Force            0.000012     0.000300     YES
 Maximum Displacement     0.000079     0.001800     YES
 RMS     Displacement     0.000053     0.001200     YES
 Predicted change in Energy=-1.629727D-09
 Optimization completed.
 -- Stationary point found.
                           ----------------------------
                           !   Optimized Parameters   !
                           ! (Angstroms and Degrees)  !
 --------------------------                            --------------------------
 ! Name  Definition              Value          Derivative Info.                !
 --------------------------------------------------------------------------------
 ! R1    R(1,2)                  1.018          -DE/DX =    0.0                 !
 ! R2    R(1,3)                  1.018          -DE/DX =    0.0                 !
 ! R3    R(1,4)                  1.018          -DE/DX =    0.0                 !
 ! A1    A(2,1,3)              105.7413         -DE/DX =    0.0                 !
 ! A2    A(2,1,4)              105.7486         -DE/DX =    0.0                 !
 ! A3    A(3,1,4)              105.7479         -DE/DX =    0.0                 !
 ! D1    D(2,1,4,3)           -111.8631         -DE/DX =    0.0                 !
 --------------------------------------------------------------------------------
 GradGradGradGradGradGradGradGradGradGradGradGradGradGradGradGradGradGrad
Frequency Analysis of Ammonia
A frequency analysis of ammonia was carried out on guassview using a copy of the log file of optimised NH3. In 'GaUssian Calculation setup', the 'frequency' is selected as the job type. the phrase ' int=grid=ultrafine' is added to the additional keyword box.The job was then submitted to gaussian. Here is a link to the output log file for the frequency analysis calculation of Ammonia
The table below shows a summary of the information obtained from the frequency analysis calculation of Ammonia. The summary table shows that the frequency analysis calculation was carried out correctly since the energy of the NH3 molecule is the same as that for the optimised molecule of NH3
| File Name | NH3_freq |
| File Type | .log |
| Calculation Type | FREQ |
| Calculation Method | RB3LYP |
| Basis Set | 6-31G(d,p) |
| E(RB3LYP) | -56.55776872au |
| RMS Gradient Norm | 0.00000811 au |
| Dipole Moment | 1.85D |
| Point Group | C1 |
| Job cpu time | 42.0 seconds |
The item table below shows that the optimised NH3 is at a minimum since the 6 low frequencies are within the frequency range of ±15 cm-1 and the largest zero frequency at ~15cm-1 is much lower relative to the lowest real frequency at 1089cm-1.
==='''item table for frequency analysis of Ammonia'''===
 Low frequencies ---  -10.3123   -0.0014   -0.0012   -0.0012    8.9888   14.5345
 Low frequencies --- 1089.3114 1693.9155 1693.9481
 Harmonic frequencies (cm**-1), IR intensities (KM/Mole), Raman scattering
 activities (A**4/AMU), depolarization ratios for plane and unpolarized
 incident light, reduced masses (AMU), force constants (mDyne/A),
 and normal coordinates:
                     1                      2                      3
                     A                      A                      A
 Frequencies --  1089.3114              1693.9155              1693.9481
 Red. masses --     1.1800                 1.0644                 1.0644
 Frc consts  --     0.8250                 1.7995                 1.7996
 IR Inten    --   145.4454                13.5609                13.5561
  Atom  AN      X      Y      Z        X      Y      Z        X      Y      Z
     1   7     0.12   0.00   0.00     0.00   0.05   0.04     0.00   0.04  -0.05
     2   1    -0.53  -0.21   0.00     0.21   0.12  -0.45     0.15   0.09   0.61
     3   1    -0.53   0.11   0.18    -0.24  -0.20   0.27     0.11  -0.63   0.29
     4   1    -0.53   0.11  -0.18     0.03  -0.66  -0.36    -0.26   0.00  -0.17
                     4                      5                      6
                     A                      A                      A
 Frequencies --  3461.2807              3589.7786              3589.9111
 Red. masses --     1.0272                 1.0883                 1.0883
 Frc consts  --     7.2509                 8.2633                 8.2639
 IR Inten    --     1.0589                 0.2690                 0.2699
  Atom  AN      X      Y      Z        X      Y      Z        X      Y      Z
     1   7    -0.04   0.00   0.00     0.00  -0.03   0.07     0.00   0.07   0.03
     2   1     0.18  -0.55   0.00    -0.13   0.31   0.02     0.28  -0.69   0.01
     3   1     0.18   0.27   0.47    -0.18  -0.24  -0.37    -0.25  -0.29  -0.54
     4   1     0.18   0.27  -0.48     0.31   0.38  -0.65    -0.03  -0.02   0.08

 -------------------
Molecular Orbital analysis of Ammonia
Calculation the molecular orbitals of Ammonia is achieved by opening the .chkfile of optimised NH3.Then in 'gaussian calculation setup' select 'Energy' under job type, ' full NBO' under the NBO tab and add the phrase 'pop=full' in the additional keyword box. The job is then submitted to the the HPC service for the calculation to be run. Here is the DOI link to the calcualated MO's of ammonia DOI:10042/22611
By comparing the calculated MO of ammonia with the LCAOs it is evident that there is good correlation between the approximated MO theory with the calculated MOs. The calculated MOs have the same orbital phases as that seen in the LCAO diagram, and the LCAOs can be predicted using the calculated MO diagrams. The unoccupied calculated orbitals are shown to be more diffuse than the occupied orbitals which is a consequence of their low electron density
Natural Bond Orbital(NBO) Analysis of Ammonia
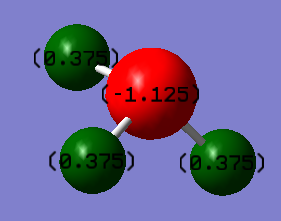
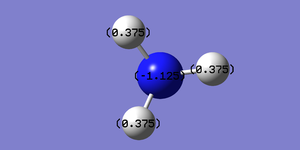
A natural bond orbital(NBO) analysis is useful in deducing the charge distribution of ammonia. Firstly, the '.logfile' of the population analysed NH3 molecule is opened. Then under the 'results' menu charge distribution.NBOis selected under the 'type ' option and the 'colour atoms by charge' box is ticked. This enables a diagram of the charge distribution of ammonia to be illustrated as shown in the image below,top left. The charge range is from -1 to +1 where the colour red indicates negative charge and the colour green indicates positive charge. The left image therefore shows that the negative charge is located on nitrogen, which makes perfect sense since nitrogen is more electronegative than hydrogen. The image, bottom left, highlights the specific charges on the nitrogen and hydrogen atoms. A more negative charge of -1.125 is located on the nitrogen atom and a higher charge of 0.375 on the hydrogen atoms.
Calculation of Association Energies: Ammonia-Borane
The complex ammonia-borane is an acid-base complex where ammonia acts a lewis base, donating its lone pair of electrons to the vacant p orbital on borane via the formation of a dative bond. The energy of the dative bond can be determined using gaussview. The formation of the ammonia-borane complex is essentially a reaction where ammonia and borane are the reactants and ammonia-borane is the product. The energy of the dative bond can be determined by comparing the energy of the ammonia-borane complex with that of the reactants. The energy of optimised molecules of ammonia and borane have already been determined so only the energy of the ammonia-borane complex needs to be determined. The following steps must be applied
Optimisation of Ammonia-Borane
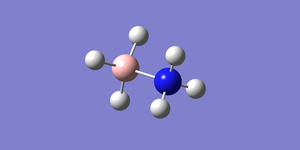
First an ammonia-borane complex is created on gaussview. The complex is then optimised using 6-31g(d,p) basis set and using B3LYP as the method. Here is link to the optimised ammonia-borane molecule published on D-space DOI:10042/22795 . The item table below shows that the job has converged and hence the computed optimisation calculation is complete
| File Name | NH3BH3_OPT |
| File Type | .log |
| Calculation Type | FOPT |
| Calculation Method | RB3LYP |
| Basis Set | 6-31G(d,p) |
| E(RB3LYP) | -83.22468949 au |
| RMS Gradient Norm | 0.00013768 au |
| Dipole Moment | 5.57D |
| Point Group | C1 |
| Job cpu time | 1 minute 33.0 seconds |
===='''item table for Optimisation of Ammonia-Borane'''====


Item               Value     Threshold  Converged?
 Maximum Force            0.000169     0.000450     YES
 RMS     Force            0.000087     0.000300     YES
 Maximum Displacement     0.001128     0.001800     YES
 RMS     Displacement     0.000460     0.001200     YES
 Predicted change in Energy=-5.861530D-07
 Optimization completed.
    -- Stationary point found.
                           ----------------------------
                           !   Optimized Parameters   !
                           ! (Angstroms and Degrees)  !
 --------------------------                            --------------------------
 ! Name  Definition              Value          Derivative Info.                !
 --------------------------------------------------------------------------------
 ! R1    R(1,2)                  1.6678         -DE/DX =    0.0                 !
 ! R2    R(1,3)                  1.0187         -DE/DX =   -0.0001              !
 ! R3    R(1,4)                  1.0187         -DE/DX =   -0.0001              !
 ! R4    R(1,5)                  1.0187         -DE/DX =   -0.0001              !
 ! R5    R(2,6)                  1.2095         -DE/DX =    0.0001              !
 ! R6    R(2,7)                  1.2095         -DE/DX =    0.0001              !
 ! R7    R(2,8)                  1.2095         -DE/DX =    0.0001              !
 ! A1    A(2,1,3)              111.1114         -DE/DX =   -0.0002              !
 ! A2    A(2,1,4)              111.1035         -DE/DX =   -0.0001              !
 ! A3    A(2,1,5)              111.1116         -DE/DX =   -0.0002              !
 ! A4    A(3,1,4)              107.7837         -DE/DX =    0.0002              !
 ! A5    A(3,1,5)              107.7831         -DE/DX =    0.0002              !
 ! A6    A(4,1,5)              107.7885         -DE/DX =    0.0001              !
 ! A7    A(1,2,6)              104.5882         -DE/DX =    0.0                 !
 ! A8    A(1,2,7)              104.5778         -DE/DX =    0.0                 !
 ! A9    A(1,2,8)              104.5892         -DE/DX =    0.0                 !
 ! A10   A(6,2,7)              113.8823         -DE/DX =    0.0                 !
 ! A11   A(6,2,8)              113.8808         -DE/DX =    0.0                 !
 ! A12   A(7,2,8)              113.8881         -DE/DX =    0.0                 !
 ! D1    D(3,1,2,6)            179.9865         -DE/DX =    0.0                 !
 ! D2    D(3,1,2,7)            -60.0169         -DE/DX =    0.0                 !
 ! D3    D(3,1,2,8)             59.9866         -DE/DX =    0.0                 !
 ! D4    D(4,1,2,6)             59.9902         -DE/DX =    0.0                 !
 ! D5    D(4,1,2,7)            179.9868         -DE/DX =    0.0                 !
 ! D6    D(4,1,2,8)            -60.0097         -DE/DX =    0.0                 !
 ! D7    D(5,1,2,6)            -60.0124         -DE/DX =    0.0                 !
 ! D8    D(5,1,2,7)             59.9841         -DE/DX =    0.0                 !
 ! D9    D(5,1,2,8)            179.9876         -DE/DX =    0.0                 !
 --------------------------------------------------------------------------------
 GradGradGradGradGradGradGradGradGradGradGradGradGradGradGradGradGradGrad
Frequency analysis of Ammonia-Borane
Frequency analysis of Ammonia-Borane is carried out using the same method and basis set as the optimisation calculation. Here is a to the log file published on D-Space {{DOI
The low frequencies range from approximatey -22 to 9 cm-1. These values are relatively close to zero, which proves that an energy minimum structure has been obtained. The real frequencies are all positive.
| File Name | logfile_MO_analysis_Ammonia_Borane |
| File Type | .log |
| Calculation Type | FREQ |
| Calculation Method | RB3LYP |
| Basis Set | 6-31G(d,p) |
| E(RB3LYP) | -83.22468891 au |
| RMS Gradient Norm | 0.00005856au |
| Dipole Moment | 5.57D |
| Point Group | C1 |
| Job cpu time | 2 minute 13.2 seconds |
Low frequencies ---  -22.9610    0.0005    0.0014    0.0015    6.8532    8.5552
 Low frequencies ---  262.9812  632.4581  638.7488
| Mode | Frequency | Infrared | mode | Frequency | Infrared |
| 1 | 267 | 0 | 10 | 1329 | 114 |
| 2 | 632 | 14 | 11 | 1676 | 28 |
| 3 | 639 | 4 | 12 | 1676 | 28 |
| 4 | 639 | 4 | 13 | 2470 | 67 |
| 5 | 1069 | 40 | 14 | 2530 | 231 |
| 6 | 1069 | 41 | 15 | 2530 | 231 |
| 7 | 1196 | 109 | 16 | 3463 | 3 |
| 8 | 1204 | 3 | 17 | 3580 | 28 |
| 9 | 1204 | 4 | 18 | 3580 | 28 |
Association energy Calculation of Ammonia-Borane
E(NH3)= -56.55776872au
E(BH3)=-26.61532252 au
E(NH3BH3)=-83.22468827 au
ΔE= E(NH3BH3)-[E(NH3)+E(BH3)]= -0.05159703au = -135.47Kjmol-1
Hence the dissociation energy of Ammonia-Borane is -135.47Kjmol-1
Computational analysis of Benzene
Benzene is an aromatic compound. MO analysis is useful to analyse the aromaticity and how this changes by modifying the substituents on the benzene ring.
Optimisation of Benzene
A molecule of benzene is created on gaussview. An optimisation calculation is then carried out using a 6-31G (d,p) basis set. The link the DOI published on D-Space is DOI:10042/22566
| File Name | log_69579_BENZENE |
| File Type | .log |
| Calculation Type | FOPT |
| Calculation Method | RB3LYP |
| Basis Set | 6-31G(d,p) |
| E(RB3LYP) | -232.25820551au |
| RMS Gradient Norm | 0.00009549 au |
| Dipole Moment | 0.00D |
| Point Group | C1 |
| Job cpu time | 2 minutes 2.9 seconds |
The energy value of benzene at -232.25820551au is much lower than the energy values previously seen for simpler molecules such as borane. The low energy of benzene is due to its aromatic properties, where the delocalisation of electrons results in molecular stabilisation.
The item table below, shows that the optimisation calculation has converged.The optimised C-C and C-H bond lengths are 1.34 and 1.09 Angstroms respectively
item table for Optimisation of Benzene

Item               Value     Threshold  Converged?
 Maximum Force            0.000212     0.000450     YES
 RMS     Force            0.000085     0.000300     YES
 Maximum Displacement     0.000991     0.001800     YES
 RMS     Displacement     0.000315     0.001200     YES
 Predicted change in Energy=-5.157454D-07
 Optimization completed.
    -- Stationary point found.
                           ----------------------------
                           !   Optimized Parameters   !
                           ! (Angstroms and Degrees)  !
 --------------------------                            --------------------------
 ! Name  Definition              Value          Derivative Info.                !
 --------------------------------------------------------------------------------
 ! R1    R(1,2)                  1.3963         -DE/DX =    0.0001              !
 ! R2    R(1,6)                  1.3961         -DE/DX =    0.0002              !
 ! R3    R(1,7)                  1.0861         -DE/DX =    0.0002              !
 ! R4    R(2,3)                  1.3961         -DE/DX =    0.0002              !
 ! R5    R(2,8)                  1.0861         -DE/DX =    0.0002              !
 ! R6    R(3,4)                  1.3963         -DE/DX =    0.0001              !
 ! R7    R(3,9)                  1.086          -DE/DX =    0.0002              !
 ! R8    R(4,5)                  1.3961         -DE/DX =    0.0002              !
 ! R9    R(4,10)                 1.086          -DE/DX =    0.0002              !
 ! R10   R(5,6)                  1.3963         -DE/DX =    0.0001              !
 ! R11   R(5,11)                 1.0861         -DE/DX =    0.0002              !
 ! R12   R(6,12)                 1.0861         -DE/DX =    0.0002              !
 ! A1    A(2,1,6)              119.9972         -DE/DX =    0.0                 !
 ! A2    A(2,1,7)              119.9949         -DE/DX =    0.0                 !
 ! A3    A(6,1,7)              120.0079         -DE/DX =    0.0                 !
 ! A4    A(1,2,3)              120.0079         -DE/DX =    0.0                 !
 ! A5    A(1,2,8)              119.9881         -DE/DX =    0.0                 !
 ! A6    A(3,2,8)              120.004          -DE/DX =    0.0                 !
 ! A7    A(2,3,4)              119.9948         -DE/DX =    0.0                 !
 ! A8    A(2,3,9)              120.0086         -DE/DX =    0.0                 !
 ! A9    A(4,3,9)              119.9966         -DE/DX =    0.0                 !
 ! A10   A(3,4,5)              119.9972         -DE/DX =    0.0                 !
 ! A11   A(3,4,10)             119.9934         -DE/DX =    0.0                 !
 ! A12   A(5,4,10)             120.0094         -DE/DX =    0.0                 !
 ! A13   A(4,5,6)              120.0083         -DE/DX =    0.0                 !
 ! A14   A(4,5,11)             120.0014         -DE/DX =    0.0                 !
 ! A15   A(6,5,11)             119.9904         -DE/DX =    0.0                 !
 ! A16   A(1,6,5)              119.9946         -DE/DX =    0.0                 !
 ! A17   A(1,6,12)             120.0106         -DE/DX =    0.0                 !
 ! A18   A(5,6,12)             119.9948         -DE/DX =    0.0                 !
 ! D1    D(6,1,2,3)             -0.0059         -DE/DX =    0.0                 !
 ! D2    D(6,1,2,8)            180.0023         -DE/DX =    0.0                 !
 ! D3    D(7,1,2,3)           -180.01           -DE/DX =    0.0                 !
 ! D4    D(7,1,2,8)             -0.0019         -DE/DX =    0.0                 !
 ! D5    D(2,1,6,5)             -0.0055         -DE/DX =    0.0                 !
 ! D6    D(2,1,6,12)          -179.9972         -DE/DX =    0.0                 !
 ! D7    D(7,1,6,5)           -180.0013         -DE/DX =    0.0                 !
 ! D8    D(7,1,6,12)             0.007          -DE/DX =    0.0                 !
 ! D9    D(1,2,3,4)              0.0117         -DE/DX =    0.0                 !
 ! D10   D(1,2,3,9)           -179.9914         -DE/DX =    0.0                 !
 ! D11   D(8,2,3,4)            180.0036         -DE/DX =    0.0                 !
 ! D12   D(8,2,3,9)              0.0005         -DE/DX =    0.0                 !
 ! D13   D(2,3,4,5)             -0.0062         -DE/DX =    0.0                 !
 ! D14   D(2,3,4,10)          -180.0059         -DE/DX =    0.0                 !
 ! D15   D(9,3,4,5)            179.9969         -DE/DX =    0.0                 !
 ! D16   D(9,3,4,10)            -0.0028         -DE/DX =    0.0                 !
 ! D17   D(3,4,5,6)             -0.0051         -DE/DX =    0.0                 !
 ! D18   D(3,4,5,11)           180.0058         -DE/DX =    0.0                 !
 ! D19   D(10,4,5,6)          -180.0055         -DE/DX =    0.0                 !
 ! D20   D(10,4,5,11)            0.0054         -DE/DX =    0.0                 !
 ! D21   D(4,5,6,1)              0.011          -DE/DX =    0.0                 !
 ! D22   D(4,5,6,12)           180.0027         -DE/DX =    0.0                 !
 ! D23   D(11,5,6,1)          -179.9999         -DE/DX =    0.0                 !
 ! D24   D(11,5,6,12)           -0.0082         -DE/DX =    0.0                 !
 --------------------------------------------------------------------------------
 GradGradGradGradGradGradGradGradGradGradGradGradGradGradGradGradGradGrad
Frequency Analysis of Benzene
The Frequency analysis is carried out using the same basis set and method as that used for the optimisation calculation. The link to the DOI is DOI:10042/22620
| File name | log_69589_FREQ_BENZENE_COM |
| File Type | .log |
| Calculation Type | FREQ |
| Calculation Method | RB3LYP |
| Basis Set | 6-31G(d,p) |
| E(RB3LYP) | -232.25820298au |
| RMS Gradient Norm | 0.00009245 au |
| Dipole Moment | 0.00D |
| Point Group | C1 |
| Job cpu time | 11 minutes 23.6 seconds |
The low frequencies are within an acceptable range and are close to zero. The highest low frequency is much smaller than the lowest real frequency value at 414cm-1. The frequency analysis was carried out correctly since the tabulated frequencies are all positive.
Low frequencies ---  -15.5663  -14.5022  -13.9318   -0.0009   -0.0006    0.0000
 Low frequencies ---  414.0684  414.1453  620.9624
| Mode | Frequencycm-1 | Infrared | mode | Frequency-1 | Infrared |
| 1 | 414 | 0 | 16 | 1179 | 0 |
| 2 | 414 | 0 | 17 | 1202 | 0 |
| 3 | 621 | 0 | 18 | 1202 | 0 |
| 4 | 621 | 0 | 19 | 1356 | 0 |
| 5 | 693 | 74 | 20 | 1380 | 0 |
| 6 | 718 | 0 | 21 | 1524 | 7 |
| 7 | 864 | 0 | 22 | 1524 | 7 |
| 8 | 864 | 0 | 23 | 1653 | 0 |
| 9 | 974 | 0 | 24 | 1653 | 0 |
| 10 | 974 | 0 | 25 | 3174 | 0 |
| 11 | 1012 | 0 | 26 | 3184 | 0 |
| 12 | 1018 | 0 | 27 | 3184 | 0 |
| 13 | 1020 | 0 | 28 | 3199 | 47 |
| 14 | 1066 | 3 | 29 | 3200 | 47 |
| 15 | 1066 | 3 | 30 | 3210 | 0 |
MO Analysis of Benzene
The MO analysis of Benzene was calculated using the HPC service. As for any MO analysis calculation, energy was selected as method, full NBO is selected in the NBO tab and the phrase pop=full is added to the additional keyword box. The DOI to the completed MO analysis is given: DOI:10042/22628
The calculated MOs were analysed and the center of the MO diagram for Benzene is given below from MO 7-30. Aromaticity is achieved in benzene through the overlap of p orbitals as a result of the conjugated double carbon bonds in the molecule. The P orbitals are out of plane relative to the carbon atoms and as a result of this the electrons in the p orbitals are not localised around one atom but instead are delocalised across all six carbon atoms. Consequently, these creates a cloud of electron density above and below the plane of the benzene ring. This is evident in MO 17 in the diagram below. MO 17 is fully bonding through the overlap of the Pz orbitals, which creates two pi electron clouds above and below the plane of the ring. Hence aromaticity is measured as the total pi electron density.

NBO Analysis of Benzene
NBO analysis provides evidence for the delocalisation of electrons around the benzene ring due to the negative charge at the carbon atoms . As explained previously the delocalisation of electrons around the benzene ring creates large electron density around the carbon atoms. The evidence for aromaticity is illustrated in the charge distribution diagram below where the red carbon atoms indicates negative charge and the green hydrogen atoms indicate positive charges
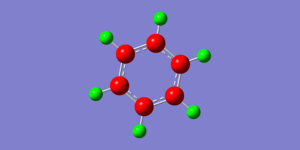

The specific charges of carbon and hydrogen are shown in the image on the right. The charge ranges from -0.239 to 0.239. The negative charge resides on the carbon atoms due the high electron density surrounding the ring and so they have a lower charge of -0.239. There is less electron density surrounding the hydrogen atoms and so they have a less negative charge of 0.239
Computational analysis of Boratabenzene
Optimisation of boratabenzene
Boratabenzene is isolectronic with benzene. A C-H unit in benzene is replaced with a B-H unit. A negative charge also resides on the boron atom.

Optimisation of boratabenzene is carried out using the same basis set and method as that used for benzene. However, it's important to take into account the negative charge that resides on the boron atom. This is achieved by adding the value -1 in the charge box in the method tab. The log input file is submitted to the HPC service for calculations to be run. The results can be found in the following link DOI:10042/22742 .
The optimisation summary is provided below:
| File Name | log_69968_Boratabenzene_opt |
| File Type | .log |
| Calculation Type | FOPT |
| Calculation Method | RB3LYP |
| Basis Set | 6-31G(d,p) |
| E(RB3LYP) | -219.020529841au |
| RMS Gradient Norm | 0.00015813 au |
| Dipole Moment | 2.85D |
| Point Group | C1 |
| Job cpu time | 3 minutes 57.3 seconds |
The item table below shows that the optimisation calculation has successfully converged. The optimised C-H bond, B-H, C-C and B-C bond is 1.10 Å, 1.22 Å, 1.40 Å and 1.51 Å respectively.
Item table for Boratabenzene optimisation

  Item               Value     Threshold  Converged?
 Maximum Force            0.000160     0.000450     YES
 RMS     Force            0.000069     0.000300     YES
 Maximum Displacement     0.000922     0.001800     YES
 RMS     Displacement     0.000325     0.001200     YES
 Predicted change in Energy=-6.583359D-07
 Optimization completed.
    -- Stationary point found.
                           ----------------------------
                           !   Optimized Parameters   !
                           ! (Angstroms and Degrees)  !
 --------------------------                            --------------------------
 ! Name  Definition              Value          Derivative Info.                !
 --------------------------------------------------------------------------------
 ! R1    R(1,2)                  1.3989         -DE/DX =    0.0                 !
 ! R2    R(1,7)                  1.097          -DE/DX =   -0.0001              !
 ! R3    R(1,12)                 1.5138         -DE/DX =    0.0001              !
 ! R4    R(2,3)                  1.4053         -DE/DX =   -0.0001              !
 ! R5    R(2,8)                  1.0968         -DE/DX =    0.0001              !
 ! R6    R(3,4)                  1.4053         -DE/DX =   -0.0001              !
 ! R7    R(3,9)                  1.0916         -DE/DX =   -0.0001              !
 ! R8    R(4,5)                  1.3989         -DE/DX =    0.0                 !
 ! R9    R(4,10)                 1.0968         -DE/DX =    0.0001              !
 ! R10   R(5,11)                 1.097          -DE/DX =   -0.0001              !
 ! R11   R(5,12)                 1.5137         -DE/DX =    0.0001              !
 ! R12   R(6,12)                 1.2185         -DE/DX =    0.0                 !
 ! A1    A(2,1,7)              115.9535         -DE/DX =    0.0001              !
 ! A2    A(2,1,12)             120.0812         -DE/DX =   -0.0001              !
 ! A3    A(7,1,12)             123.9653         -DE/DX =   -0.0001              !
 ! A4    A(1,2,3)              122.1381         -DE/DX =    0.0001              !
 ! A5    A(1,2,8)              120.4267         -DE/DX =   -0.0002              !
 ! A6    A(3,2,8)              117.4352         -DE/DX =    0.0                 !
 ! A7    A(2,3,4)              120.4509         -DE/DX =   -0.0001              !
 ! A8    A(2,3,9)              119.7732         -DE/DX =    0.0001              !
 ! A9    A(4,3,9)              119.7759         -DE/DX =    0.0001              !
 ! A10   A(3,4,5)              122.1393         -DE/DX =    0.0001              !
 ! A11   A(3,4,10)             117.4371         -DE/DX =    0.0                 !
 ! A12   A(5,4,10)             120.4236         -DE/DX =   -0.0002              !
 ! A13   A(4,5,11)             115.9494         -DE/DX =    0.0001              !
 ! A14   A(4,5,12)             120.0809         -DE/DX =   -0.0001              !
 ! A15   A(11,5,12)            123.9696         -DE/DX =   -0.0001              !
 ! A16   A(1,12,5)             115.1096         -DE/DX =    0.0                 !
 ! A17   A(1,12,6)             122.4423         -DE/DX =    0.0                 !
 ! A18   A(5,12,6)             122.4481         -DE/DX =    0.0                 !
 ! D1    D(7,1,2,3)           -180.0017         -DE/DX =    0.0                 !
 ! D2    D(7,1,2,8)              0.0007         -DE/DX =    0.0                 !
 ! D3    D(12,1,2,3)            -0.0024         -DE/DX =    0.0                 !
 ! D4    D(12,1,2,8)           180.0001         -DE/DX =    0.0                 !
 ! D5    D(2,1,12,5)             0.0015         -DE/DX =    0.0                 !
 ! D6    D(2,1,12,6)           180.0009         -DE/DX =    0.0                 !
 ! D7    D(7,1,12,5)           180.0008         -DE/DX =    0.0                 !
 ! D8    D(7,1,12,6)             0.0002         -DE/DX =    0.0                 !
 ! D9    D(1,2,3,4)              0.0            -DE/DX =    0.0                 !
 ! D10   D(1,2,3,9)           -179.9994         -DE/DX =    0.0                 !
 ! D11   D(8,2,3,4)           -180.0024         -DE/DX =    0.0                 !
 ! D12   D(8,2,3,9)             -0.0017         -DE/DX =    0.0                 !
 ! D13   D(2,3,4,5)              0.0035         -DE/DX =    0.0                 !
 ! D14   D(2,3,4,10)          -180.002          -DE/DX =    0.0                 !
 ! D15   D(9,3,4,5)            180.0028         -DE/DX =    0.0                 !
 ! D16   D(9,3,4,10)            -0.0027         -DE/DX =    0.0                 !
 ! D17   D(3,4,5,11)          -180.0044         -DE/DX =    0.0                 !
 ! D18   D(3,4,5,12)            -0.0042         -DE/DX =    0.0                 !
 ! D19   D(10,4,5,11)            0.0012         -DE/DX =    0.0                 !
 ! D20   D(10,4,5,12)          180.0014         -DE/DX =    0.0                 !
 ! D21   D(4,5,12,1)             0.0017         -DE/DX =    0.0                 !
 ! D22   D(4,5,12,6)           180.0023         -DE/DX =    0.0                 !
 ! D23   D(11,5,12,1)          180.0019         -DE/DX =    0.0                 !
 ! D24   D(11,5,12,6)            0.0025         -DE/DX =    0.0                 !
 --------------------------------------------------------------------------------
 GradGradGradGradGradGradGradGradGradGradGradGradGradGradGradGradGradGrad
Frequency Analysis of boratabenzene
The frequency analysis of boratabenzene is carried out using the same steps as that for benzene. The calculations for frequency analysis is carried out the HPC service. The following DOI link gives results of the calculation DOI:10042/22743
| File Name | Boratabenzene_FREQ |
| File Type | .log |
| Calculation Type | FREQ |
| Calculation Method | RB3LYP |
| Basis Set | 6-31G(d,p) |
| E(RB3LYP) | -219.02052228au |
| RMS Gradient Norm | 0.00015648 au |
| Dipole Moment | 2.85D |
| Point Group | C1 |
| 11 minutes 31.8 seconds |
The low frequencies of Boratabenzene is summarised below:
Full mass-weighted force constant matrix:
Low frequencies ---   -6.8506   -0.0010   -0.0009   -0.0004    3.1967    5.6545
Low frequencies ---  371.2614  404.4992  565.1636
The six low frequencies are with the acceptable low frequency range of -15 to +15 cm -1. Also the low frequencies values are much low relative to the zero real frequency of 371 cm-1. The table below summaries the frequencies and intensities of boratabenzene.
| Mode | Frequency | Infrared | mode | Frequency | Infrared |
| 1 | 371 | 2 | 16 | 1085 | 3 |
| 2 | 405 | 0 | 17 | 1175 | 1 |
| 3 | 565 | 0 | 18 | 1180 | 1 |
| 4 | 568 | 0 | 19 | 1228 | 1 |
| 5 | 608 | 11 | 20 | 1334 | 31 |
| 6 | 711 | 0 | 21 | 1449 | 9 |
| 7 | 864 | 3 | 22 | 1463 | 14 |
| 8 | 815 | 0 | 23 | 1565 | 7 |
| 9 | 874 | 28 | 24 | 1592 | 40 |
| 10 | 906 | 0 | 25 | 2447 | 368 |
| 11 | 917 | 1 | 26 | 3027 | 109 |
| 12 | 951 | 0 | 27 | 3030 | 2 |
| 13 | 951 | 0 | 28 | 3069 | 378 |
| 14 | 960 | 2 | 29 | 3061 | 8 |
| 15 | 1012 | 3 | 30 | 3115 | 113 |
MO Analysis of Boratabenzene
MO analysis was carried out using the steps as for the MO analysis of benzene. The following DOI link gives results of the calculation published on D-Space: DOI:10042/22749
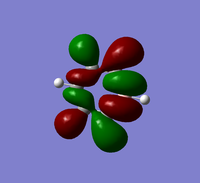
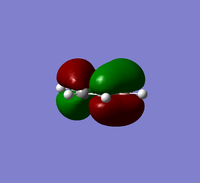
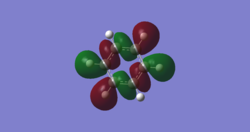
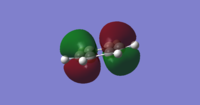
The table below provides a comparison of three selected MOs of boratabenzene with the same MOs in Benzene
 |
 |
 |
 |
 |
 |
MO 17 Comparison
MO 17 represents fully bonding pi orbital interactions.Comparing the images of MO 17 for benzene and boratabenzene both look very similar. The images have the same phase pattern and the size of the electron density above and below the plane of the ring are also similar. Comparing the MO energies using the MO tools in gaussview, benzene has an energy of -0.35998 au whiles boratabenzene has a higher energy of -0.13208 au. This is because boratabenzene contains a boron atom which is less electronegative than carbon, and so has a lower contribution to bonding.
MO 18 Comparison
MO 18 illustates sigma bonding interactions. In benzene, the electron density distribution is equal, whiles in boratabenzene there is greater electron density near the B-H unit. MO 18 is a bonding MO, however since it's very high in energy and close to the LUMO,antibonding interactions are present in the molecule as well as bonding interactions. Boron is less electronegative than carbon and so has a higher contribution to antibonding interactions hence why the electron density is distorted towards boron in boratabenzene. Due to greater contributions to antibonding interactions in boratabenzene the energy of MO 18 is higher in energy at -0.08387 whiles the energy of MO 18 in benzene is -0.33963
MO 20 Comparison
MO 20 is a HOMO molecular orbital and so is the highest energy bonding orbital. As a consequence, MO 20 is not fully bonding and antibonding interactions are present. As a consequence, it would be expected that boron would have a higher contribution to the bonding interactions in MO 20 compared to carbon since it's less electronegative and therefore has higher energy atomic orbitals. The evidence for this explanation is illustrated in the images above. The electron density of MO 20 in boratabenzene is much larger around the boron end of the molecule, indicating boron's stronger contribution in this high energy bonding interaction. Contrastingly in benzene the electron density is smaller and evenly distribution across the molecule, indicating carbons smaller contribution is this high energy bonding interaction.
Influence of full MO diagram
As a consequence of the substitution of a C-H for a B-H unit, the bonding interactions in the molecule are no longer uniform compared to benzene. The electron density distribution of the MO is strongly influenced by boron where antibonding interactions will have larger electron densities near the boron atom and bonding interactions will have smaller electron densities near the boron atom. The MO diagram of boratabenzene will consequently have a loss of degeneracy compared to the MO diagram of benzene and the energy of the bonding MO are likely to be higher in energy compared to benzene.
NBO Analysis of Boratabenzene
The NBO analysis results of boratabenzene is shown below. The charge range is from -0.588 to 0.558. The light red/orange colour indicates very negative charge, darker red is less negative charge and green indicates positive charge. The image of the actual charges of the atoms on benzene coincides with the coloured charge distribution.
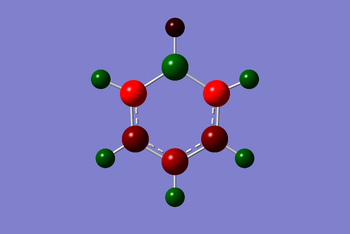
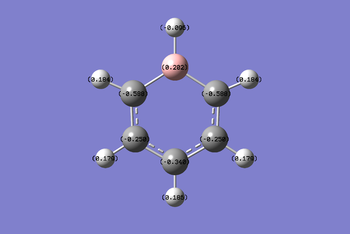
Understanding the resonance structures of boratabenzene provides better illustration of the charge values in boratabenzene. The resonance image below illustrates that the negative charge resides on the ortho and para carbons. The ortho carbons have a larger negative charge of -0.588 since they are adjacent to the negative charge on boron. The resonance image shows that no negative charge is localised on the meta carbons hence why they have a higher charge of -0.250. Boron has a positive charge of 0.202. This is because a majority of the resonance images has boron with three valence electrons and so is mostly electron deficient. Boron is less electronegative than carbon and so the hydrogen atom bonded to boron has a greater negative charge of -0.096 compared to the hydrogen atoms bonded to carbon.

Computational Analysis of Pyridinium
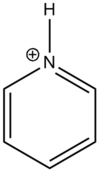
Pyridinium is also isoelectronic with benzene, where a C-H unit is replaced with an N-H unit. An electron is removed, creating a positive charge to achieve isoelectronicity.
Optimisation of Pyridinium
Optimisation of pyridinium is carried out using the same basis set and method as that used for benzene and boratabenzene. Pyridinium is positively charged and account for this is taken by adding 1 to the charge box under the method tab in guassian calculation setup. Here is a link to the DOI for the optimisation calculationsDOI:10042/22755
| File Name | logfile_Pyridinium_opt |
| File Type | .log |
| Calculation Type | FOPT |
| Calculation Method | RB3LYP |
| Basis Set | 6-31G(d,p) |
| E(RB3LYP) | -248.66807396 au |
| RMS Gradient Norm | 0.00003911 au |
| Dipole Moment | 1.87D |
| Point Group | C1 |
| Job cpu time | 4 minutes 0.1 seconds |
The item table below shows that the optimisation calculations converged. The optimised C-H, N-H,C-C and C-N bond lengths are 1.08 Å, 1.02 Å, 1.38 Å and 1.35 Å respectively.
Item               Value     Threshold  Converged?
Maximum Force            0.000064     0.000450     YES
RMS     Force            0.000023     0.000300     YES
Maximum Displacement     0.000822     0.001800     YES
RMS     Displacement     0.000175     0.001200     YES
Predicted change in Energy=-6.915416D-08
Optimization completed.
   -- Stationary point found.
                          ----------------------------
                          !   Optimized Parameters   !
                          ! (Angstroms and Degrees)  !
--------------------------                            --------------------------
! Name  Definition              Value          Derivative Info.                !
--------------------------------------------------------------------------------
! R1    R(1,2)                  1.3988         -DE/DX =    0.0                 !
! R2    R(1,5)                  1.3988         -DE/DX =    0.0                 !
! R3    R(1,6)                  1.0852         -DE/DX =    0.0                 !
! R4    R(2,3)                  1.3838         -DE/DX =    0.0                 !
! R5    R(2,7)                  1.0835         -DE/DX =    0.0                 !
! R6    R(3,8)                  1.0832         -DE/DX =    0.0                 !
! R7    R(3,12)                 1.3524         -DE/DX =    0.0                 !
! R8    R(4,5)                  1.3839         -DE/DX =    0.0                 !
! R9    R(4,10)                 1.0832         -DE/DX =    0.0                 !
! R10   R(4,12)                 1.3523         -DE/DX =    0.0001              !
! R11   R(5,11)                 1.0835         -DE/DX =    0.0                 !
! R12   R(9,12)                 1.0169         -DE/DX =    0.0                 !
! A1    A(2,1,5)              120.0549         -DE/DX =    0.0                 !
! A2    A(2,1,6)              119.9711         -DE/DX =    0.0                 !
! A3    A(5,1,6)              119.974          -DE/DX =    0.0                 !
! A4    A(1,2,3)              119.0827         -DE/DX =    0.0                 !
! A5    A(1,2,7)              121.4959         -DE/DX =   -0.0001              !
! A6    A(3,2,7)              119.4215         -DE/DX =    0.0                 !
! A7    A(2,3,8)              123.9326         -DE/DX =    0.0                 !
! A8    A(2,3,12)             119.2355         -DE/DX =    0.0                 !
! A9    A(8,3,12)             116.832          -DE/DX =    0.0                 !
! A10   A(5,4,10)             123.9293         -DE/DX =    0.0                 !
! A11   A(5,4,12)             119.2363         -DE/DX =    0.0                 !
! A12   A(10,4,12)            116.8344         -DE/DX =    0.0                 !
! A13   A(1,5,4)              119.082          -DE/DX =    0.0                 !
! A14   A(1,5,11)             121.4987         -DE/DX =   -0.0001              !
! A15   A(4,5,11)             119.4193         -DE/DX =    0.0001              !
! A16   A(3,12,4)             123.3087         -DE/DX =    0.0                 !
! A17   A(3,12,9)             118.345          -DE/DX =    0.0                 !
! A18   A(4,12,9)             118.3463         -DE/DX =    0.0                 !
! D1    D(5,1,2,3)              0.0007         -DE/DX =    0.0                 !
! D2    D(5,1,2,7)           -180.0001         -DE/DX =    0.0                 !
! D3    D(6,1,2,3)            180.0012         -DE/DX =    0.0                 !
! D4    D(6,1,2,7)              0.0004         -DE/DX =    0.0                 !
! D5    D(2,1,5,4)              0.0011         -DE/DX =    0.0                 !
! D6    D(2,1,5,11)           180.0004         -DE/DX =    0.0                 !
! D7    D(6,1,5,4)            180.0006         -DE/DX =    0.0                 !
! D8    D(6,1,5,11)            -0.0001         -DE/DX =    0.0                 !
! D9    D(1,2,3,8)            179.9997         -DE/DX =    0.0                 !
! D10   D(1,2,3,12)            -0.0019         -DE/DX =    0.0                 !
! D11   D(7,2,3,8)              0.0006         -DE/DX =    0.0                 !
! D12   D(7,2,3,12)          -180.0011         -DE/DX =    0.0                 !
! D13   D(2,3,12,4)             0.0013         -DE/DX =    0.0                 !
! D14   D(2,3,12,9)           180.0011         -DE/DX =    0.0                 !
! D15   D(8,3,12,4)          -180.0002         -DE/DX =    0.0                 !
! D16   D(8,3,12,9)            -0.0004         -DE/DX =    0.0                 !
! D17   D(10,4,5,1)           180.0007         -DE/DX =    0.0                 !
! D18   D(10,4,5,11)            0.0013         -DE/DX =    0.0                 !
! D19   D(12,4,5,1)            -0.0018         -DE/DX =    0.0                 !
! D20   D(12,4,5,11)         -180.0011         -DE/DX =    0.0                 !
! D21   D(5,4,12,3)             0.0005         -DE/DX =    0.0                 !
! D22   D(5,4,12,9)           180.0007         -DE/DX =    0.0                 !
! D23   D(10,4,12,3)         -180.0017         -DE/DX =    0.0                 !
! D24   D(10,4,12,9)           -0.0015         -DE/DX =    0.0                 !
--------------------------------------------------------------------------------
GradGradGradGradGradGradGradGradGradGradGradGradGradGradGradGradGradGrad
Frequency analysis of Pyridinium
Frequency analysis of pyridinium was carried out following the same steps used during the frequency analysis of benzene and boratabenzene. Here is link to the calculations of the analysis published on D-SpaceDOI:10042/22756
| File Name | logfile_Pyridinium_freq |
| File Type | .LOG |
| Calculation Type | Freq |
| Calculation Method | RB3LYP |
| Basis Set | 6-31G(d,p) |
| E(RB3LYP) | -248.66806085 au |
| RMS Gradient Norm | 0.00003282 au |
| Dipole Moment | 1.87D |
| Point Group | C1 |
| Job cpu time | 11 minutes 34.6 seconds |
Full mass-weighted force constant matrix:
Low frequencies ---   -9.5083   -5.2693   -0.0013    0.0006    0.0006    3.9525
Low frequencies ---  391.9048  404.3496  620.1993
| Mode | Frequency | Infrared | mode | Frequency | Infrared |
| 1 | 392 | 1 | 16 | 1200 | 3 |
| 2 | 404 | 0 | 17 | 1229 | 2 |
| 3 | 620 | 0 | 18 | 1300 | 3 |
| 4 | 645 | 0 | 19 | 1374 | 11 |
| 5 | 677 | 90 | 20 | 1416 | 3 |
| 6 | 748 | 82 | 21 | 1524 | 21 |
| 7 | 854 | 11 | 22 | 1580 | 48 |
| 8 | 883 | 0 | 23 | 1657 | 32 |
| 9 | 992 | 2 | 24 | 1677 | 34 |
| 10 | 1006 | 0 | 25 | 3223 | 0 |
| 11 | 1022 | 4 | 26 | 3240 | 1 |
| 12 | 1048 | 0 | 27 | 3241 | 11 |
| 13 | 1052 | 0 | 28 | 3199 | 47 |
| 14 | 1082 | 3 | 29 | 3254 | 0 |
| 15 | 1087 | 4 | 30 | 3569 | 158 |
MO Analysis of Pyridinium
Here is a link to the DOI for the MO analysis of benzeneDOI:10042/22757
 |
 |
 |
 |
 |
 |
Comparison of MO 17
MO 17 represents fully bonding pi interactions between the Pz orbitals. This interaction results in delocalisation of electrons between the p orbitals, which consequently creates an electron pi cloud above and below the plane of the ring as shown in the images above. In benzene, the electron pi cloud is distributed evenly across all carbon atoms above and below the plane of the ring however in pyridinium, the electron pi cloud is distorted towards the nitrogen atom.This is because nitrogen is more electronegative compared to carbon and so has a greater contribution to bonding interactions since it's atomic orbitals are lower in energy. Thus the energy of MO 17 is lower for pyridinium at compared to for benzene
Comparison of MO 18
MO 18 represents sigma bonding interactions. The MOs for benzene and pyridinium are quite similar and both MOs have the same phase interactions however the images shows that the electron density near the nitrogen atoms in pyridinium is much smaller compared to the other half of the molecule. MO 18 is a high energy bonding MO which doesn't possess fully bonding interactions since it's close to the LUMO. the represent of nodes in the MO suggests antibonding intereactions are present. Since nitrogen is more electronegative than carbon, it has a lower contribution to out of phase interactions,which is signified by the smaller electron density surrounding the nitogen atom. Carbon has a greater contribution is antibonding interactions, hence why the other half of the molecule has a larger electron density since benzene only contains carbon atoms in the ring, it has a greater contribution to bonding in MO compared to pyridinium ans so has a higher energy of -0.33963au whiles pyridinium has a lower energy value of -0.55741au.
Comparison of MO 20
MO 20 is a HOMO MO illustrating pi bonding interactions with one node. The MO image in benzene shows that there is an even distribution of electron density across the carbon atoms, above and below the plane of the ring. However, in pyridinium the electron density distribution is not equal where there is a smaller electron cloud associated with the C2p-N2p-C2p pi bonding interactions. Again this is due to nitrogen being more electronegative than carbon and so has a lower contribution to higher energy bonding MOs compared to carbon.
Influence of full MO diagram
As a consequence of the substitution of a C-H for a n-H unit, the bonding interactions in the molecule are no longer uniform compared to benzene. The electron density distribution of the MO is strongly influenced by nitrogen where antibonding interactions will have smaller electron densities near the nitrogen atom and bonding interactions will have larger electron densities near the nitrogen atom. The MO diagram of pyridinium will consequently have a loss of degeneracy compared to the MO diagram of benzene and the energy of the bonding MO are likely to be lower in energy compared to benzene.
NBO Analysis
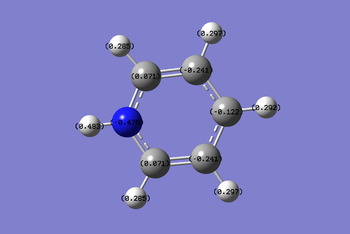
The charge distribution image of pyridinium ranges -0.483 to +0.483. Nitrogen possess the most negative charge at -0.476 due to it electronegative properties. The resonance images of pyridinium below shows that positive charge resides on the ortho and para carbon atoms. The ortho carbons have the most positive charge of 0.071 since they are adjacent to the nitrogen which is electronwithdrawing. The meta carbons don't have localised positive charge and so they have the most negative charge of -0.241. The hydrogen atom bonded to Nitrogen has the most positive charge of 0.483. This is because it's bonded to nitrogen which is very electron withdrawing.
The coloured charge distribution image supports the actual charges calculated in pyridinium. Red to green siginifies negative charge to positive charge, where the darker the colour is the weaker the charge. The orange coloured nitrogen atom represents negative charge. The meta and para carbon atoms are also negatively charge but not as much as nitrogen and so they are coloured in darker red. The positive charge on the ortho and hydrogen atoms are signified by the colour green.The ortho carbons are more positively charged and so they are coloured in a darker green colour


Computational analysis of Borazine
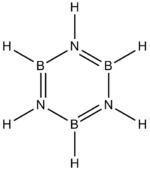
Borazine is also isoelectronic with benzene. Borazine contains alternating B-H and N-H units and possess no overall charge.
Optimisation of Borazine
The optimisation of borazine is carried out following the same steps as that used for Benzene, Boratabenzene and Pyridinium. The charge is selected at zero. Here is link to optimisation calculations published on D spaceDOI:/10042/22758
The table below provides a summary of the optimisation calculations
| File Name | logfile_Borazine_output |
| File Type | .log |
| Calculation Type | FREQ |
| Calculation Method | RB3LYP |
| Basis Set | 6-31G(d,p) |
| E(RB3LYP) | -242.68459789au |
| RMS Gradient Norm | 0.00007128 au |
| Dipole Moment | 0.00D |
| Point Group | C1 |
| Job cpu time | 5 minutes 10.9 seconds |
The item table below shows that the job has converged. The optimised B-N, B-H,N-H bond lengths are 1.43, 1.19 and 1.01 Angstroms respectively. Literature values for these bond lengths are 1.4355, 1.258 and 1.050 Angstroms respectively.[4]. There is relatively good correlation between calculated and literature values
 Item               Value     Threshold  Converged?
Maximum Force            0.000117     0.000450     YES
RMS     Force            0.000036     0.000300     YES
Maximum Displacement     0.000327     0.001800     YES
RMS     Displacement     0.000104     0.001200     YES
Predicted change in Energy=-1.206132D-07
Optimization completed.
   -- Stationary point found.
                          ----------------------------
                          !   Optimized Parameters   !
                          ! (Angstroms and Degrees)  !
--------------------------                            --------------------------
! Name  Definition              Value          Derivative Info.                !
--------------------------------------------------------------------------------
! R1    R(1,9)                  1.0097         -DE/DX =    0.0                 !
! R2    R(2,12)                 1.1949         -DE/DX =    0.0001              !
! R3    R(3,8)                  1.0097         -DE/DX =    0.0                 !
! R4    R(4,10)                 1.1949         -DE/DX =    0.0001              !
! R5    R(5,7)                  1.0097         -DE/DX =    0.0                 !
! R6    R(6,11)                 1.1949         -DE/DX =    0.0001              !
! R7    R(7,10)                 1.4307         -DE/DX =   -0.0001              !
! R8    R(7,11)                 1.4307         -DE/DX =    0.0                 !
! R9    R(8,10)                 1.4307         -DE/DX =   -0.0001              !
! R10   R(8,12)                 1.4306         -DE/DX =    0.0                 !
! R11   R(9,11)                 1.4306         -DE/DX =    0.0                 !
! R12   R(9,12)                 1.4307         -DE/DX =   -0.0001              !
! A1    A(5,7,10)             118.5605         -DE/DX =    0.0                 !
! A2    A(5,7,11)             118.5554         -DE/DX =    0.0                 !
! A3    A(10,7,11)            122.884          -DE/DX =    0.0                 !
! A4    A(3,8,10)             118.5663         -DE/DX =    0.0                 !
! A5    A(3,8,12)             118.5598         -DE/DX =    0.0                 !
! A6    A(10,8,12)            122.8739         -DE/DX =    0.0                 !
! A7    A(1,9,11)             118.5621         -DE/DX =    0.0                 !
! A8    A(1,9,12)             118.5672         -DE/DX =    0.0                 !
! A9    A(11,9,12)            122.8707         -DE/DX =    0.0                 !
! A10   A(4,10,7)             121.4457         -DE/DX =    0.0                 !
! A11   A(4,10,8)             121.4367         -DE/DX =    0.0                 !
! A12   A(7,10,8)             117.1176         -DE/DX =    0.0                 !
! A13   A(6,11,7)             121.4339         -DE/DX =    0.0                 !
! A14   A(6,11,9)             121.4439         -DE/DX =    0.0                 !
! A15   A(7,11,9)             117.1222         -DE/DX =    0.0                 !
! A16   A(2,12,8)             121.437          -DE/DX =    0.0                 !
! A17   A(2,12,9)             121.4314         -DE/DX =    0.0                 !
! A18   A(8,12,9)             117.1316         -DE/DX =    0.0                 !
! D1    D(5,7,10,4)             0.0008         -DE/DX =    0.0                 !
! D2    D(5,7,10,8)           180.0            -DE/DX =    0.0                 !
! D3    D(11,7,10,4)         -179.9977         -DE/DX =    0.0                 !
! D4    D(11,7,10,8)            0.0015         -DE/DX =    0.0                 !
! D5    D(5,7,11,6)            -0.0006         -DE/DX =    0.0                 !
! D6    D(5,7,11,9)           179.9989         -DE/DX =    0.0                 !
! D7    D(10,7,11,6)          179.9979         -DE/DX =    0.0                 !
! D8    D(10,7,11,9)           -0.0026         -DE/DX =    0.0                 !
! D9    D(3,8,10,4)            -0.0012         -DE/DX =    0.0                 !
! D10   D(3,8,10,7)           179.9995         -DE/DX =    0.0                 !
! D11   D(12,8,10,4)          180.0002         -DE/DX =    0.0                 !
! D12   D(12,8,10,7)            0.0009         -DE/DX =    0.0                 !
! D13   D(3,8,12,2)             0.0011         -DE/DX =    0.0                 !
! D14   D(3,8,12,9)          -180.0008         -DE/DX =    0.0                 !
! D15   D(10,8,12,2)          179.9997         -DE/DX =    0.0                 !
! D16   D(10,8,12,9)           -0.0022         -DE/DX =    0.0                 !
! D17   D(1,9,11,6)             0.0011         -DE/DX =    0.0                 !
! D18   D(1,9,11,7)          -179.9984         -DE/DX =    0.0                 !
! D19   D(12,9,11,6)         -179.9993         -DE/DX =    0.0                 !
! D20   D(12,9,11,7)            0.0012         -DE/DX =    0.0                 !
! D21   D(1,9,12,2)            -0.0012         -DE/DX =    0.0                 !
! D22   D(1,9,12,8)           180.0007         -DE/DX =    0.0                 !
! D23   D(11,9,12,2)         -180.0008         -DE/DX =    0.0                 !
! D24   D(11,9,12,8)            0.0011         -DE/DX =    0.0                 !
--------------------------------------------------------------------------------
GradGradGradGradGradGradGradGradGradGradGradGradGradGradGradGradGradGrad
Frequency Analysis of Borazine
Here is the link to the frequency analysis results published on D-SpaceDOI:10042/22760
| File Name | logfile_Borazine_freq |
| File Type | .log |
| Calculation Type | FREQ |
| Calculation Method | RB3LYP |
| Basis Set | 6-31G(d,p) |
| E(RB3LYP) | -242.68459970au |
| RMS Gradient Norm | 0.00006951 au |
| Dipole Moment | 0.00D |
| Point Group | C1 |
| Job cpu time | 11 minutes 29.2 seconds |
The six low frequencies are very close to zero.This shows that optimised borazine is at an energy minimum. The table of frequencies are all shown to be positive.
Full mass-weighted force constant matrix:
 Low frequencies ---   -3.7752   -0.5872   -0.0008   -0.0003    0.0003    6.7655
 Low frequencies ---  289.6185  289.6922  404.1996
| Mode | Frequency cm-1 | Infrared | mode | Frequency cm-1 | Infrared |
| 1 | 290 | 0 | 16 | 1051 | 0 |
| 2 | 290 | 0 | 17 | 1081 | 0 |
| 3 | 404 | 24 | 18 | 1081 | 0 |
| 4 | 525 | 1 | 19 | 1245 | 0 |
| 5 | 525 | 1 | 20 | 1314 | 0 |
| 6 | 710 | 60 | 21 | 1400 | 11 |
| 7 | 710 | 0 | 22 | 1400 | 11 |
| 8 | 732 | 0 | 23 | 1492 | 494 |
| 9 | 864 | 0 | 24 | 1492 | 494 |
| 10 | 927 | 0 | 25 | 2642 | 284 |
| 11 | 927 | 0 | 26 | 2642 | 284 |
| 12 | 937 | 236 | 27 | 2652 | 0 |
| 13 | 944 | 0 | 28 | 3642 | 0 |
| 14 | 945 | 0 | 29 | 3644 | 40 |
| 15 | 1052 | 0 | 30 | 3644 | 40 |
MO Analysis of Borazine
Here is a link to the MO analysis calculations for borazine published on D-Space:DOI:10042/22759 The table provides a comparison between three selected MOs in benzene and borazine.
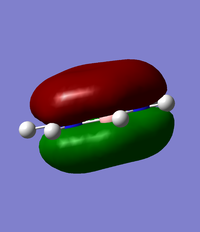 |
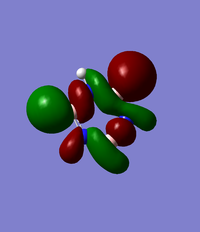 |
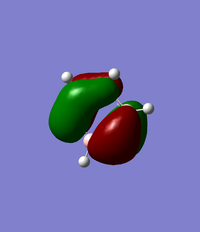 |
 |
 |
 |
Comparison of MO 17
The images of MO 17 are shown to be very similar for benzene and borazine. The size of the electron density above and below the plane of the ring are similar in both molecules. The energy of MO 17 is slightly higher in benzene at at -0.35998au compared to -0.36130au in borazine. This may be use to the present of nitrogen atoms which are more electronegative and lower in energy compared to the carbon atoms in benzene.
Comparison of MO 18 There is little similarity in the images for MO 18 for borazine and benzene. The distribution of the MO across the borazine is influenced by the electronegativity of the atom. The electron density is larger near the boron atoms compared to the nitrogen atoms, since boron has a greater contribution to high energy bonding interactions since it's less electronegative and higher in energy than nitrogen. Contrastingly, in benzene the electron density distribution of the MOs is distributed evenly between the C-C bonds and C-H bonds.Since borazine contains boron atoms,which are less electronegative and higher in energy compared to carbon, MO 18 in borazine is higher in energy at -0.31994 au compared to -0.33963au in benzene.
Comparison of MO 20
There is an equal distribution of electron density across the molecule in benzene. However for borazine, the electron density distribution is uneven. Half of the molecule containing two nitrogen atoms and one boron atom has a greater electron cloud surrounding compared the other half containing two boron atoms and one nitrogen atom. This shows that nitrogen has a greater influence in this pi bonding interaction.
Influence on full MO diagram
The MO diagram of Borazine will have changes in degeneracy. However, it will not have a significant loss in degeneracy compared to pyridinium and boratazene, since the molecule is symmetrical in all x,y and z planes.
NBO analysis of Borazine
The charge distribution for borazine ranges from -1.102 to +1.102. Nitrogen possess a greater negative charge of compared to boron with. This is because nitrogen is more electronegative compared to boron. Hence there is an alternation of positive and negative charge around the ring.
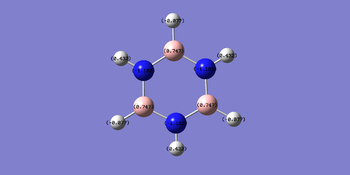
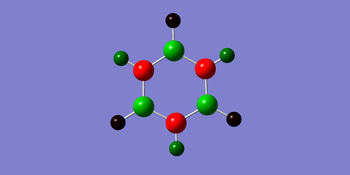
Final Comparison between series of benzene analogues
 |
 |
 |
 |
There is an even distribution of electron density in benzene since the ring is made up of all carbon atoms. In borazine, the constant alternation between nitrogen and boron atoms also creates an even distribution of electron density. However, in boratabenzene and pyridinium the electron density is not evenly distributed as a consequence of the substitution of a C-H unit with B-H and N-H respectively. In pyridinium the MO is distorted towards the N-H unit due the electron withdrawing ability of nitrogen, whiles in boratabenzene the MO is distorted away from the B-H unit, since carbon is more electronegative than boron.
 |
 |
 |
 |
 |
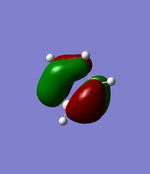 |
 |
 |
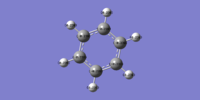 |
 |
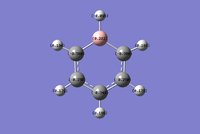 |
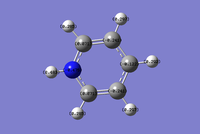 |
 |
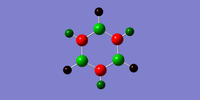 |
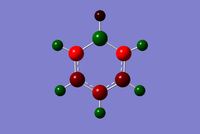 |
 |
By looking at the full series of benzene analogues, it's evident that charge distribution is strongly influenced by changes to the C-H unit in benzene. The distribution of charges across the atoms depends on the resonance images of the benzene analogues as well as the electronegativity/ electron withdrawing ability of the atoms. Benzene is shown to have an even distribution of negative charge across the carbon atoms and an even distribution of positive charge across the hydrogen atoms. Upon substitution of a C-H unit with a N-H unit or a B-H, the charge distribution changes as a consequence of changes in resonance and electronegativity in the molecule. In borazine the charge distribution alternates evenly between positive and negative charge due to alternating electronegativity between nitrogen and boron.
References
- ↑ Julius Glaser;Georg Johansson;Acta Chemica Scandinavica A 36(1982) 125-135.
- ↑ A. F. Holleman, Egon Wiberg, Nils Wiberg; Inorganic Chemistry, pg 1760
- ↑ Istvan Szabo, Csaba Fa bri, Ga bor Czako, Edit Ma tyus, and Attila G. Csa ́sza ́ŕ*;2012 ACS;4356−4362
- ↑ W. HARSHBARGER, G. LEE, R. F. PORTEII, ANP S. 13. BAUEK; Inorg. Chem., 1969, 8 (8), pp 1683–1689


