Rep:Mod:JakeHootonProject IonicLiquids
This project concerns the optimisation and analysis of organic cations (-onium ions) of the sort which might be used in an ionic liquid solvent.
-onium ions
Originally, NMe4+ was optimised immediately with the 6-31G(d)(p) basis set and then submitted for frequency analysis. When similar calculations were tried for PMe4+ and SMe3+, the calculations were taking too long and it was decided that 6-31G(d)(p) was not a suitable starting basis set. PMe4+ was then optimised with the pseudo-potential basis set LANL2DZ, however I was advised this was not the correct procedure for the project. I then decided that, in order to save time, a simple optimisation with the 3-21G basis set would be necessary for each of these molecules, before higher-level 6-31G(d)(p) optimisations.
The ions PMe4+, and SMe3+, were constructed in Gaussview, first optimised with the 3-21G basis set (DFT, B3LYP), then further optimised with the 6-31G(d)(p) basis set, and finally submitted for a frequency calculation. For the frequency calculations, by observing the item tables, it was found for SMe3+ that the maximum displacement had not converged, and for PMe4+ that neither the maximum displacement nor the RMS displacement had converged. Therefore the 6-31G(d)(p) calculations were refined and repeated. The original log files from the 3-21G calculations were optimised again with the 6-31G(d)(p) basis set, this time with the keywords int=ultrafine and scf=conver=9. These files were then submitted for frequency calculations; for SMe3+ this strategy worked and everything had converged even in the frequency calculation log file, however for PMe4+ the maximum displacement had still not converged. I then optimised PMe4+ again with the additional opt=tight keyword, the calculation took 1hr 18min and then failed - Gaussian showed the warning message 'Link Died!'. During this time I also sought help from Tricia Hunt; I learned from her that for frequency analysis calculations, only the top two (force) criteria of the item table were of absolute importance concerning convergence, not the lower two (displacement) criteria. Therefore I could continue with the project and compare results. The calculations for NMe4+ were then repeated in a similar fashion to the PMe4+ and SMe3+ molecules, so that the calculations were comparable. Omitting the 3-21G optimisations, the 6-31G(d)(p) optimisations with keywords, and the following frequency calculations are shown below.
Another point of note is that originally, the SMe3+ calculations failed mid-calculation, with Gaussian reporting an error ("Link Died!"). This was probably due to the fact that, since Gaussview did not provide an 'all-single-bond' trigonal planar fragment for the sulphur atom, I had built and edited the molecule around the trigonal planar BH3 fragment. Boron is a smaller atom than sulphur and therefore the starting bond lengths will have been much too small. I then built and edited the molecule about a trigonal planar phosphorus fragment - phosphorous is an atom similar in size to sulphur and therefore the starting bond lengths will have been more accurate lengths from which to start an optimisation. Indeed with the repeated calculation, the optimisation proceeded without problems.
A charge of +1 and a singlet spin state were applied to each of these molecules before the calculations.
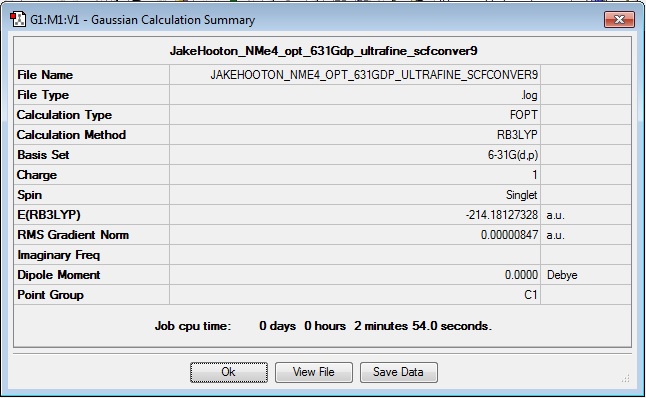
NMe4+
Optimisation
Log file: Media:JAKEHOOTON_NME4_OPT_631GDP_ULTRAFINE_SCFCONVER9.LOG
Results Summary:
Item Table:
Item Value Threshold Converged?
Maximum Force 0.000019 0.000450 YES
RMS Force 0.000006 0.000300 YES
Maximum Displacement 0.000948 0.001800 YES
RMS Displacement 0.000235 0.001200 YES
Predicted change in Energy=-1.234870D-08
Optimization completed.
-- Stationary point found.
Frequency
Log file: Media:JAKEHOOTON_NME4_FREQ_631GDP_ULTRAFINE_SCFCONVER9.LOG
Results Summary:
Item Table:
 Item Value Threshold Converged?
Maximum Force 0.000017 0.000450 YES
RMS Force 0.000008 0.000300 YES
Maximum Displacement 0.001034 0.001800 YES
RMS Displacement 0.000367 0.001200 YES
Predicted change in Energy=-1.773474D-08
Optimization completed.
-- Stationary point found.
Low Frequencies:
Low frequencies --- -5.8426 -0.0009 -0.0004 0.0006 4.7330 5.2553
Low frequencies --- 183.5025 288.6984 289.1320
PMe4+
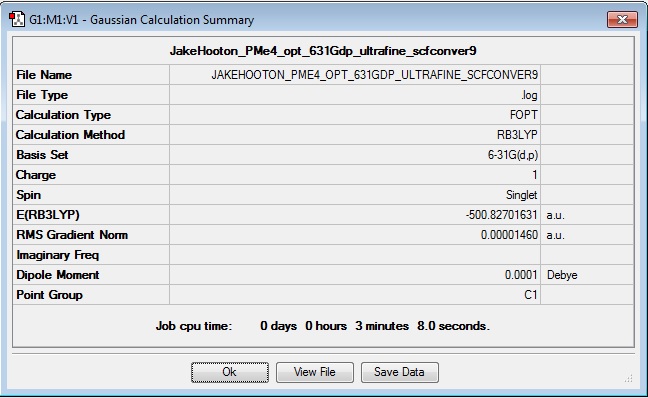
Optimisation
Log file: Media:JAKEHOOTON_PME4_OPT_631GDP_ULTRAFINE_SCFCONVER9.LOG
Results Summary:
Item Table:
 Item Value Threshold Converged?
Maximum Force 0.000063 0.000450 YES
RMS Force 0.000017 0.000300 YES
Maximum Displacement 0.001128 0.001800 YES
RMS Displacement 0.000415 0.001200 YES
Predicted change in Energy=-7.378108D-08
Optimization completed.
-- Stationary point found.
Frequency
Log file: Media:JAKEHOOTON_PME4_FREQ_631GDP_ULTRAFINE_SCFCONVER9.LOG
Results Summary:
Item Table:
Item Value Threshold Converged?
Maximum Force 0.000030 0.000450 YES
RMS Force 0.000015 0.000300 YES
Maximum Displacement 0.002107 0.001800 NO
RMS Displacement 0.000856 0.001200 YES
Predicted change in Energy=-8.400439D-08
Low Frequencies:
Low frequencies --- -2.3169 -0.0024 -0.0016 -0.0011 7.3269 17.1786
Low frequencies --- 156.8757 192.1795 192.4230
SMe3+
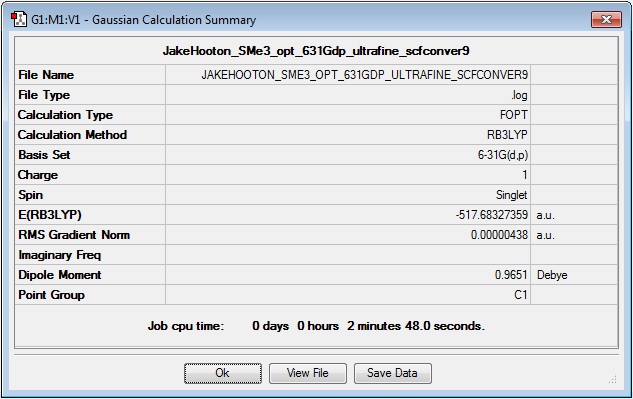
Optimisation
Log file: Media:JAKEHOOTON_SME3_OPT_631GDP_ULTRAFINE_SCFCONVER9.LOG
Results Summary:
Item Table:
 Item Value Threshold Converged?
Maximum Force 0.000013 0.000450 YES
RMS Force 0.000004 0.000300 YES
Maximum Displacement 0.000876 0.001800 YES
RMS Displacement 0.000307 0.001200 YES
Predicted change in Energy=-6.083938D-09
Optimization completed.
-- Stationary point found.
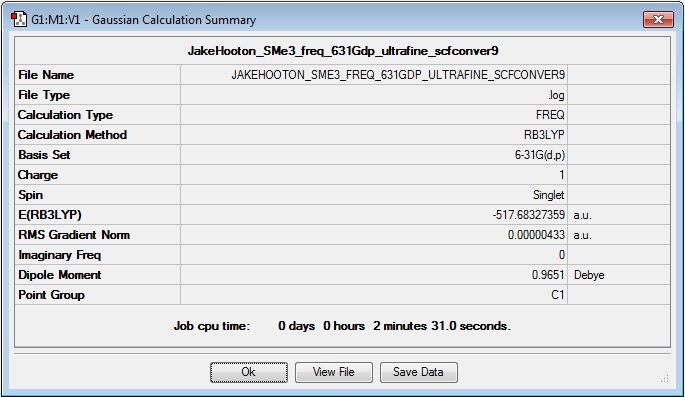
Frequency
Log file: Media:JAKEHOOTON_SME3_FREQ_631GDP_ULTRAFINE_SCFCONVER9.LOG
Results Summary:
Item Table:
Item Value Threshold Converged?
Maximum Force 0.000013 0.000450 YES
RMS Force 0.000004 0.000300 YES
Maximum Displacement 0.001220 0.001800 YES
RMS Displacement 0.000503 0.001200 YES
Predicted change in Energy=-1.101742D-08
Optimization completed.
-- Stationary point found.
Low Frequencies:
Low frequencies --- -9.4139 -3.5890 -0.0042 -0.0042 0.0022 3.4324
Low frequencies --- 162.1354 199.5415 199.7929
Comparison of Structures
| Compound | C-(Central Atom)-C Bond Angle / ° | C-(Central Atom) Bond Length / Å | H-C-H Bond Angle / ° | C-H Bond Length / Å | H-C-(Central Atom) Bond Angle / ° |
|---|---|---|---|---|---|
| NMe4+ | 109.5 | 1.53 | 110.4 | 1.09 | 110.4 |
| PMe4+ | 109.5 | 1.87 | 109.7 | 1.09 | 109.3 |
| SMe3+ | 100.5 | 1.91 | 110.9 (for six H facing LP) | 1.09 | 106.2 (for six H facing LP) |
| 112.3 (for 3 H pointing away from LP) | 108.7 (for 3H pointing away from LP) |
The tetramethylammonium and tetramethylphosphonium ions are both tetrahedral about the central heteroatom, whereas the SMe3+ ion has a trigonal pyramidal structure due to the presence of a lone pair around sulphur (sulphur is group 16 whereas P and N are group 15, therefore sulphur has one more electron and forms alkyl cations with one fewer R group and lone pair in its structure - the shapes are described here according to VSEPR theory). This is shown in the first column of the table, where the C-(Central Atom)-C bond angle is the typical tetrahedral angle (109.5°) for NMe4+ and PMe4+, but only 100.5° for SMe3+ - the 'pseudo-tetrahedral' angles between S-Me bonds are reduced slightly by repulsion from the LP, which occupies the final tetrahedral position. The LP-S-Me angles are correspondingly slightly larger.
A marked difference is visible in the C-(Central Atom) bond lengths from N -> P; this is well rationalised by drawing parallels with the trends in atomic radii in the periodic table. Atomic radii generally increase down a group (i.e. from N to P) due to electron shielding effects - P has one more full shell of electrons with the same principal atomic number, below its valence electrons, than does nitrogen. These shield the increased nuclear charge, so that with P, the valence electrons (on average) sit considerably further from the nucleus than in N. The increase in this bond length between the P-compound and the S-compound is much less pronounced. In fact, going by the previous argument, an increase is contrary to what we would expect since atomic radii typically decrease across a period (electrons added to the same valence shell are poor at shielding and do little to counter the increased nuclear charge). However, this change is small and a similar bond length would be what we would expect.
The methyl C-H bond lengths (fourth data column above) are all essentially the same between each compound - suggesting that the different central heteroatoms have no effect on this bond length. However, when considering the methyl H-C-H bond angles, some slight changes do become obvious. Whereas for the N-compound and the P-compound the groups around each carbon are all essentially unaltered from a tetrahedral arrangement, the arrangement is changed in the S-compound. Due to its overall trigonal bipyramidal structure, in the optimised conformation there are 2 hydrogens on each methyl group which face the lone pair, and one which points away. For the hydrogens which point away, the bond Hpoint away-C-Hface LP bond angle is almost 2 degrees larger than the Hface LP-C-Hface LP bond angle. Similarly the Hpoint away-C-(Central atom) bond angles are almost 2 degrees larger than the Hface LP-C-(Central atom) bond lengths. This is hard to explain geometrically - it suggests that the 'point away' hydrogens are pushed away slightly from the molecule's principal axis of symmetry (within the 'closed' face - opposite the LP), however examination of the intramolecular distance between each of these 'point away' hydrogens shows them to be 2.65 Å, which would typically indicate attraction through Van der Waals/London dispersion forces. What is obvious though is that all the hydrogens on each methyl group in the S-compound sit slightly closer to the central atom and slighly further away from each other (in terms of bond angles) than in the N- and P-compounds.
MO Analysis
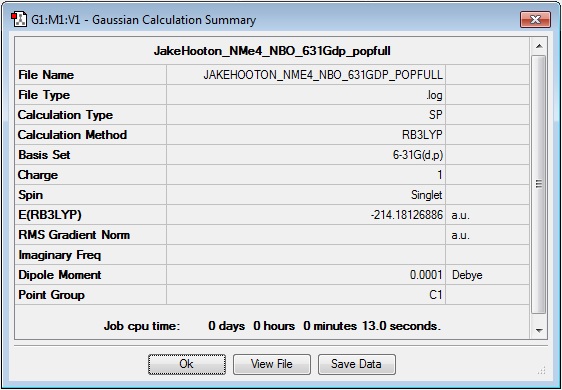
The optimised -onium ions were then submitted for a full NBO and MO analysis. The results are presented below.
NMe4+
Log file: Media:JAKEHOOTON_NME4_NBO_631GDP_POPFULL.LOG
Results Summary:
MO Analysis
I have chosen to animate 7 MOs since in order to give a better illustration of bonding in this molecule.
PMe4+
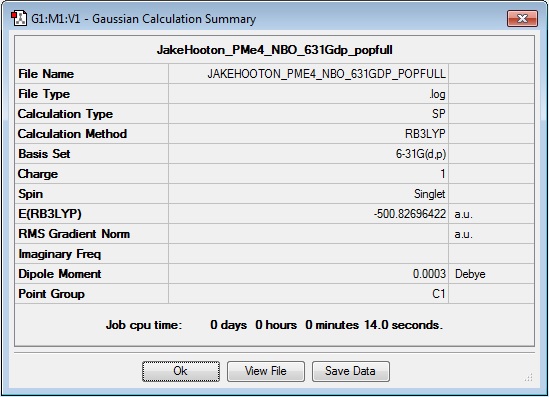
MO and NBO calculation log file: Media:JAKEHOOTON_PME4_NBO_631GDP_POPFULL.LOG
Results Summary:
SMe3+
MO and NBO calculation log file: Media:JAKEHOOTON_SME3_NBO_631GDP_POPFULL.LOG
Results Summary:
Comparison of NBO analysis between the three ions
Tabulated numerical values for the charge distribution
Below, the numerical values for the charge distributions across these atoms are given in a table, in terms of the elementary charge, e = 1.60×10⁻¹⁹ C. A visual representation is provided under the following subheading.
| Type of nucleus | NMe4+ | PMe4+ | SMe3+ |
|---|---|---|---|
| Central Atom | -0.295 (N) | +1.667 (P) | +0.917 (S) |
| Carbon | -0.483 | -1.060 | -0.846 |
| Hydrogen | +0.269 | +0.289 | +0.279 |
Comment:
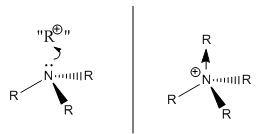
The results here show data that for NMe4+ is initially surprising - the central nitrogen atom harbours a negative charge, not a positive one. This is different from the formal, well known picture of the bonding in such ammonium ions, shown in the picture the right. In the formal picture, the tetraalkylammonium ion is built from a trialkyl ammonia molecule donating its lone pair of electrons to a hypothetical "R+" molecular fragment, therefore forming a dative covalent bond (shown in the picture by a bond with an arrowhead) and leaving a formal (single) positive charge residing on the Nitrogen.
The NBO charge distribution analysis shows that in actual fact both the nitrogen and the four methyl carbons stabilise some negative charge (more so on the carbons than the nitrogen) and that the positive charge on this ion resides with the the twelve methyl hydrogens on the outer part of the molecule.
Upon further consideration, this picture seems entirely sensible, since the MOs which were analysed earlier showed a high degree of delocalisation across the molecule, spreading the electron density around. It should also be considered that nitrogen is a highly electronegative element, and hydrogen is highly electropositive with respect to carbon, therefore nitrogen would naturally harbour the negative charge and hydrogen the positive charge. Therefore, it can be concluded that the formal picture of the bonding in the tetramethyl ammonium ion is inadequate for this level of analysis, since it has given wrong information. The computational analysis has revealed the true picture!
Bearing in mind this information with respect to this ion's use in ionic liquids, the situation is good, since positive charge spread around the large outer surface of the cation is what is needed to form an ionic liquid at room temperature - bulky delocalised cations which lead to a weaker interaction with their anion counterparts.
Tabulated visual representations of the charge distribution
Below, visual representations are provided in a table to show the charge distribution across each molecule. The first row shows the charge distributions within a range suitable for each molecule, ideal for visualising the charge distribution between individual atoms. The second row shows pictures with the colour range of charge distributions normalised the compound with the largest boundaries, i.e. PMe4+, ±1.667 e. These pictures are provided in order to better visualise the differences in overall charge distribution across each molecule.
Further Comment: By observing both the numerical values and the visualisations for the charge distributions, comparisons can be made between these three cations. The first thing to note is that for all three cations, the twelve outer methyl protons harbour approximately the same level of positive charge density (approximately +2.8 e). Differences arise when the distribution of charge across the central atom and methyl carbons in the inner part of the molecules is considered. The most highly polarised structure is that of the PMe4+ molecule, which stabilises a high magnitude of positive charge (+1.7 e) on the central P atom and a similar magnitude of negative charge on the methyl carbons (+1.1 e). For SMe3+, the qualitative distribution is similar but, lesser in magnitude (+0.9 e on sulphur and -0.8 e on the methyl carbons). In high contrast and as discussed earlier, the qualitative charge distribution on NMe4+ is different, with negative charge stabilised both the central atom and methyl carbons. The magnitude of polarisation of charge across NMe4+ is also very low compared with that across the PMe4+ and SMe3+ cations, which is obvious from the 'normalised' charge distributions on the second row of the visualisations table - the distribution is almost non-existent compared with that across the PMe4+ ion!
The difference in qualitative structure is rationalised by considering nitrogen's high Pauling electronegativity (3.04) with respect to phosphorus (2.19) and sulphur (2.58)[1]. The quantitative differences between the amount of positive charge stabilised on phosphorus and sulphur can again be rationalised by considering that phosphorus (2.19) is more electropositive than sulphur (2.58)(and the MOs for these structures are highly delocalised, allowing much electron movement).
Contributions of the C and heteroatom to the C-X bond
N-C
4. (1.98452) BD ( 1) C 1 - N 17
( 33.65%) 0.5801* C 1 s( 20.78%)p 3.81( 79.06%)d 0.01( 0.16%)
0.0003 0.4552 -0.0237 0.0026 -0.7024
-0.0298 0.2338 0.0099 0.4910 0.0208
-0.0146 -0.0307 0.0102 0.0195 -0.0017
( 66.35%) 0.8146* N 17 s( 25.00%)p 3.00( 74.97%)d 0.00( 0.03%)
0.0000 0.5000 -0.0007 0.0000 0.6846
-0.0001 -0.2279 0.0000 -0.4786 0.0001
-0.0064 -0.0135 0.0045 0.0086 -0.0007
P-C
4. (1.98031) BD ( 1) C 1 - P 17
( 59.58%) 0.7719* C 1 s( 25.24%)p 2.96( 74.68%)d 0.00( 0.08%)
-0.0002 -0.5021 -0.0171 0.0020 0.6229
-0.0114 0.5203 -0.0095 0.2962 -0.0054
-0.0218 -0.0124 -0.0104 -0.0040 0.0094
( 40.42%) 0.6358* P 17 s( 25.00%)p 2.97( 74.15%)d 0.03( 0.85%)
0.0000 -0.0001 -0.5000 0.0008 0.0000
0.0000 -0.6208 0.0009 0.0000 -0.5185
0.0007 0.0000 -0.2952 0.0004 -0.0694
-0.0395 -0.0330 -0.0126 0.0299
S-C
4. (1.98631) BD ( 1) C 1 - S 13
( 48.67%) 0.6976* C 1 s( 19.71%)p 4.07( 80.16%)d 0.01( 0.14%)
-0.0003 -0.4437 -0.0140 0.0033 0.7072
-0.0055 -0.4114 0.0032 0.3634 0.0098
0.0231 -0.0208 0.0121 -0.0131 0.0096
( 51.33%) 0.7164* S 13 s( 16.95%)p 4.86( 82.42%)d 0.04( 0.63%)
0.0000 -0.0001 -0.4117 0.0076 -0.0012
0.0000 -0.7017 0.0309 0.0000 0.4082
-0.0180 0.0000 -0.4039 -0.0260 0.0430
-0.0536 0.0312 -0.0244 0.0051
From these data it is obvious that for both NMe4+ and PMe4+, that both the central atom and the methyl carbons bond with an sp3 hybridised orbital (from the 25% s-character and 75% p character data). For PMe4+, the central atom makes a greater contribution to the C-X bond than for NMe4+ (60%, compared with 34%). This can again be explained by the fact that nitrogen is more electronegative than phosphorus, it will therefore hold on to its electrons more tightly and contribute less to the C-X bond.
SMe3+ does not show such a clear structure of sp3 hybridised orbitals; the percentages are skewed. It is an intermediate case where contributions from sulphur and carbon to the C-X bond are approximately equal. Again this can be rationalised due to the similar pauling electronegativities of the two elements (both about 2.5).
Influence of Functional Groups
[N(CH3)3(CH2OH)]+ and [N(CH3)3(CH2CN)]+ were analysed in a similar way to the first three cations.
[N(CH3)3(CH2OH)]+
Optimisation
Log file:Media:JH_ALCOHOLFUNCTIONALISED_OPT_631GDP_ULTRAFINE_SCFCONVER9.LOG
Results Summary:
Item Table:
 Item Value Threshold Converged?
Maximum Force 0.000059 0.000450 YES
RMS Force 0.000007 0.000300 YES
Maximum Displacement 0.000669 0.001800 YES
RMS Displacement 0.000154 0.001200 YES
Predicted change in Energy=-1.803887D-08
Optimization completed.
-- Stationary point found.
Frequency
Log file: Media:JH_ALCOHOLFUNCTIONALISED_FREQ_631GDP_ULTRAFINE_SCFCONVER9.LOG
Results Summary:
Item Table:
Item Value Threshold Converged?
Maximum Force 0.000070 0.000450 YES
RMS Force 0.000017 0.000300 YES
Maximum Displacement 0.000673 0.001800 YES
RMS Displacement 0.000221 0.001200 YES
Predicted change in Energy=-2.483545D-08
Optimization completed.
-- Stationary point found.
Low frequencies:
Low frequencies --- -8.8904 -4.6962 -0.0012 0.0005 0.0006 2.4469
Low frequencies --- 131.0428 213.4557 255.6207
[N(CH3)3(CH2CN)]+
Optimisation
Log file: Media:JAKEHOOTON_NITRILEFUNCTIONALISED_OPT_631GDP_ULTRAFINE_SCFCONVER9.LOG
Results Summary:
Item Table:
 Item Value Threshold Converged?
Maximum Force 0.000006 0.000450 YES
RMS Force 0.000002 0.000300 YES
Maximum Displacement 0.000326 0.001800 YES
RMS Displacement 0.000077 0.001200 YES
Predicted change in Energy=-1.464949D-09
Optimization completed.
-- Stationary point found.
Frequency
Log file: Media:JAKEHOOTON_NITRILEFUNCTIONALISED_FREQ_631GDP_ULTRAFINE_SCFCONVER9.LOG
Results Summary:
Item Table:
Item Value Threshold Converged?
Maximum Force 0.000011 0.000450 YES
RMS Force 0.000003 0.000300 YES
Maximum Displacement 0.000309 0.001800 YES
RMS Displacement 0.000092 0.001200 YES
Predicted change in Energy=-1.270724D-09
Optimization completed.
-- Stationary point found.
Low Frequencies:
Low frequencies --- -2.2604 -0.0006 -0.0003 0.0004 7.1270 9.6736
Low frequencies --- 91.7834 154.0362 210.9247
References
- ↑ Huheey, J.E. Inorganic Chemistry ; Harper & Row: New York, 1983

