Rep:Mod:JSInorganic
Week 1: Learning Chemical Simulations
Structure Optimisation
BH3
First I looked at the molecule BH3 to become familiar with GaussView 5.0. The molecule was set up with trigonal planar geometry with B-H bond lengths set as 1.53 angstroms, 1.54 angstroms and 1.55 angstroms. We can then optimise its geometry to find its equilibrium conformation (the geometry with the lowest energy). GaussView accomplishes this optimisation by repeating two types of calculation. First it runs an SCF calculation that solves the Schrödinger equation using the input nuclei positions to give electronic energies and densities for that configuration of nuclei. The OPT part of the calculation changes the positions of the nuclei, and the SCF part is repeated. Each cycle of the calculation moves the nuclei to a lower energy conformation until the lowest energy conformation is found. This is the conformation where any infinitesimal movement of any nucleus will raise the energy of the molecule.
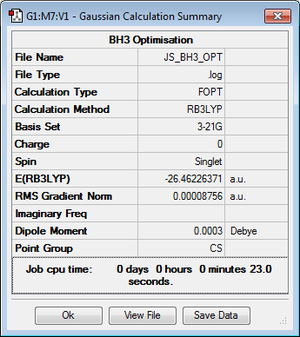
The BH3 molecule was optimised using an OPT calculation with the B3LYP method and 3-21G basis set. The data from the optimisation is given here:

The graphs on the left show how the energy and gradient change with each step of the optimisation.
The log file from the optimisation is here.
Information that tell us the molecule has been optimised can be found in this data. Towards the end of the log file is the convergence data (shown in the table above). This verifies that all parameters have converged. Further proof is that the root mean square (RMS) gradient is less than 0.001 (in this case it is 0.0008756).
The energy plot shows how the calculation moves the molecule's geometry stepwise down its potential energy surface (PES) to its lowest energy conformation. When this curve is flat the lowest energy conformation has been attained. This is reflected in the RMS gradient, which is close to zero by the end of the optimisation.
The final B-H bond lenths were 1.19445 angstroms, 1.19467 angstroms and 1.19479 angstroms. The final H-B-H bond angles were 119.985 degrees, 120.016 degrees and 119.999 degrees. The total energy of the molecule is -26.46226371 au.
However these are just output numbers from a program, and do not include associated error. Bond lengths are accurate to ~0.01 angstroms, bond angles are accurate to ~0.1 degrees and energies are accurate to ~0.001 au (or ~10 kJ mol-1). This will be the accuracy quoted from now on in discussion, however raw data will still have as many significant figures as the programme gives.
Basis Sets
The basis set determines how many functions are used during the optimisation. Using more complex functions allows more precise solutions at the cost of increased calculation time. Hence computational chemists are always having to find a compromise between accuracy and time!
We have used the basis set 3-21G to make a quick calculation to get an idea of the geometry of BH3 and get the bulk of the optimisation done. To further the optimisation of the molecule we can expand the basis set, in this case to 6-31G(d,p). The result of this is given below.
| Summary Data | Convergence | Jmol | |||
|---|---|---|---|---|---|

|
Item Value Threshold Converged? Maximum Force 0.000012 0.000450 YES RMS Force 0.000008 0.000300 YES Maximum Displacement 0.000064 0.001800 YES RMS Displacement 0.000039 0.001200 YES |
|
The log file from the job is given here.
The new B-H bond lengths are all 1.19 angstroms and the new H-B-H bond angles are 120.0 degrees. This matches experimental bond lengths of 1.19001 angstroms[1] to the limited accuracy we have.
The energy of the molecule is -26.615 au, which is 0.153 au (or 400 kJ mol-1) lower than that of the 3-21G optimisation. This may imply the calculation has found a geometry is lower in energy and therefore is a better calculation but we CANNOT draw that conclusion because the numbers were generated using different basis sets. If anything at all in the method is changed, or a different basis set or atoms are used, the calculated energies cannot be compared. However the total energy is a useful quantity to check against for others who are repeating the calculation.
Pseudo-potentials
GaBr3
This molecule of GaBr3 was run using an OPT calculation using the B3LYP method and the LanL2DZ basis set. The point group of the molecule was fixed to D3h prior to running the job. The LanL2DZ basis set runs different calculations of different atoms to better describe them. LanL2DZ uses D95V for first row atoms and Los Alamos ECP on heavier elements. This is a way of applying a pseudo-potential, and helps us to achieve better results by treating different atoms with different calculations (because after all, different elements have different properties!)
The results of the job are shown below.
| Summary Data | Convergence | Jmol | |||
|---|---|---|---|---|---|

|
Item Value Threshold Converged? Maximum Force 0.000000 0.000450 YES RMS Force 0.000000 0.000300 YES Maximum Displacement 0.000003 0.001800 YES RMS Displacement 0.000002 0.001200 YES |
|
The log file is here: DOI:10042/31182 . Bond lengths and angles have been put into the summary table below.
BBr3
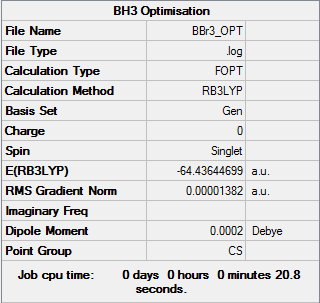
To optimise BBr3 we will use a mixture of basis sets and pseudo-potentials. An OPT calculation was run using the B3LYP method and the GEN basis set. The GEN basis set allows us to apply different basis sets for each atom manually. In the key words section of the job 'pseudo=read gfinput' was put in to allow us to apply different pseudo-potentials to each atom. For this molecule I assigned the B centre the normal 6-31G(d,p) basis set and to the Br atoms the LanL2DZ pseudo-potential basis set. The results of the job are given below.
| Summary Data | Convergence | Jmol | |||
|---|---|---|---|---|---|
|
Item Value Threshold Converged? Maximum Force 0.000028 0.000450 YES RMS Force 0.000012 0.000300 YES Maximum Displacement 0.000139 0.001800 YES RMS Displacement 0.000074 0.001200 YES |
|
The file is here: DOI:10042/31192 . Bond lengths and angles have been included in the summary table below. Note that while the Summary Data is titled BH3 this is just a title error made when running the calculation. The summary data is for BBr3.
Structure Comparison: BH3, GaBr3 & BBr3
| BH3 | GaBr3 | BBr3 | |
|---|---|---|---|
| r(E-X) / Angstroms | 1.19 | 2.35 | 1.93 |
| θ(X-E-X) / Degrees | 120.0 | 120.0 | 120.0 |
Ligand
Changing the ligand from hydrogen to bromine while keeping the boron centre constant increases the bond length, which implies that B-H bonds are stronger than B-Br bonds. The outermost orbital of hydrogen is much lower in energy than the outermost orbital of bromine, and puts the hydrogen 1s orbitals much closer to boron's orbitals. Furthermore, the outer orbitals of bromine are at n=4, which means they are more diffuse than the hydrogen 1s outer orbital. The combination of closer energy match and a denser outer orbital means B-H bonds are stronger than B-Br bonds, and hence have a shorter bond length. Another reason that the B-Br bond is longer is because bromine is a larger atom than hydrogen, so we would expect the bromine to sit further away from the boron in equilibrium.
Hydrogen and bromine are similar ligands in that they are both monovalent and monatomic ligands.
Central Atom
Changing the central atom from boron to gallium while keeping the bromine ligands constant increases the bond length. We may expect the Ga-Br bond to be shorter than the B-Br bond if we think about bond strength, since the outermost orbitals of gallium and bromine are closer in energy than the outermost orbitals of boron and bromine. However, because gallium and bromine are both large atoms, the large internuclear distance is longer than that between the small boron centre and bromine.
Gallium and boron are similar ligands in that they can both form trigonal planar compounds with the +3 oxidation state that tend to be Lewis acids. However the inert pair effect means gallium can also be monovalent with +1 oxidation state.
Bonds

What is a bond? As we become better equipped to probe the properties of molecules, the definition of a 'chemical bond' becomes more blurred. For example, the 'linear' alkane chain C17H36 is not linear but is in fact U-shaped. One explanation by Prof. Henry Rzepa is that the van der Waals attractions between the hydrogens has a strong cumulative effect.[2] These are not traditional covalent bonds, but have just as much importance in rationalising the structure of the molecule.
There are many ways to measure the strength of a bond. One is bond enthalpy, or the energy required to break the bond. The triple bond present in N2 is one of the strongest covalent bonds with a bond enthalpy of 945 kJ mol-1.[3] In contrast hydrogen bonds only have a bond enthalpy of ~15 kJ mol-1.[4] An example of of a bond enthalpy sitting in the middle is that of an alkyl C-H bond (410 kJ mol-1). [3]
Another way to measure the strength of a bond is by looking at the bond vibrations. Vibration energy is proportional to the force constant of the bond, so a higher vibration energy is associated with a stronger bond.
Sometimes Gaussview will not draw a formal bond line between two species, but this does not necessarily mean there is no bond. Because Gaussview is a computer program, it will define a bond by the distance between the two species i.e. if the internuclear distance is lower than some boundary, the program will label it as a bond. As humans we can use our judgement alongside the program results to work out where bonds are.
Frequency & Vibrational Analysis
Frequency analysis tells us the curvature of the PES (which turning points are energy maxima and which ones are energy minima). The analysis will predict IR and Raman vibration modes that we can compare with experimental data. For now we will use frequency analysis to prove our structures are minimum energy structures.
BH3 Frequency Analysis
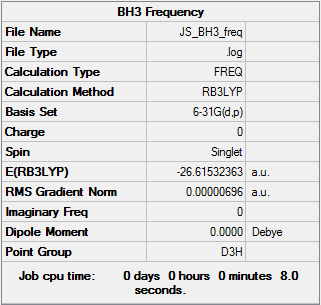
The molecule was set to have D3h symmetry and was treated with frequency analysis with the B3LYP method and the 6-31G(d,p) basis set.
| Summary Data | Low Modes |
|---|---|
|
Low frequencies --- -7.9073 -1.6385 -0.0054 0.6256 6.5697 6.7709 Low frequencies --- 1162.9662 1213.1623 1213.1650 |
The log file is here.
The total energy is only 0.00000003 au different from that calculated from the BH3 optimisation (-26.61532360 au), which means we have analysed the same structure. The first row of the low frequencies tells us how good the calculation is: the closer to zero these are the better the frequency analysis. These values are required to be below +/-15 cm-1, and these are all comfortably within that range. The second row of low frequencies are the lowest 'real' frequencies.
BH3 Vibrational Spectrum
| Wavenumber / cm-1 | Intensity | IR Active? | Vibration Type | 
|
|---|---|---|---|---|
| 1162 | 93 | Yes | Bend | |
| 1213 | 14 | Slightly | Bend | |
| 1213 | 14 | Slightly | Bend | |
| 2582 | 0 | No | Stretch | |
| 2716 | 126 | Yes | Stretch | |
| 2716 | 126 | Yes | Stretch |
Note that while wavenumbers have been quoted as whole numbers there is ~10 % error on them. There are 6 vibrational modes (as expected from 3N-6 vibrational modes from non-linear molecules), but only 3 peaks. The mode at 2582 cm-1 is not IR-active because all B-H bonds vibrate in phase, and so there is no change in dipole moment. The two bends at 1213 cm-1 are degenerate, which arises from the high symmetry of BH3. Because the bends are the same energy they will overlap to make one observable peak. The same is true for the two stretches at 2716 cm-1.
GaBr3 Frequency & Vibrational Analysis
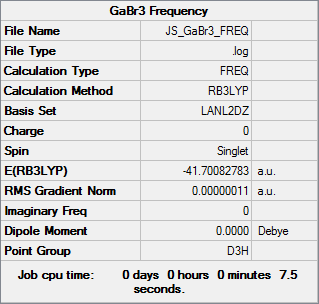
Frequencies of GaBr3 were calculated using the B3LYP method and LanL2DZ basis set as used in the optimisation earlier. The results are shown below.
| Summary Data | Low Modes |
|---|---|
|
Low frequencies --- -0.5252 -0.5247 -0.0024 -0.0010 0.0235 1.2010 Low frequencies --- 76.3744 76.3753 99.6982 |
The log file is given here: DOI:10042/31239 .
The vibration data from the calculation are given below.
| Wavenumber / cm-1 | Intensity | IR Active? | Vibration Type | 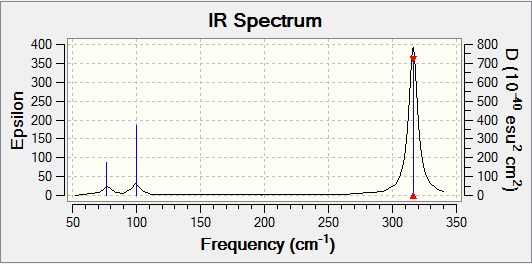
|
|---|---|---|---|---|
| 76 | 3 | Slightly | Bend | |
| 76 | 3 | Slightly | Bend | |
| 100 | 9 | Slightly | Bend | |
| 197 | 0 | No | Stretch | |
| 316 | 57 | Yes | Stretch | |
| 316 | 57 | Yes | Stretch |
Spectrum Comparison: BH3 & GaBr3
There has been a large shift of the whole spectrum for BH3 and GaBr3. This is due to GaBr3 being a much heavier molecule than BH3. Vibration frequency is inversely proportional to the square root of the mass, so a heavier molecule will have lower energy vibrations.
| BH3 wagging vibration | GaBr3 wagging vibration | BH3 scissoring vibration | BH3 rocking vibration |
|---|---|---|---|

|

|

|

|
Both spectra have 6 vibrational modes and 3 observed peaks, however the modes of vibration have rearranged. For BH3 the lowest energy vibration is the boron 'wagging' motion, fanning the molecule in and out like opening and closing an umbrella. The next lowest energy vibrations are two degenerate ones: one where two hydrogens scissor together symmetrically and another where all hydrogens rock backwards and forwards. All of those vibrations have been shown in pictures. For GaBr3, the doubly degenerate vibrations are lower in energy than the wagging vibration. This is likely to be a consequence of the molecule being heavier than BH3. All other modes of vibration are in the same order.
The frequency and intensity of this wagging vibration is much higher in BH3 than GaBr3. Because hydrogen is a light nucleus relative to the boron centre, the hydrogens can move with relatively little energy. This is reflected in the wagging vibration, where it is mainly the hydrogens that move with a high frequency. In contract, the bromine nuclei are more similar to the gallium nucleus mass (in fact bromine is heavier than gallium), so the displacement vectors show that it is mainly the gallium centre that moves during the wag, and with a much lower frequency.
Notes On Frequency & Vibration Analysis Theory
The same basis set and method must be used for both optimisation and frequency analysis is because different basis sets and methods will produce different optimised structures. If we used a different basis set or method for the frequency analysis, we would be analysing a structure that is not optimised for the new basis set and method, and hence our results will not be valid.
The frequency analysis tells us if the optimised structure is an energy minimum conformation. The optimisation calculation changes the molecular geometry along the PES until a turning point is found. However we don't know if this turning point is a maximum or a minimum. The frequency analysis verifies that the conformation sits at the PES minimum.
The low frequencies represent the motion of the centre of mass of the molecule, and should be much lower than the low 'real' frequencies calculated. The closer to zero all of the low frequencies are the less the centre of mass of the molecule is moving, which means our calculation has been more successful.
Calculating MOs
In carrying out these calculations, Gaussview has solved the electronic structure of the molecule and can show us its MOs. This can be demonstrated with BH3.
The energy calculation was run using the B3LYP method and the 6-31G basis set. The resultant file is here: DOI:10042/31250 .
Here are the predicted and calculated MOs. The predicted LCAO MO diagram has been used from the Hunt Research Group teaching page.[5]
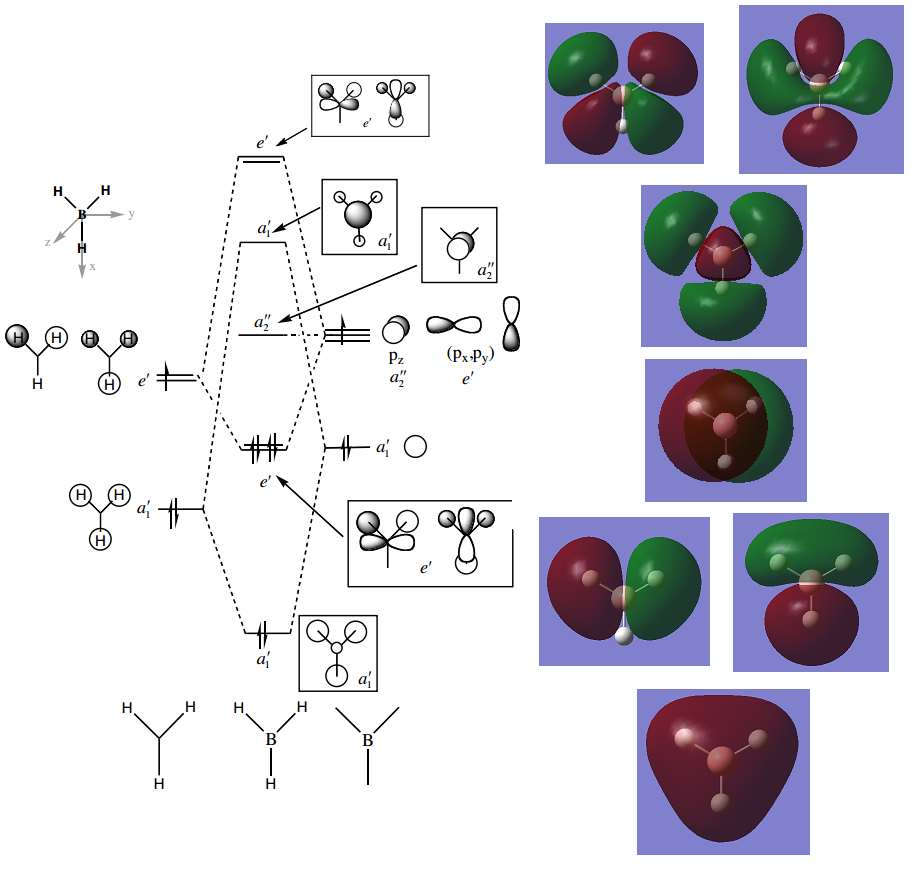
All occupied orbitals are very similar to those predicted by LCAO. The LUMO and LUMO+1 show good agreement with the LCAO predicted ones, but the orbital contributions and and sizes don't quite agree. But these are only small discrepancies, and shows that while LCAO isn't a quantitative prediction it is a good starting point for predicting the shapes of MOs and the ordering of MO energies.
Natural Bond Orbital Analysis
Next we will look at Natural Bonding Orbital (NBO) analysis. We will do this for ammonia, which first needs optimisation.
Structure Optimisation
First the point group of ammonia was set to C3v. Then an optimisation job was run using the B3LYP method and the 6-31G(d,p) basis set. The results are given below:
| Summary Data | Convergence | Jmol | |||
|---|---|---|---|---|---|

|
Item Value Threshold Converged? Maximum Force 0.000006 0.000450 YES RMS Force 0.000004 0.000300 YES Maximum Displacement 0.000012 0.001800 YES RMS Displacement 0.000008 0.001200 YES |
|
The log file can be found here. All parameters have converged so it is an optimised structure.
Frequency & Vibrational Analysis
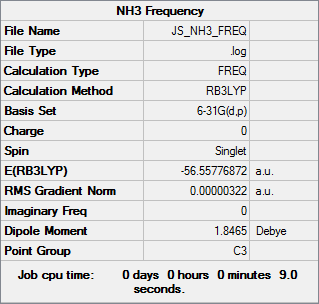
The frequency analysis was run using the same method and basis set as the optimisation (B3LYP and 6-31G(d,p)). The results are shown below.
| Summary Data | Low Modes |
|---|---|
|
Low frequencies --- -0.0138 -0.0026 -0.0009 7.0783 8.0932 8.0937 Low frequencies --- 1089.3840 1693.9368 1693.9368 |

The log file can be found here. All of the first row of the low frequencies are within the +/-15 cm-1 range and all of the second row low frequencies are positive. This means it is an energy minimum optimised structure.
MO Analysis
MO analysis was done using the B3LYP method and 6-31G(d,p). The resultant file is here: DOI:10042/31251 . The NBO analysis below is a part of the MO analysis that we will look at in more detail.
NBO Analysis
The NBO analysis has told us what the NBO charges of each atom in the molecule are. For ammonia this is -1.125 for the nitrogen and 0.375 for each of the hydrogens. This allows prediction of the molecule's electric dipole moment, which for ammonia is 1.85 D.
Association Energies
We can use total energy calculations to work out energy changes in a reaction. For example the energy change for the association of ammonia and borane to produce ammonia-borane is simply the total energies of ammonia and borane subtracted from the energy of ammonia-borane. We will calculate this energy change now.
NH3B3 Structure Optimisation & Frequency Analysis
First we need to calculate the total energy of ammonia-borane, and to do this we need an optimised structure. Optimisation and frequency analysis were done using the B3LYP method and the 6-31G(d,p) basis set.
| Summary Data | Convergence | Jmol | |||
|---|---|---|---|---|---|

|
Item Value Threshold Converged? Maximum Force 0.000002 0.000015 YES RMS Force 0.000001 0.000010 YES Maximum Displacement 0.000023 0.000060 YES RMS Displacement 0.000010 0.000040 YES |
|
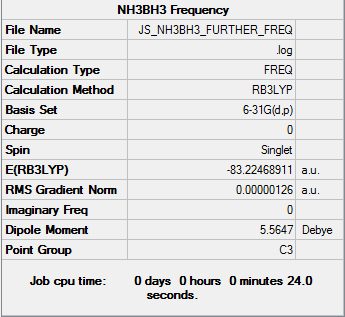
The log file can be found here. The frequency analysis is given below.
| Summary Data | Low Modes |
|---|---|
|
Low frequencies --- -5.6946 -0.3194 -0.0466 0.0012 1.1622 1.2379 Low frequencies --- 263.2815 632.9623 638.4593 |
The log file can be found here. Here is a summary of all the total energies of BH3, NH3 and NH3BH3, as well as the energy change of association:
| E(BH3) / au | E(NH3) / au | E(NH3BH3) / au | ΔE / au | ΔE / kJ mol-1 |
|---|---|---|---|---|
| -26.615 | -56.558 | -83.225 | -0.052 | -137 |
Because we know the total energy of the reactants and the total energy of the product, we can work out the associated energy change provided we use the same method and basis sets, which we have.
With a bond energy of 137 kJ mol-1 the N-B bond is relatively weak, since it is substantially smaller than an alkyl C-H bond (bond energy 410 kJ mol-1 [3]). However it is stronger than what we might call an intermolecular attraction, like a hydrogen bond (bond energy ~15 kJ mol-1 [4]), so we can think of the N-B interaction as strong enough to be a 'bond'.
Week 2: Co-ordination Chemistry Mini-Project
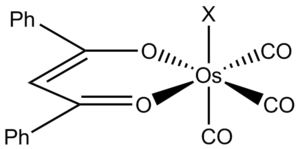
For my mini-project I have chosen to look at co-ordination chemistry. I will study the luminescent complex [Os(CO)3(dbm)X] (shown to the right), where X is a variable ligand and dbm is the bidentate ligand shown in the diagram. [6]
Through studying the geometry and MOs of transition metal complexes we can look at some of the metal-ligand interactions from the basic, low energy σ-skeleton of the complex up to the higher energy π-systems. We can also study the trans effect of ligands by looking at the vibrational frequencies of coordinated carbonyl ligands. NBO analysis can calculate the charge distribution on such complexes. Finally I will be optimising a structure and comparing it with experimentally determined bond lengths and angles.
X = CO

To get a starting point for the optimised structure, I started by keeping all monodentate ligands the same. This will also give a standard for vibration analysis of the CO bond and for the complex MOs.
To simplify the calculation the phenyl groups on the dbm ligand were replaced with chlorine atoms. The calculations were run using the B3LYP method with the LanL2DZ basis set for the Os and Cl atoms and the 6-31G(d,p) basis set for the C, O and H atoms. The optimisation results are given below:
| Summary Data | Convergence | Jmol | |||
|---|---|---|---|---|---|

|
Item Value Threshold Converged? Maximum Force 0.000002 0.000015 YES RMS Force 0.000000 0.000010 YES Maximum Displacement 0.000029 0.000060 YES RMS Displacement 0.000008 0.000040 YES |
|
| Bond | Bond Length / Angstroms |
|---|---|
| Os-O | 2.12 |
| Os-C (equatorial) | 1.95 |
| Os-C (axial) | 2.01 |
| Axial C-O | 1.13 |
| Equatorial C-O | 1.14 |
| Bond | Bond Angle / Degrees |
|---|---|
| O-Os-O | 87.5 |
| C-Os-C (both equatorial) | 93.1 |
| C-Os-C (both axial) | 174.7 |
| O-Os-C (equatorial) | 89.7 |
| O-Os-C (axial) | 88.1 |
| dbm C-C-O | 129.7 |

The log file can be found here: DOI:10042/31303 . We might have expected an octahedral geometry around the Os metal, but the bidentate dbm ligand has broken the octahedral symmetry of the molecule. This has also caused a distortion in the axial carbonyl ligands, which have bent towards the dbm slightly. Some bond lengths and angles are given to the right.
To explain these changes we need to look at the backbonding effect. The carbonyl ligand has low-energy vacant π* orbitals that can accept electron density from a filled orbital of correct symmetry on the osmium. This increases the Os-C bond order and decreases the C-O bond order. Another variable that affects this is the type of ligand trans to the one we are studying.
The axial carbonyl ligands are trans to another carbonyl ligand. This means the carbonyl is trans to an equally good π-acceptor and has a Os-C bond length of 2.01 Angstroms. The equatorial carbonyls however are trans to sp2 oxygen donors, which are generally neither good π-acceptors nor good π-donors. Because they are not as effective π-acceptors, more electron density remains on the metal, so there is more electron density to backbond into the trans C-O π* orbital. This increases the Os-C bond order for equatorial ligands, and this is reflected in the data. The lesser degree of backbonding means that the Os-O bond order is the lowest, which leads to it having the longest bond.
But that might not be the only effect in play. The optimum geometry of the molecule is octahedral, but the bidentate dbm ligand cannot reach an octahedral geometry because the oxygen donors are linked by a rigid sp2 carbon backbone. Still, the ligand geometry has been significantly distorted, as the C-C-O bond angle is ~10 degrees larger than the optimum sp2 bond angle of 120 degrees.
Perhaps the most puzzling observation is the bent axial ligands. We can try to rationalise this when looking at the MOs.
Frequency & Vibration Analysis
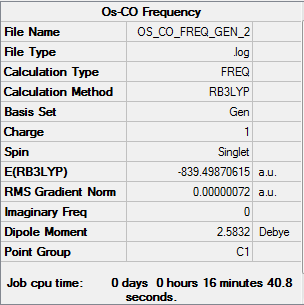
The frequency analysis is given below, and was run using the B3LYP method and the same basis set as the optimisation.
| Summary Data | Low Modes |
|---|---|
|
Low frequencies --- -4.7328 -0.0003 0.0002 0.0005 2.0246 7.8170 Low frequencies --- 41.3807 43.5815 69.2137 |
The resulting log file can be found here: DOI:10042/31304 .
The optimisation data says that all parameters have converged and the frequency analysis verifies that this is a minimum point on the PES.
I have chosen to analyse just the carbonyl stretches to look at the effect of trans ligand substitution later.
| Wavenumber / cm-1 | Intensity | IR Active? | Vibration Description | Vibration Image |
|---|---|---|---|---|
| 2185 | 609 | Yes | Equatorial CO asymmetric stretches | 
|
| 2209 | 406 | Yes | Axial CO symmetric stretch out of phase to equatorial CO symmetric stretch | 
|
| 2213 | 846 | Yes | Axial CO asymmetric stretch | 
|
| 2278 | 76 | Yes | All CO stretching in phase with small Os-O stretches between the osmium and dbm ligand | 
|
A comparison of these vibrational modes will be given later after substituting an axial ligand. The predicted IR spectrum is given below.
MO Analysis
I have selected some of the key MOs in the complex (or sometimes the more illustrative ones) for analysis. The file from the MO analysis is here: DOI:10042/31374 . The MO calculation was run using the B3LYP method and the same basis set as the optimisation and frequency analysis.
| Energy Level Number | Calculated MO | LCAO Approximation | Orbital Energy / au | Bonding Character |
|---|---|---|---|---|
| Axis Definition | 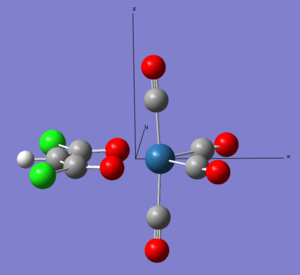 |
 |
n/a | n/a |
| 61 (LUMO) |  |
 |
-0.265 | Bonding interaction between Os dxy and all carbonyl π* antibonding orbitals.
Antibonding σ-interaction between Os dxy and dbm O sp2 lobes. Through-space π-bonding between axial C-O π* orbitals. |
| 60 (HOMO) |  |
 |
-0.412 | Conjugated π-bonding between carbons of the dbm ligand. π-antibonding between both C-Cl and both dbm C-O.
Little Os interaction with ligands. |
| 55 |  |
 |
-0.477 | Reasonable π-bonding between Os dx2-y2 and equatorial carbonyl C-O π* antibonding orbitals, with some through-space bonding between the equatorial carbonyl carbons.
Antibonding between Os dx2-y2 and dbm O-C π-orbital. |
| 53 |  |
 |
-0.507 | π-bonding from Os dyz to all carbonyl ligand C-O π* orbitals.
Contribution from C-Cl π-bonding orbitals. |
| 52 |  |
 |
-0.513 | Good π-bonding from Os dxz to all carbonyl ligand C-O π* orbitals.
Weaker π-bonding from Os dxz to dbm O p-orbitals. Conjugated π-bonding on dbm Cl-C-C-C-Cl. |
| 49 |  |
 |
-0.597 | Os dyz π-bonds to dbm conjugated π-system. |
| 44 |  |
 |
-0.650 | All carbonyl C-O π-bonding orbitals |
| 39 |  |
 |
-0.674 | C-O π orbitals overlap with highly conjugated bonding system in dbm ligand. |
| 37 |  |
 |
-0.680 | π-bonding between Os dyz and all carbonyl C-O π-bonds. |
| 34 |  |
 |
-0.711 | σ-bonding between Os dz2 and all axial C-O σ bonds. |
| 33 |  |
 |
-0.712 | σ-bonding between Os dxy and all equatorial carbonyl C-O σ-bonds.
σ-bonding between Os dxy and dbm O-C σ-bonds. |
| 29 |  |
 |
-0.784 | σ-bonding between Os dz2 and all carbonyl C-O σ* antibonding orbitals.
σ-bonding between Os dx2 and dbm O-C σ-bonds. |
| 27 |  |
 |
-0.822 | σ-bonding between Os s orbital and all carbonyl C-O σ* antibonding orbitals.
σ-bonding between Os s orbital and dbm O-C σ-bonds. |
| 20 |  |
 |
-1.339 | Equatorial carbonyl C-O σ-bonding. |
| 18 |  |
 |
-1.359 | Axial carbonyl C-O σ-bonding. |
We can see that the σ-interactions are generally lower in energy than the π-interactions, which is what we would expect since σ-interactions involve more direct orbital overlap than π-interactions. We get some nice π-overlap between C-O π-bonds and metal d-orbitals to give a high degree of conjugation around the molecule, like in energy level 37. The higher energy MOs include the π-overlap from filled metal d-orbitals to empty π* C-O antibonding orbitals, observing the backbonding overlap.
We see hints in some orbitals regarding the distorted axial ligands. Energy level 39 shows a bonding interaction between the C-O π orbital and a highly conjugated orbital of the dbm ligand. Since the ligands are quite far apart this overlap is small, but it is enough to have an effect on the geometry.
NBO Analysis

The diagram shows the NBO analysis of the complex from the MO calculation. The carbonyl ligands follow the polarity we would expect from electronegativities: a δ+ carbon with a δ- oxygen. The oxygens on the dbm ligand also have a δ- charge since the resonance forms of the ligand place negative charge on the oxygens. The central carbon of the dbm ligand has a δ- charge because it is part of an electron-rich conjugated π system. However the other carbons in the ligand have a δ+ charge, which is probably due to being attached to two electronegative groups (O and Cl).
Strangely the Os has a high negative charge on it. This is not a metallic property! We can rationalise this by thinking of where electron density is on the metal. Firstly, the osmium is in a low oxidation state (+2). Also we have 4 L-type ligands (the carbonyls) that donate 2 electrons to the metal centre as part of the σ-donation. The dbm ligand is a XL-type ligand (one oxygen donates in 2 electrons, the other 1 electron). So overall there is quite a lot of electron density moving onto the metal, increasing the electron density there. The π-backbonding to the carbonyl ligands will counter this to some degree. This may explain the negative charge on the metal, but it could be a flaw in the calculation. If the program also counts core electrons when working out electron density, osmium will seem more negatively charged simply because it has far more electrons than any of the other atoms.
Next I am going to substitute one of the axial carbonyl ligands for a chloride ligand.
X = Cl
Again to speed up the optimisation the phenyl groups on the dbm ligand were replaced with chlorine atoms. The calculations were run using the B3LYP method with the LanL2DZ basis set for the Os and Cl atoms and the 6-31G(d,p) basis set for the C, O and H atoms. The optimisation results are given below:
| Summary Data | Convergence | Jmol | |||
|---|---|---|---|---|---|

|
Item Value Threshold Converged? Maximum Force 0.000002 0.000015 YES RMS Force 0.000001 0.000010 YES Maximum Displacement 0.000041 0.000060 YES RMS Displacement 0.000015 0.000040 YES |
|
| Bond | Bond Length / Angstroms |
|---|---|
| Os-O | 2.14 |
| Os-C (equatorial) | 1.91 |
| Os-C (axial) | 1.93 |
| Os-Cl | 2.47 |
| Axial C-O | 1.15 |
| Equatorial C-O | 1.15 |
| Bond | Bond Angle / Degrees |
|---|---|
| O-Os-O | 86.5 |
| C-Os-C (both equatorial) | 92.2 |
| Cl-Os-C (axial) | 175.3 |
| O-Os-C (equatorial) | 90.5 |
| O-Os-C (axial) | 90.6 |
| dbm C-C-O | 130.9 |
The log file can be found here: DOI:10042/31388 . Data concerning the bond lengths and angle are also shown.
There are two key differences in bond lengths. Firstly, the axial C-O bond is lower in the Os-Cl complex. This makes sense, since chloride is a good π-donor, so donates electron density onto the metal which means more electron density is backbonded into the C-O π* orbital. This increases the Os-C bond order and so shortens the bond length. The equatorial C-O bond has also shortened, but by a lesser amount than the axial C-O bond. This has nicely illustrated the trans effect in transition metal complexes. We will examine this further in the vibration analysis.
Secondly, the new Os-Cl bond is much longer than the Os-CO bond in the first complex. This is likely to be because of chlorine sitting lower in the periodic table, and hence having larger valence orbitals. The negative charge on the chloride further expands the orbital size. This will mean it will naturally sit further away from the metal centre than a carbon atom will.
Frequency & Vibration Analysis
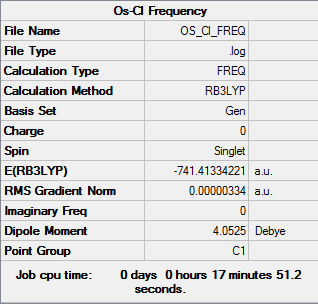
The frequency analysis is given below, and was run using the B3LYP method and the same basis set as the optimisation.
| Summary Data | Low Modes |
|---|---|
|
Low frequencies --- -6.8414 -0.0006 -0.0004 -0.0003 6.0062 6.3131 Low frequencies --- 44.6162 45.5203 73.4550 |
The log file can be found here: DOI:10042/31389 . The convergence data shows all parameters have converged. A summary of the carbonyl vibrations is given below.
| Wavenumber / cm-1 | Intensity | IR Active? | Vibration Description |
|---|---|---|---|
| 2124 | 802 | Yes | Axial CO stretch out of phase to equatorial CO symmetric stretch |
| 2142 | 754 | Yes | Equatorial CO asymmetric stretch |
| 2205 | 485 | Yes | All CO stretching in phase |
Firstly there is one less vibration in this region, since the chloride ligand is a monoatomic ligand so has no internal vibrations.
All of the stretching frequencies are now lower than in the tetra-carbonyl complex, but on closer inspection there has been a reordering of modes! Substituting an axial carbonyl for a chloride has dropped the "axial CO symmetric stretch out of phase to equatorial CO symmetric stretch" down to the lowest energy C-O vibration. This is a drop of 85 cm-1. The next highest vibration, the "equatorial C-O asymmetric stretch", has dropped 43 cm-1 and the highest energy vibration where all carbonyl C-O bonds stretch in phase, has dropped 72 cm-1. From these changes, we can see that the stretches that used to contain the axial carbonyl have dropped more than the one that contains just equatorial C-O stretches. A lower vibration frequency corresponds to a weaker bond, so vibration analysis has also helped demonstrate how the trans effect of the π-donating chloride ligand is to weaken the C-O bond.
MO Analysis
Because the MOs are useful for rationalising the structure and the structure is very similar to the tetra-carbonyl complex, my MO analysis will be limited to examples of chloride-osmium interaction. The file from the MO calculations is here: DOI:10042/31394 .
| Energy Level Number | Calculated MO | LCAO Approximation | Orbital Energy / au | Bonding Character |
|---|---|---|---|---|
| Axis Definition | 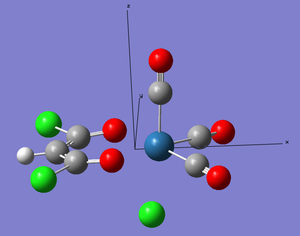 |
 |
n/a | n/a |
| 58 (LUMO) |  |
 |
-0.097 | Bonding interaction between Os dxy and all carbonyl π* antibonding orbitals.
Weak σ-bonding between Os dxy and dbm O-C π* antibonding orbitals. |
| 57 (HOMO) |  |
 |
-0.272 | Non-bonding p orbital on Cl.
Weak bonding between Os dxz and axial carbonyl C-O π* orbital. Weak antibonding between metal dxz and dbm O-C π* orbital. |
| 55 |  |
 |
-0.283 | Cl p-orbital bonds to C-C-C bonding π-system. |
| 52 |  |
 |
-0.333 | π-bonding between Os dyz and Cl p-orbital.
π-bonding between Os dyz and C-O π*-orbital. Antibonding π interaction between Os Os dyz and dbm O-C π-orbital. |
Energy level 55 shows favourable overlap between the Cl p-orbital and the conjugated π-system on the dbm ligand, explaining the bent axial distortion. Energy level 52 is an example of Os-Cl bonding.
X = I
I will approach this complex differently by comparing our calculated data to experimental values from the literature paper.[6] I will optimise the structure and compare its bond lengths and angles to that received from X-Ray crystallography. For this I have NOT substituted the phenyl groups.
The optimisation job was run using B3LYP method and the LanL2MB basis set. Due to the phenyl groups significantly increasing the calculation time I did not have the time to use a more complex basis set.
| Summary Data | Convergence | ||||||
|---|---|---|---|---|---|---|---|

|
Item Value Threshold Converged? Maximum Force 0.000001 0.000015 YES RMS Force 0.000000 0.000010 YES Maximum Displacement 0.000039 0.000060 YES RMS Displacement 0.000007 0.000040 YES | ||||||
| My Calculation: Jmol | Literature Structure: Jmol | ||||||
|
|
The log file for the optimised structure is here: DOI:10042/31396 . The crystal structure can be obtained from here.[6] We can see that all parameters have converged.
Interestingly the reference reports there are two stable conformers present in the structure. Gaussview will follow the PES to find a LOCAL minimum - this does not tell us if there are more significant minima across the whole surface! We can see there is a high energy barrier to rotate the phenyl group to switch conformation. If it rotates one way it will encounter steric clashing with the other phenyl group, and rotation the other way will break the conjugation to the C-C-C part of the ligand.
Here is a comparison of bond lengths and angles between the optimised structure and the respective structure from the literature:
| Bond | Optimised Bond Length / Angstroms | Literature Bond Length / Angstroms |
|---|---|---|
| Os-O | 2.05 | 2.07 (average) |
| Os-C (equatorial) | 2.01 | 1.89 (average) |
| Os-C (axial) | 1.97 | 1.90 |
| Os-I | 2.97 | 2.73 |
| Axial C-O | 1.20 | 1.14 |
| Equatorial C-O | 1.19 | 1.17 (average) |
| Bond | Optimised Bond Angle / Degrees | Literature Bond Angle / Degrees |
|---|---|---|
| O-Os-O | 91.0 | 88.4 |
| C-Os-C (both equatorial) | 91.2 | 90.7 |
| I-Os-C (axial) | 178.5 | 178.0 |
| O-Os-C (equatorial) | 88.6 | 90.2 (average) |
| O-Os-C (axial) | 91.6 | 91.6 (average) |
| dbm C-C-O | 126.2 | 126.7 |
Considering the relatively poor basis set used for this type of complex, there is some good agreement between the calculated and experimental values. All bond lengths seem to be shorter in the experimental structure than the calculated structure, which indicates that the calculation is predicting weaker orbital overlap between the atoms than there is in reality. The bond angles show better agreement.
Despite the quantitative error the calculation has given us a good general idea of the crystal structure without having to actually synthesise the complex. Using better basis sets might give better agreement - if I had more time I would certainly investigate this! I would also manually rotate the C-C bond to one of the phenyl groups to see if I find another PES local minimum to generate an optimised geometry of the second literature conformation.
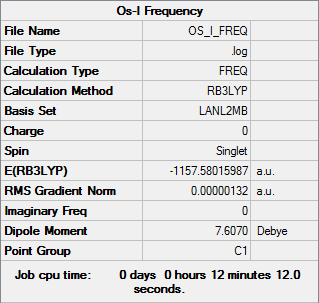
Here is the frequency analysis to prove the conformer is at an energy minimum:
| Summary Data | Low Modes |
|---|---|
|
Low frequencies --- 0.0003 0.0005 0.0005 2.8207 6.1253 8.3995 Low frequencies --- 23.8371 28.4307 33.3043 |
Again the low frequencies are low enough that we can tell we have a minimum energy conformation. The log file can be found here: DOI:10042/31398 .
Conclusions
Three osmium complexes where X = CO, Cl or I have been successfully optimised. The Os-CO complex MOs were analysed in detail to explain the bonding present in transition metal complexes, including σ-donation, π-donors and π-acceptors. NBO analysis gave further insight into the charge distribution of the complex.
The Os-Cl complex helped demonstrate the trans-effect and its associated affect on ligand bonding. Comparison of carbonyl vibrations to those of the Os-CO complex showed the effect of trans ligands on carbonyl bond order.
Finally the Os-I complex allowed comparison of the calculated structure to experimental data to give an idea of how accurate these calculations are. While there is a small discrepancy in bond lengths the overall geometry was predicted very accurately.
References
- ↑ K. Kawaguchi, "Fourier transform infrared spectroscopy of the BH3 ν3 band", J. Chem. Phys., 1992, 96, 3411. DOI:10.1063/1.461942
- ↑ 2.0 2.1 H. Rzepa, "The strangely attractive conformation of C17H36", 1992. http://www.ch.imperial.ac.uk/rzepa/blog/?p=9119
- ↑ 3.0 3.1 3.2 S. Blanksby, G. Ellison, "Bond Dissociation Energies of Organic Molecules", Acc. Chem. Res., 2003, 36, 255-263. DOI:10.1021/ar020230d
- ↑ 4.0 4.1 E. Arunan, G. R. Desiraju, R. A Klein, J. Sadlej, S. Scheiner, I. Alkorta, D. C. Clary, R. H. Crabtree, J. J. Dannenberg, P. Hobza, H. G. Kjaergaard, A. C. Legon, B. Mennucci, D. J. Nesbitt,"Defining the hydrogen bond: An Account", Pure Appl. Chem., 2011, 83, 1618-1636. DOI:10.1351/PAC-REP-10-01-01
- ↑ Hunt Research Group Teaching Page: www.huntresearchgroup.org.uk
- ↑ 6.0 6.1 6.2 Y. Chen, C. Sinha, I. Chen et. al., "Synthesis and characterization of luminescent osmium(II) carbonyl complexes based on chelating dibenzoylmethanate and halide ligands", Chem. Commun., 2003, 3046-3047. DOI:10.1039/B308340C

