Rep:Mod:JOH95MgO
Introduction
The experiment will investigate the properties of an MgO crystal. Firstly the dimensions of the unit cells will be investigated along with the associated energy. Then the phonon dispersion and DOS will be investigated, evaluating the optimal grid size to use. The energies of the crystal will be investigates along with the thermal expansion coefficients. Lastly the quasi-harmonic approximation (QHA) and the molecular dynamics (MD) will be compared.
The QHA is a phonon-based model used to describe volume-dependent thermal effects. The harmonic phonon model assumes that all intermolecular forces are harmonic. This is not sufficient to describe thermal expansion as there is no change to the equilibrium bond length as temperature increases. The QHA takes into account that molecules do have an anharmonic effect at higher temperatures by treating frequencies as volume dependent.
The MD approach allows a system to evolve in time according to Newton's second law . The initial configurations and velocities are assigned to allow the program to iterate positions and velocities. The atoms follow trajectories and the properties, such as E and T, are computed as time averages of their behaviour.
The programs used were RedHat Linux, DLVisulaize (DLV) and General Utility Lattice Program (GULP). DLV allows us to visualise the MgO crystals and GULP is used to perform simulations on materials using boundary conditions, in this case on a 3D lattice.
Internal Energy of MgO
 |
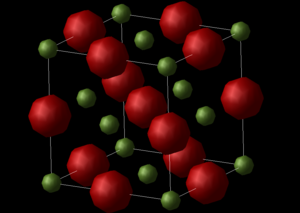 |
Figure 1 shows the primitive unit cell of MgO. The primitive unit cell consists of 2 atoms Mg2+ and O2- which are held together by a Buckingham repulsive potential. The unit cell has a rhombohedron shape with lattice constants of 2.9783 Å and an internal angle a = 60°. The primitive cell contains one lattice point and is the simplest cell to describe the crystal. A calculation was run on MgO. In the LogFile GULF describes MgO using a primitive unit cell. The Cartesian lattice vectors of the cell are reported in table 1 and the total lattice energy was -41.07531759 eV which represents the energy to pull all the atom infinitely apart. The GULP calculation correlates with LCAO HF calculations found in literature (2.573 Å [1]).
| 0.000000 | 2.105970 | 2.105970 |
| 2.105970 | 0.000000 | 2.105970 |
| 2.105970 | 2.105970 | 0.000000 |
The conventional cell has four times the volume of the primitive cell as shown in figure 2. The structure of the cell is face centered cubic (FCC) which has an internal angel a = 90° and a lattice vector of 4.212 Å (which agrees with literature of 4.21 Å [2]). The conventional cell is more representative of the crystal so is chosen in the calculations.
Computing the Phonon Dispersion Curves
 |
The vibrational modes of the lattice were then computed. The phonon modes were displayed as a dispersion curve, as shown in figure 3. The phonon frequencies were calculated along a path in k-space. Special points along the path, , can be seen in figure 3. There are two phonos modes associated with each axis, acoustic (in-phase) and optical (out-of-phase) phonons. In the 3D model three axis (x,y,z) are taken into consideration meaning there are 6 phonon modes as shown by the six different curves in figure 3.
 |
The relationship between the wavevector k to the wavelength (cm-1) is . Furthermore the relationship between wavelength (cm-1) and frequency is . As shown in figure 4 when k=0, for the acoustic mode, the wavelength approaches infinity as all the atoms move in the same direction along the axis. As approaches infinity, frequency will tend to 0. For the optical mode the frequency is non-zero. With this information it is clear that at k=0 the dispersion graph is at symmetry point as this is the only point on the dispersion curve where phonon modes display a frequency of zero.
Following the path from , to and then to the acoustic mode splits into 3 modes, two transverse modes (TA) and one longitude mode (LA). The two TA are degenerate between and until it splits between and .
Phonon Density of States (DOS)
The next part involved calculating the phonon density of states. The DOS is defined as the number of states per energy at a given energy, in this case vibrational frequency. The larger the number of k values considered in reciprocal space the more accurate the DOS. This is achieved by increasing the grid size (nxnxn) to give a better representation of the crystal by sampling more k values in reciprocal space. However, at a certain point the difference between k values is negligible so does not further increase the accuracy of the DOS. Furthermore calculating an infinite number of k values would take an infinite amount of computing time.
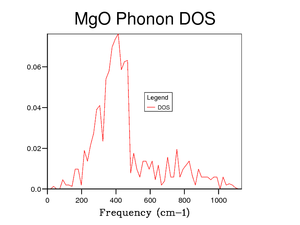
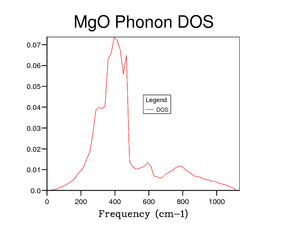
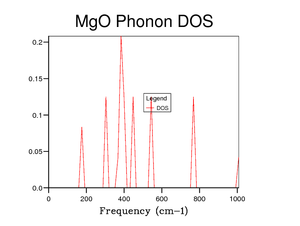
The DOS was calculated for a 1x1x1 grid by setting the shrinking value to 1 as shown in figure 5. The grid size was then increased to find the optimum shrinking value that gave a good representation of the DOS without taking too long to calculate as shown by figures 6 through 10.
 |
 |
 |
 |
 |
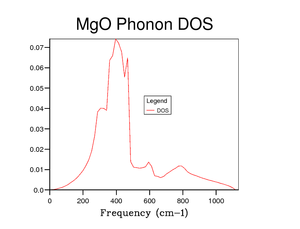 |
Figure 5 shows the DOS for a 1x1x1 grid size. The four peaks 288 cm-1, 352 cm-1, 676 cm-1 and 819 cm-1 represent the four frequencies at point . At symmetry point , by looking at figure 3, the two phonon modes at 288 cm-1 and 352 cm-1 are degenerate (as they go on to split in two curves between points and ). This degeneracy is confirmed in the DOS graph in figure 5 as the intensity of the peaks around 300 cm-1 is around double that of the peaks around 700 cm-1.
Symmetry point is chosen as the k-value for a grid size of 1x1x1 as it is the most representative point in k-space for the DOS. This is shown visually from figures 5 to 10 as when the DOS becomes more accurate the main peak remains around 300 cm-1 with the smaller peak still remaining around 700 cm-1. There is a theorem about using the point in reciprocal space for a 1x1x1 grid called Baldereschi theorem [3].
The ideal grid size is one that represents the DOS without taking too long to calculate. From figure 8 onwards the shape of the curve does not change much, so it can be concluded that using a grid size of 16 is sufficient enough to gain a good understanding of the DOS without taking too long to calculate.
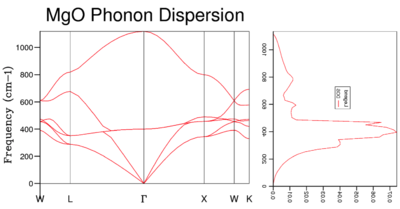 |
It is important to note the relationship between the dispersion curve and the DOS graph as shown in figure 11. The frequency in the phonon dispersion curve on the y axis is the same as the frequency on the DOS curve in the x-axis. It can be seen visually that the most popular states are around 300 cm-1.
The relationship between real space and reciprocal space is given by the formula - a being the length in real space transformed to a* in reciprocal space. This shows that the larger the lattice constant a, the smaller the reciprocal cell. This is important to consider when assessing the DOS for other structures. Lithium has a lattice constant of 3.490 Å [4] which is 0.721 Å lower that the conventional unit cell of MgO that is being modelled. Due to the inverse relationship of real to reciprocal space, lithium will have a larger cell in reciprocal space and therefore need a larger grid size in order to measure more k values to give an accurate DOS. Conversely Faujasite has a lattice constant of 24.7 Å [5] which will give a much smaller cell in reciprocal space meaning that a smaller grid size would give an accurate measurement of the DOS as there are fewer k values needed to measure the cell. CaO has a very similar lattice constant to MgO meaning that a similar grid size would be needed to accurately measure the DOS - in this case a grid size of 16x16x16 would be sufficient.
Computing the Free Energy
| Grid Size nxnxn/n | Free Energy/eV | Accuracy/ meV | Log file |  |
|---|---|---|---|---|
| 1 | -40.930301 | 4 | log file | |
| 2 | -40.926609 | 0.2 | log file | |
| 3 | -40.926432 | 0.1 | log file | |
| 4 | -40.926450 | 0.1 | log file | |
| 8 | -40.926478 | 0.1 | log file | |
| 16 | -40.926482 | 0.1 | log file | |
| 32 | -40.926483 | N/A | log file | |
| 50 | -40.926483 | N/A | log file |
Table 2 displays the free energies of MgO as a function of grid size n. Similar to finding the ideal grid size to calculate the DOS, the optimal grid size to calculate the free energy can be found in table 2. As the grid size increases from 1 to 3 there is a sharp increase in the free energy from -40.930301 eV to -40.926432 eV, afterwards the free energy eventually converges at -40.926483 eV. From a grid size of 4 onwards the degree of accuracy is greater that 0.1 meV. There is no change in free energy from a grid size of 32 to 50 suggesting that a grid size of 32 is all that is needed to precisely determine the free energy of MgO.
The graph in table 2 can be rationalised by the equation for the Helmholtz free energy - where A is the Helmholtz fee energy, U is the internal energy, T is temperature and S is entropy. As the grid size increases, the volume increases so the internal energy decreases (). This in turn means that the Helmholtz free energy would decrease.
Furthermore as the number of microstates sampled increases the entropy term will increase according to the relationship . This in turn means that the free energy will be lowered. By considering these two factors the decrease in free energy can be rationalised.
Thermal Expansion of MgO
The structure of MgO will be optimised with respect to the free energy at different temperatures (0 - 1000 K in steps of 100 K). The free energy will be computed using the quasi-harmonic approximation (QHA) which uses the following expression:
- = frequency of the vibration
- = zero point energy
- = Temperature
- = Boltzmann Constant
- = reduced Planck's constant.
The equations is split into three parts - the zero point energy and the harmonic and entropic contribution.
In addition the coefficients of thermal expansion was calculated. Thermal expansion is the tendency for matter to change in response to temperature, due to heat transfer. The coefficient of thermal expansion describes how the size of an object changes with temperature. The larger the coefficient the greater the change in size as temperature increases. Several coefficients have been developed and the two that we will look at are the linear and volumetric thermal expansion. The generic equation is as follows:
- αx = thermal expansion coefficient
- x = initial dimension
- ∂x = the partial derivative of the dimension under study
- ∂T = partial derivative of temperature
 |
 |
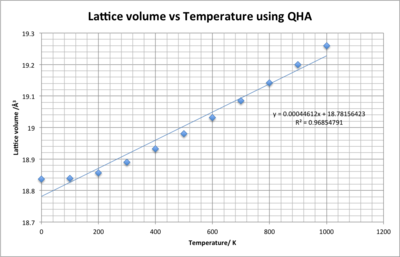 |
Figure 12 shows that as temperature increases the free energy becomes more negative. This can be rationalised with the derivation
Plug in to get
This implies that both the volume and the entropic factor contribute to the free energy. As the temperature increases the volume will increase, however the entropic factor will overcome this due to large change in temperature. This explains the trend observed in figure 12.
We would expect a linear negative decrease - . However figure 12 shows that the trend is a curve, the free energy becomes more negative at an increasing rate, suggesting that the pressure may not be constant.
The trend could also be explained using the Helmoholtz free energy equation used in the QHA.
The entropic contribution in the equation has a large dependence on temperature and therefore as temperature increases the entropic contribution becomes more negative. This is due to the exponential factor in the entropic contribution. This results in the Helmholtz becoming more negative.
Calculating the Thermal expansion coefficients
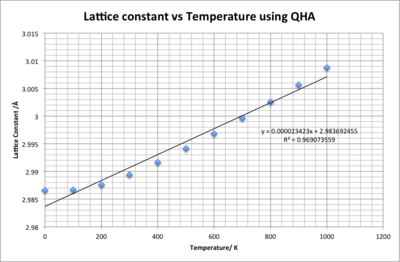
Figure 13 and 12 show how the lattice constant and volume change with temperature. Both graphs initially increase gradually and after 400 K show a near perfect linear trend. The trend in both graphs shows strong correlation with R2 values close to one. By taking the gradient of these trend lines the thermal expansion coefficients can be calculated:
Linear Thermal expansion coefficient:
K-1
L = the initial lattice constant at 0 K, and = the gradient of the graph in figure 13
Volumetric Thermal expansion coefficient:
K-1
V = the initial volume constant at 0 K, and = the gradient of the graph in figure 14
For isotropic materials the volumetric coefficient is three times larger that then linear coefficient - =. For the coefficients calculated is almost three times larger than ( =) implying that MgO is an isotropic material [6], in other words lattice constants a, b and c expand at equal rates. At 200 K the L value increases to 2.987604 Å resulting in =K-1 which is close to the literature value of K-1 [1].
The main approximation with the QHA occurs at higher temperatures. This is because at higher temperatures the lattice experiences a larger anharmonic effect due to a larger deviation from bond equilibrium as more energy is put into the bond. Furthermore as anharmonicity comes from scattered phonons interacting due to lattice defects, this effect will be accentuated as lattice vibrations gain more energy. The QHA simplifies the anharmonic effect by letting the phonon frequencies become volume dependent so therefore is unable to model the anharmonic effect well. Furthermore the born-oppenheimer approximation would become less valid at larger temperatures as the motion of nuclei becomes more important. So as the temperature reaches melting point the phonon modes would not represent the motion of the ions well.
Lastly in a diatomic molecule, with an exact harmonic potential, as the temperature increases there would be no change in equilibrium bond length as the parabolic function is symmetric. Instead the maximum and minimum bond lengths would increase or in other words a larger amplitude would be reached.
Molecular Dynamics
The crystal was then studied using Molecular Dynamics. In the previous investigations MgO has been described using a primitive cell containing a single MgO unit. Running an MD would not produce meaningful data as every cell would move perfectly in phase. By increasing the size of the cell the MD would become more accurate but become more computationally expensive so a compromise is reached for a cell containing 32 MgO units.
 |
 |
Molecular Dynamics allows a system to evolve in time according to Newton's second law F=ma. As the system is treated classically energy can be modelled by the equipartition principle, , and as such the energy will increase linearly with temperature. In comparison QHA follows the relationship
This means that the energy should decrease with temperature. Both the free energy modelled by MD and QHA can be seen in figure 15.
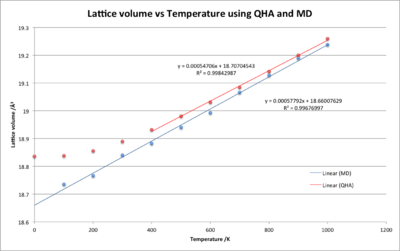
Looking at figure 16 the MD and the QHA show similar trend lines between 400-1000 K, thus the volumetric expansion coefficients would be similar:
- MD - = 3.06 x 10⁻⁵ K-1
- QHA - = 2.89 x 10⁻⁵ K-1
This similarity in data strengthens the reliability of the volumetric expansion coefficients between 400 - 1000 K. However, below 400 K the QHA begins to break from a linear trend and curve towards 18.84 Å-3 whereas the MD follows the linear trend. At lower temperatures the anharmonic effect is not as prevalent due to less energy in the bond causing less deviation from the equilibrium bond length as it vibrates. This means the QHA is a better model for the lattice volume at lower temperatures. The MD model does not accurately show how the lattice volume changes at lower temperatures.
Limitation
Overall both QHA and MD models have their limitations.
The atoms are modelled using a classical approach or in other words atoms are modelled as hard charged spheres. So the quantum mechanical contributions cannot be taken into account. This will reduced the accuracy of the models
Furthermore, the models do not consider long-range interactions, only interactions of atoms relatively close. In a realistic crystal there will be interactions outside the nearest neighbours albeit small interactions. Thus slight inaccuracy in the models is seen.
For both models it can be assumed that the trends can be extrapolated until the melting point of MgO is reached, as upon melting a change in volume occurs. Furthermore liquid MgO has no structured order so cannot be described by a repeated unit cell.
In the QHA the interactions between atoms of different unit cells was not taken into consideration. There would be an energy increase if there was overlap between atoms in different cells.
For these MD calculations, as only a small number of atoms were considered it was reasonable to use a time step of 1.0 femtoseconds. However, when considering a much larger system, say for example a protein, then this would become computationally expensive.
Conclusion
The experiment showed the thermal expansion of MgO, the phonon dispersion and the DOS. Comparisons between the QHA and the MD were made, both approaches giving reasonable thermal expansion coefficients between 400-1000 K. At lower temperatures the QHA was a better model, due to the reduction in anharmonic effects.
References
- ↑ 1.0 1.1 O. Madelung, U. Rössler and M. Schulz, Eds., II-VI and I-VII compounds; Semimagnetic compounds, Springer-Verlag, 1999.
- ↑ A. CIMINO, P. PORTA and M. VALIGI, Journal of the American Ceramic Society, 1966, 49, 152–156.
- ↑ A. Baldereschi, Physical Review B, 1973, 7, 5212–5215.
- ↑ E. J. Covington and D. J. Montgomery, J. Appl. Phys. J. Chem. Phys. J. Chem. Phys. J. Chem. Phys. J. Chem. Phys, 2010, 27, 1030–53111.
- ↑ J. A. Kaduk and J. Faber, The Rigaku journal 14 CRYSTAL STRUCTURE OF ZEOLITE Y AS A FUNCTION OF ION EXCHANGE, 1995.
- ↑ J.R. Vinson, Plate and Panel structures of Isotropic, Composite and Piezoelectric Materials, including Sandwich Construction. Delaware; Springer; 2005.
Appendix
 |
