Rep:Mod:JK21056
Task 6: Dynamical Properties and the Diffusion Coefficient
Task 1
Using data from simulation
For the following graphs, the series Timestep was replaced by Time, which was achieved by multiplying Timestep series by a tenth of the simulation timestep (0.002).

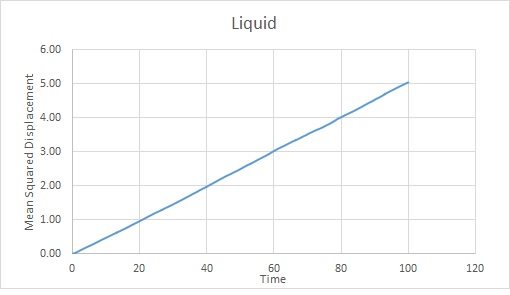
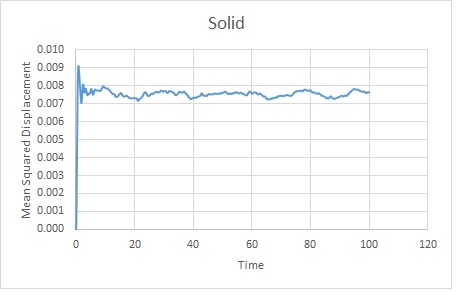
The trends are as expected. The gas becomes the most displaced as it is the most disordered phase. The rate of change of displacement increases until about timestep 2000. This is probably because the gas has diffused sufficiently to overcome Lennard Jones Potential at this point. It will continue to diffuse.
The liquid becomes more diffuse with time but at a much slower rate than the gas because it has stronger interactions between particles.
The solid rapidly takes its lattice position as this is energetically favourable. It will oscillate slightly before remaining in the lattice. Although there is a slight translation, the scale shows that this is very small so the position varies very little from its average.
Estimation of , the Diffusion Coefficient:
Using the gradients of the linear sections of the graphs, as mentioned above:
Gas: Reduced units
Liquid: Reduced units
Solid: Reduced units
Data from one million atom simulations
Time could not be calculated as the simulation's timestep was not given:


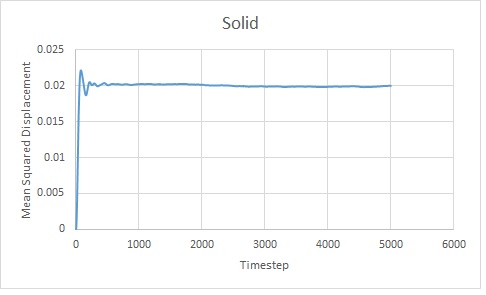
Using the gradients of the linear sections of the graphs, as mentioned above:
Gas: Unknown units
Liquid: Unknown units
Solid: Unknown units
Task 2
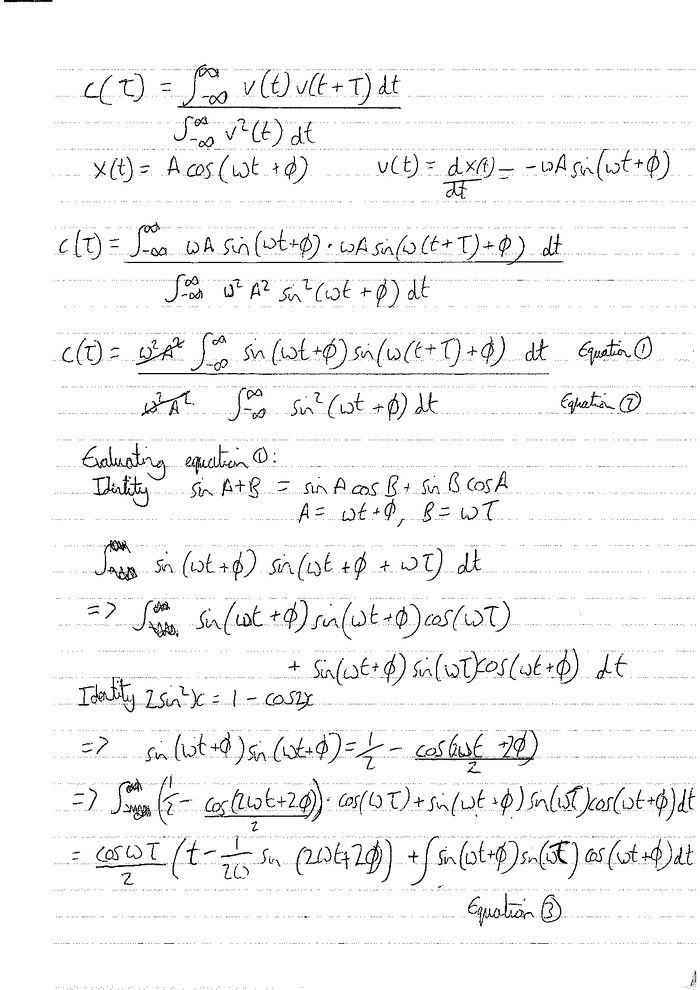
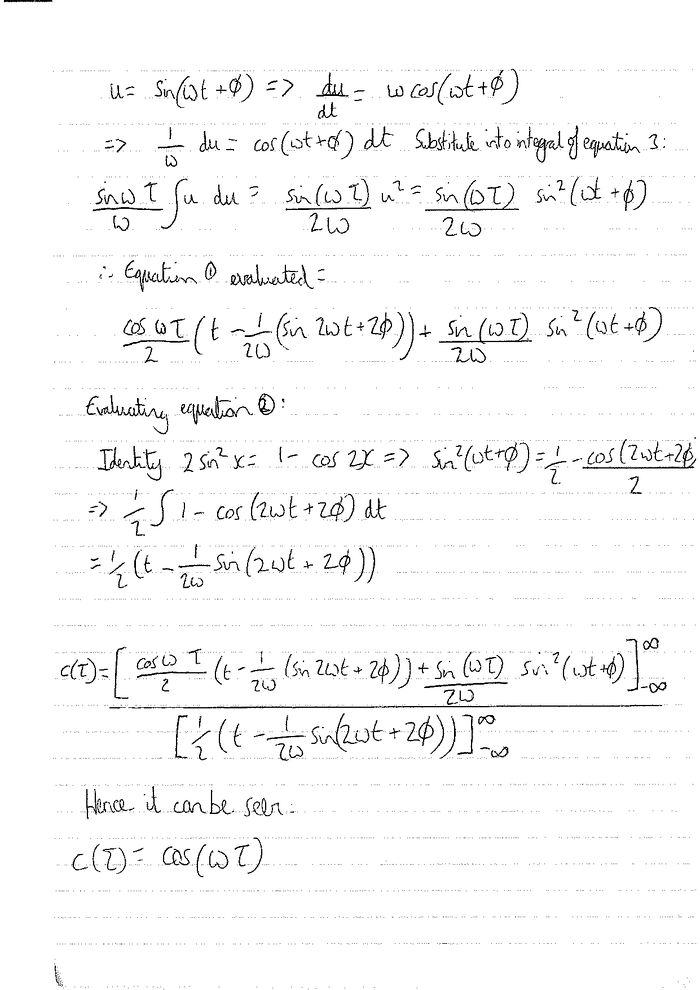
Evaluating the normalised velocity autocorrelation function for a 1D harmonic oscillator:

Task 3
The trapezium rule was used to evaluate the area beneath the graphs for my own simulation. This gave an integration of -5.39 for the solid, -5.39 for the liquid and 3499 for the gas. The diffusion coefficient, was calculated in each case:


