Rep:Mod:JH7347
Inorganic Module
Optimization of Borane
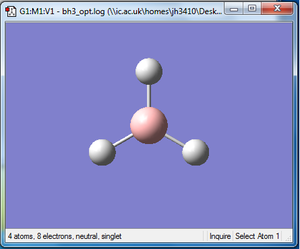
After initial familiarisation with the Gaussian [1] interface the following optimised borane molecule was produced giving the log file here.
| File Type | .log |
| Calculation Type | FOPT |
| Calculation Method | RB3LYP |
| Basis Set | 3-21G |
| E(RB3LYP) | -26.46226338 a.u. |
| RMS Gradient Norm | 0.00020672 a.u. |
| Dipole Moment | 0.0000 Debeye |
| Point Group | D3h |
The calculation gives optimal bond lengths of 1.19Å for B-H bonds and H-B-H bond angles of 120.0°. The calculation took 12.0 seconds to complete.
The .log file shows the following at convergence:
 Item               Value     Threshold  Converged?
 Maximum Force            0.000413     0.000450     YES
 RMS     Force            0.000271     0.000300     YES
 Maximum Displacement     0.001610     0.001800     YES
 RMS     Displacement     0.001054     0.001200     YES
 Predicted change in Energy=-1.071764D-06
 Optimization completed.


The optimisation took 4 steps to reach equilibrium as shown in the graphs on the right, each step showing improvement. The first graph shows the change in total energy of the system with the second graph showing changes in the RMS gradient.
The geometry was further optimised using the higher level basis set 6-31G(d,p), the calculation was based on the output of the original optimisation. The following file was produced given here. The calculation took 16.0 seconds to complete.
| File Type | .log |
| Calculation Type | FOPT |
| Calculation Method | RB3LYP |
| Basis Set | 6-31G(d,p) |
| E(RB3LYP) | -26.61532363 a.u. |
| RMS Gradient Norm | 0.00000235 a.u. |
| Dipole Moment | 0.0000 Debeye |
| Point Group | D3h |
The following item table is found in the .log file:
Item               Value     Threshold  Converged?
 Maximum Force            0.000005     0.000450     YES
 RMS     Force            0.000003     0.000300     YES
 Maximum Displacement     0.000019     0.001800     YES
 RMS     Displacement     0.000012     0.001200     YES
 Predicted change in Energy=-1.304899D-10
 Optimization completed.
The calculation gives optimal bond lengths of 1.19Å for B-H bonds and H-B-H bond angles of 120.0°.
TlBr3 optimisation
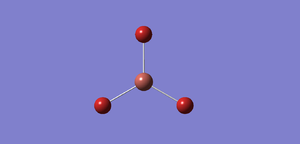
With an initial set-up of Tl-Br bond lengths of 2.69Å with Br-Tl-Br angle of 120.0° the system was submitted to optimisation with symmetry constrained to D3h at a tolerence of 0.0001. The molecule was optimised using the DFT B3LYP method with LanL2DZ basis set and gave the following after being run on the HPC, [1], and this .log file.
The results summary is as follows, calculation took 41.2 seconds:
| File Type | .log |
| Calculation Type | FOPT |
| Calculation Method | RB3LYP |
| Basis Set | LANL2DZ |
| E(RB3LYP) | -91.21812851 a.u. |
| RMS Gradient Norm | 0.00000090 a.u. |
| Dipole Moment | 0.0000 Debeye |
| Point Group | D3h |
The table below confirms that the calculation reached convergence:
         Item               Value     Threshold  Converged?
 Maximum Force            0.000002     0.000450     YES
 RMS     Force            0.000001     0.000300     YES
 Maximum Displacement     0.000022     0.001800     YES
 RMS     Displacement     0.000014     0.001200     YES
 Predicted change in Energy=-6.084097D-11

Optimization completed.
This gives the Tl-Br bond length of 2.65Å and the Br-Tl-Br bond angle of 120.0°. In aqueous solution it has been shown [2] that the Br-Tl bond length is 2.52Å, variance of 0.0039Å2, with evidence of trigonal planar structuresuggesting a bond angle of 120°. Other calculations [3] give bond lengths of 2.55Å with bond angles of 120°. The literature values suggests that the value calculated is not too dissimilar to what is expected as the calculated bond length is within 0.1Å, although this is a large percentage of the bond length, the angle is also in agreement due to the constraint to D3h geometry.
BBr3 optimisation
Taking the basis of the BH3 optimised system but replacing the hydrogen atoms with bromine the new system was submitted to Gaussian on the HPC with differing basis sets for the different atoms, the boron atom was ran with the 6-31G(d,p) basis set whereas the Br atoms were ran with the LanL2DZ basis set and pseudo potentials. The calculation led to [2] with the following .log file.
A summary of the calculation is given below, calculation took 36.3 seconds to complete:
| File Type | .log |
| Calculation Type | FOPT |
| Calculation Method | RB3LYP |
| Basis Set | GEN |
| E(RB3LYP) | -64.43645296 a.u. |
| RMS Gradient Norm | 0.00000382 a.u. |
| Dipole Moment | 0.0000 Debeye |
| Point Group | D3h |
Convergence is confirmed by the following table found in the .log file:
         Item               Value     Threshold  Converged?

 Maximum Force            0.000008     0.000450     YES
 RMS     Force            0.000005     0.000300     YES
 Maximum Displacement     0.000036     0.001800     YES
 RMS     Displacement     0.000023     0.001200     YES
 Predicted change in Energy=-4.026911D-10

Optimization completed.
The Br-B bond length was calculated to 1.93Å with Br-B-Br bond angle of 120.0°. The bond length in literature [4] is given as 1.903Å with trigonal planar geometry (120° bond angle).
Analysis of the trigonal planar molecules
The above optimisations of the trigonal planar molecules BH3, BBr3 and TlBr3 gave the following bond lengths:
| Molecule | M-X Bond Length, Å |
|---|---|
| BH3 | 1.19232 |
| BBr3 | 1.93396 |
| TlBr3 | 2.65095 |
As can be seen changing the ligand, X, from H to Br gives a longer bond length from 1.19 to 1.93Å this is due to Br being a much larger atom than H with van der Vaals radii of 185pm and 120pm respectively. However this difference does not quite give all the effect only 65pm wheras the calculated difference is 74pm this could be due to calculation errors but the differing bonding orbitals could have an effect. Hydrogen will only bond using its 1s orbital as this is the HOMO orbital and is quite low lying in contrast bromine can bond with the 3s or 3p orbitals, as the p orbitals are more diffuse and more directional the calculation implies that this adds to the bond length.
Changing the central atom, M, from B to Tl also gives a longer bond length, from 1.93 to 2.65Å, the van der Vaals radii have an effect on the system 192pm and 196pm for boron and thallium respectively. However the change in radius is quite small, only 4pm, which suggests that there is a much bigger effect occurring and the radii are very similar. The bonding orbitals for boron are the 2s and 2p orbitals which are quite small and give good overlap with the ligand orbitals. Thallium however has very diffuse 6s and 6p orbitals which are much larger than those in boron, the large orbitals give very long bond lengths comparatively as the bond is going to be weaker, less orbital overlap between the ligands and central atom.
Bonds between atoms can be identified as either ionic or covalent. Ionic bonds are formed from electron transfers and coulombic interactions they are very strong over short distances, coulomic attraction varies with 1/r2.
The molecules calculated so far have strong covalent bonding which is "sharing of electrons", covalent bonds are formed due to the interaction of the atomic orbitals giving molecular orbitals, these orbitals are spread across the system and are formed as they have a lower total energy, when electrons occupy them, than the total of the individual atomic orbitals.

Gaussview sometimes does not draw bonds when they are expected as the inter-atomic distances are large so are interpreted as non-bonded this doesn't mean that the atoms are not affected by the presence of others and molecular orbitals will be present but the energies could be too high in energy for bonding to be effective.
Frequency Analysis
BH3
Frequency analysis was performed on the optimised BH3 structure giving the following summary; the energies of the two outputs, optimisation and frequency, are the same so the correct system has been used:
| File Type | .log |
| Calculation Type | FREQ |
| Calculation Method | RB3LYP |
| Basis Set | 6-31G(d,p) |
| E(RB3LYP) | -26.61532363 a.u. |
| RMS Gradient Norm | 0.00000237 a.u. |
| Dipole Moment | 0.0000 Debeye |
| Point Group | D3h |
The calculation took 12.0 seconds to complete, convergence is shown in the following table taken from the .log file, the file is given here:
         Item               Value     Threshold  Converged?
 Maximum Force            0.000005     0.000450     YES
 RMS     Force            0.000002     0.000300     YES
 Maximum Displacement     0.000019     0.001800     YES
 RMS     Displacement     0.000009     0.001200     YES
 Predicted change in Energy=-1.323374D-10
 Optimization completed.
    -- Stationary point found.
The following frequency table is found in the log file, this shows the motion of the centre of mass frequencies which are quite small (±15cm-1) with the vibrations an order of magnitude higher (around 1200cm-1):
 Low frequencies ---   -0.9033   -0.7343   -0.0054    6.7375   12.2491   12.2824
 Low frequencies --- 1163.0003 1213.1853 1213.1880
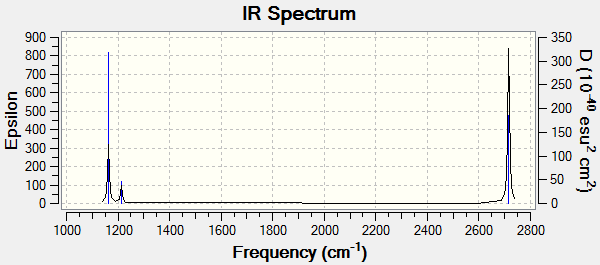
This table shows the frequencies and intensities of the vibrations along with a brief description of the motion:
|
| The IR spectrum of BH3 as calculated from the molecular vibrations |
Only 3 peaks are shown in the spectrum but there are 6 different vibrations. The reason for this discrepancy is that there are two degenerate vibrations which correspond to a frequency of 1213cm-1 and two degenerate vibrations at a frequency of 2715cm-1 which would lead to 4 peaks at 1163, 1213, 2582 and 2715 cm-1. The peak at 2582cm-1 has an intensity of 0 and so also does not show on the spectrum. These two effects lead to the IR spectrum having just 3 peaks.
TlBr3
Frequency analysis was also performed on the optimised TlBr3 which gave the following published to Dspace [3]. With the log file given here. The summary table is given as, the calculation took 28.4 seconds to complete:
| File Type | .log |
| Calculation Type | FREQ |
| Calculation Method | RB3LYP |
| Basis Set | LANL2DZ |
| E(RB3LYP) | -91.21812851 a.u. |
| RMS Gradient Norm | 0.00000088 a.u. |
| Dipole Moment | 0.0000 Debeye |
| Point Group | D3h |
The item table is given as:
         Item               Value     Threshold  Converged?
 Maximum Force            0.000002     0.000450     YES
 RMS     Force            0.000001     0.000300     YES
 Maximum Displacement     0.000022     0.001800     YES
 RMS     Displacement     0.000011     0.001200     YES
 Predicted change in Energy=-5.660901D-11
 Optimization completed.

-- Stationary point found.
The low frequencies table is given below:
 Low frequencies ---   -3.4213   -0.0026   -0.0004    0.0015    3.9367    3.9367
 Low frequencies ---   46.4289   46.4292   52.1449
The "zero" frequencies are all within tolerances and the lowest non-zero frequencies are low at 46-52cm-1.
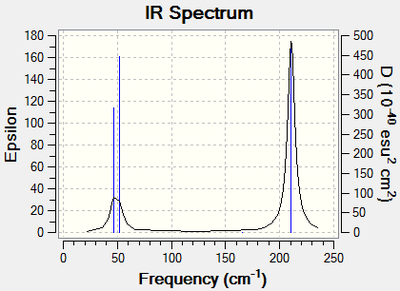
|
| The IR spectrum of TlBr3 as calculated from the molecular vibrations |
The vibrations for the TlBr3 molecule are similar to those for BH3 a table showing a comparison of the two molecules is below:
| Number | Frequency for BH3/cm-1 | Intensity | Frequency for TlBr3/cm-1 (Number) | Intensity |
| 1 | 1163 | 93 | 52(3) | 6 |
| 2 | 1213 | 14 | 46(1) | 4 |
| 3 | 1213 | 14 | 46(2) | 4 |
| 4 | 2582 | 0 | 165 | 0. |
| 5 | 2715 | 126 | 211 | 25 |
| 6 | 2715 | 126 | 211 | 25 |
As can be seen in the table there is a large difference in the frequency values for the two molecules this is due to the very large mass differences involved for each of the atoms, Tl is much heavier than B and Br is much heavier than H, so the atoms move slower. The bonding in TlBr3 is also weaker, as shown by the longer bond length, and so has a lower frequency vibration. There has also been a reordering of the modes, as shown in the table, which is due to the wagging motion being higher in energy for the higher mass system.
The IR spectra for the molecules are very similar, with the TlBr3 being shifted to lower energies and a shorter gap between the two sets of peaks, both spectra have 3 peaks but as the Tl spectrum is more condensed there is an overlap of the low frequency peaks. The B spectrum is also of much higher intensity.
In both spectra it is seen that there are two pairs of vibrational modes that lie close together, A2" with E' and A1' with E', this is because the first pair are bending modes whereas the second pair are stretching modes. Stretching is higher in energy so they appear higher in the spectrum.
The same basis set is used for the results to be valid as changing the basis set from optimisation to frequency will lead to a different set of functions being used which makes the calculation invalid. Frequency analysis determines whether the minimal point has in fact been reached by the optimisation as if the minimal point is not found there will be anomalies in the vibrations e.g. high energy "low" frequency (heavy atom) vibrations, broad range of low frequency vibrations or possible negative high energy vibrations. The low frequencies given in the two sections above are the vibrations corresponding to the motion of the central atom which in the cases studied are the heaviest and thus have very weak vibrational modes.
Molecular orbitals of BH3
Energy calculations were run on Gaussian starting with the optimised system and gave the following [4] when published to Dspace. The calculation took 32.0 seconds with a summary given below:
| File Type | .fch |
| Calculation Type | SP |
| Calculation Method | RB3LYP |
| Basis Set | 6-31G(d,p) |
| E(RB3LYP) | -26.61532363 a.u. |
| RMS Gradient Norm | 0.00000000 a.u. |
| Dipole Moment | 0.0000 Debeye |
| Point Group |
Below is a diagram of the calculated molecular orbitals (MO's) found compared to theoretical MO's from the qualitative addition of atomic orbitals from MO theory:
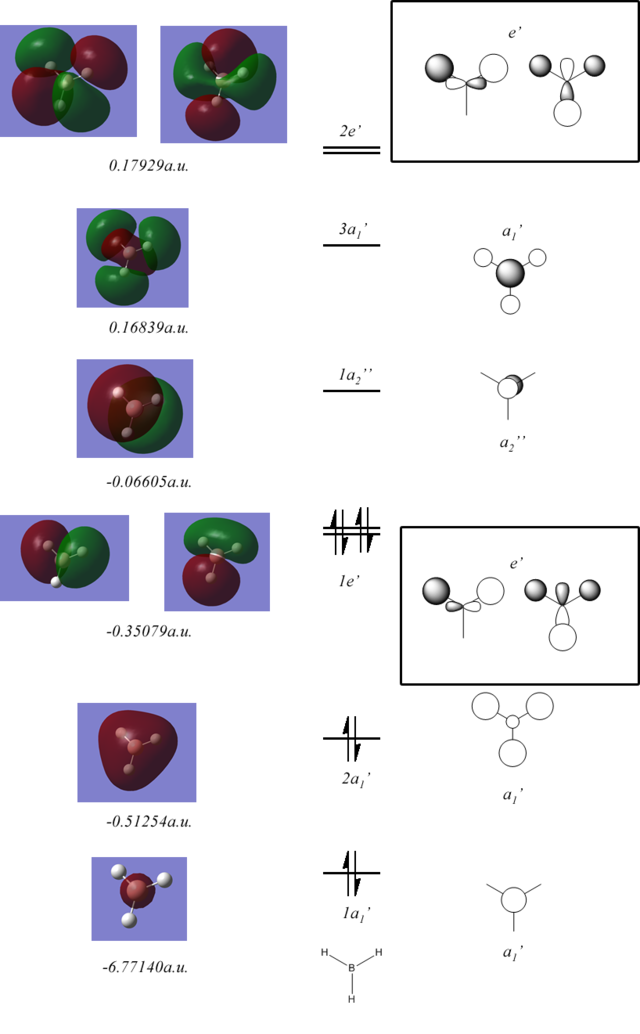
As can be seen the general shapes are in good agreement with the molecular orbital theory predictions, the only significant differences are the LCAO does not show that the in phase lobes of the orbitals will join whenever possible creating orbitals that span across the molecule and are not just localised on atoms. MO theory is very useful for a qualitative analysis of a molecule but it should be taken into account that the orbitals will spread to give large lobes of the same phase.
NH3 Calculations and Analysis
NH3 Optimisation

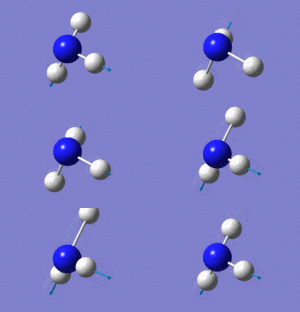
A molecule of ammonia was simulated and optimised using the 6-31G(d,p) basis set on the laptop provided taking 32.0 seconds to carry out, the calculation yielded the log file here. With the summary table and the "item" table following:
| File Type | .log |
| Calculation Type | FOPT |
| Calculation Method | RB3LYP |
| Basis Set | 6-31G(d,p) |
| E(RB3LYP) | -56.55776863 a.u. |
| RMS Gradient Norm | 0.00000289 a.u. |
| Dipole Moment | 1.8464 Debeye |
| Point Group | C3v |
         Item               Value     Threshold  Converged?
 Maximum Force            0.000005     0.000450     YES
 RMS     Force            0.000003     0.000300     YES
 Maximum Displacement     0.000010     0.001800     YES
 RMS     Displacement     0.000007     0.001200     YES
 Predicted change in Energy=-7.830241D-11
 Optimization completed.
    -- Stationary point found.
Bond lengths for the N-H bond are all 1.02Å with H-N-H bond angles of 105.7° which is expected for the trigonal pyramidal structure of ammonia.
NH3 Frequency Analysis
After the optimisation of ammonia frequency analysis was performed on the system to confirm that the minimal value is found. The calculation gave the log file here, the calculation took 2 minutes 23.0 seconds to complete. Shown below are the summary table, the "item" table and the low frequency table from the calculation:
| File Type | .log |
| Calculation Type | FREQ |
| Calculation Method | RB3LYP |
| Basis Set | 6-31G(d,p) |
| E(RB3LYP) | -56.55776863 a.u. |
| RMS Gradient Norm | 0.00000281 a.u. |
| Dipole Moment | 1.8464 Debeye |
| Point Group | C3 |
         Item               Value     Threshold  Converged?
 Maximum Force            0.000005     0.000450     YES
 RMS     Force            0.000003     0.000300     YES
 Maximum Displacement     0.000011     0.001800     YES
 RMS     Displacement     0.000006     0.001200     YES
 Predicted change in Energy=-8.408692D-11
 Optimization completed.
    -- Stationary point found.
 Low frequencies ---  -11.6313  -11.5960   -0.0028    0.0243    0.1402   25.5608
 Low frequencies --- 1089.6620 1694.1733 1694.1736
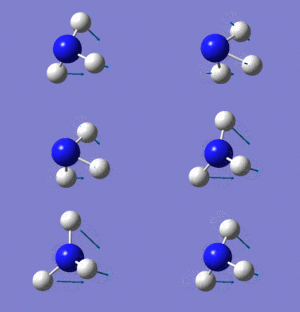
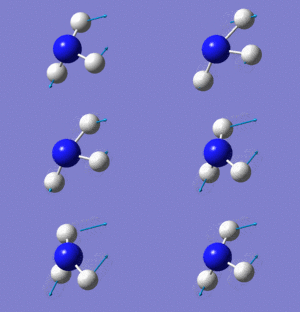
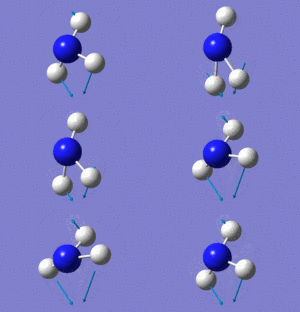
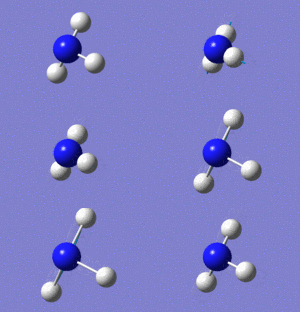
The low frequencies are about an order of magnitude lower than the N-H vibration frequencies which seems fine, the summary table shows the same energies and dipole moment but a small change in symmetry which is also acceptable, there is no obvious problems with the vibration frequencies, they are all large and positive, a table showing the vibrations is given below with a calculated IR spectrum:
| Number | Form of the vibration | Frequency / cm-1 | Intensity | Symmetry C3 point group | ||
|---|---|---|---|---|---|---|
| 1 |
|
1090 | 145 | A | ||
| 2 |
|
1694 | 14 | E | ||
| 3 |
|
1694 | 14 | E | ||
| 4 |
|
3461 | 1 | A | ||
| 5 |
|
3590 | ~0 | E | ||
| 6 |
|
3590 | ~0 | E |
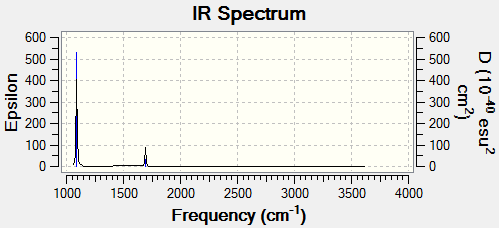
|
| The IR spectrum of NH3 as calculated from the molecular vibrations |
The higher energy vibrations do not show on the spectrum as the intensity levels are very low. As the dipole moment doesn't change very much for these motions, IR spectroscopy depends on change in dipole moment to show a peak.
NH3 Molecular orbitals
The calculation to determine the molecular orbitals was performed and the results published to Dspace here [5]. A summary table of the calculation is given below, the calculation took 31.3 seconds to complete:
| File Type | .log |
| Calculation Type | SP |
| Calculation Method | RB3LYP |
| Basis Set | 6-31G(d,p) |
| E(RB3LYP) | -56.55776863 a.u. |
| RMS Gradient Norm | a.u. |
| Dipole Moment | 1.8464 Debeye |
| Point Group | C3v |
The surfaces calculated and the LCAO's that they correspond to are shown below:
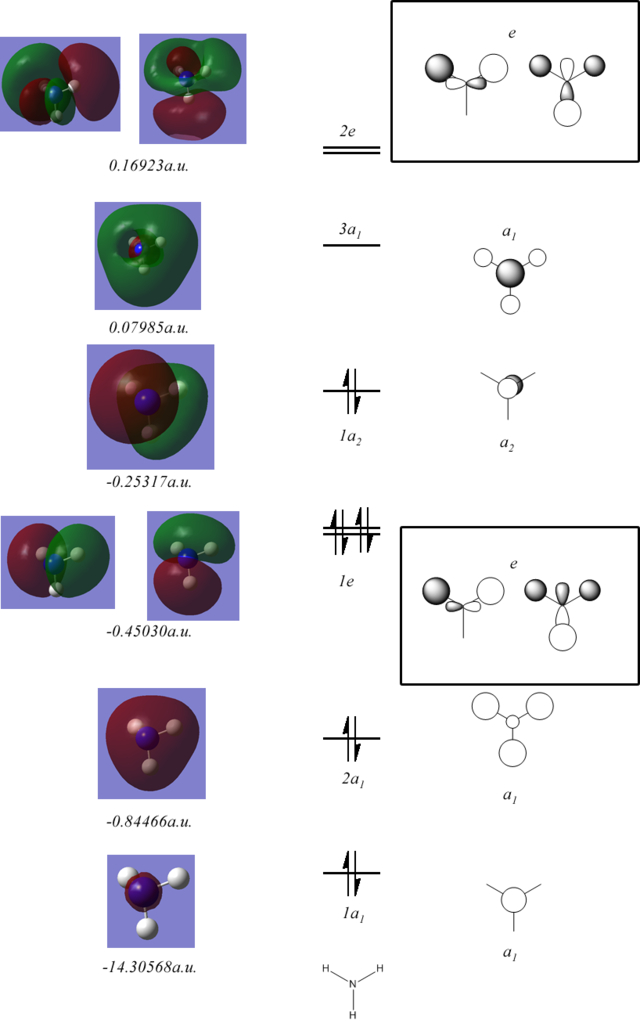
These are very similar to those of borane however due to the different symmetry the H s orbitals interact with 1a2 to stabilise the lone pair.
NBO Analysis

Natural bond orbital analysis was performed on the optimised ammonia system, the results also come from the MO calculation. The image to the right shows the charge distribution with the bright red and bright green showing a range from -1.125 to 1.125 respectively (as seen in the image). The charges for the N atom and the H atoms are given as -1.125 and 0.375 respectively.
The log file shows that bonding can be thought of as sp3 orbitals from the N atom bonding to the 1s orbitals of the H atoms. The final two occupied orbitals, as shown in the MO's above, are a very low lying 1s orbital on the N atom and a lone pair primarily formed from the final p orbital on the N atom.
NH3BH3
Optimisation
The NH3BH3 system was simulated and optimised using Gaussian on the HPC giving the following when published, [6], the log file from the calculation can be found here, the calculation took 1 minute 49.8 seconds to complete. The summary table and the "item" table from the log file can be seen below:
| File Type | .log |
| Calculation Type | FOPT |
| Calculation Method | RB3LYP |
| Basis Set | 6-31G(d,p) |
| E(RB3LYP) | -83.22468918 a.u. |
| RMS Gradient Norm | 0.00006806 |
| Dipole Moment | 5.5654 Debeye |
| Point Group | C1 |
         Item               Value     Threshold  Converged?
 Maximum Force            0.000137     0.000450     YES
 RMS     Force            0.000063     0.000300     YES
 Maximum Displacement     0.000606     0.001800     YES
 RMS     Displacement     0.000336     0.001200     YES
 Predicted change in Energy=-1.993983D-07
 Optimization completed.
    -- Stationary point found.
Frequency Analysis
Frequency analysis was then performed on the optimised system giving the following when published,[7], the log file can be found here. The calculation took 1minute 4.2seconds and yielded the following summary, "item" and low frequency tables:
| File Type | .log |
| Calculation Type | FREQ |
| Calculation Method | RB3LYP |
| Basis Set | 6-31G(d,p) |
| E(RB3LYP) | -83.22468917 a.u. |
| RMS Gradient Norm | 0.00006806 a.u. |
| Dipole Moment | 5.5654 Debeye |
| Point Group | C1 |
         Item               Value     Threshold  Converged?
 Maximum Force            0.000125     0.000450     YES
 RMS     Force            0.000068     0.000300     YES
 Maximum Displacement     0.000955     0.001800     YES
 RMS     Displacement     0.000580     0.001200     YES
 Predicted change in Energy=-2.114052D-07
 Optimization completed.
    -- Stationary point found.
 Low frequencies ---    0.0008    0.0010    0.0012   17.1381   22.5592   38.8341
 Low frequencies ---  265.8687  632.3782  639.0702
The low frequencies are quite high, 38.8cm-1 at maximum, but they are still an order of magnitude lower than the other frequencies which is acceptable, other results are in agreement with the optimisation.
Analysis of adduct reaction
The energies of the ammonia, borane and adduct are given below:
E(NH3) = -56.55776863 a.u.
E(BH3) = -26.1532363 a.u.
E(NH3BH3) = -83.22468918 a.u.
The reaction is given as:
NH3+BH3 → NH3BH3
Which means that the total energy of the system is calculated as:
ΔE= E(NH3BH3)-E(NH3)-E(BH3)
ΔE= -83.22468918 + 56.55776863 + 26.1532363
ΔE= -0.05159692 a.u.
ΔE= -134±10 kJ mol-1
This is on the right scale as a bond is generally around 100-500 kJ mol-1 so the final value is sensible but the bond is quite weak, the low end of the bonding scale, although it is much stronger than hydrogen bonds which are about 30kJ mol-1. The negative energy associated with the adduct formation also suggests that its formation is favoured, the reaction would be exothermic.
Inorganic Mini-Project, Ionic Liquids
[N(CH3)4]+
3-21G optimisation
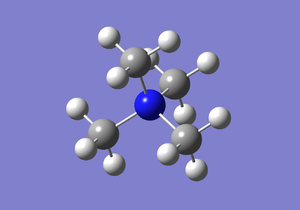
A molecule of [N(CH3)4]+ was simulated and optimised yielding the following when published to Dspace,[8], with this log file,here. The following summary table and item table are found in the log file, the calculation took 9minutes 12.7 seconds to complete:
| File Type | .log |
| Calculation Type | FOPT |
| Calculation Method | RB3LYP |
| Basis Set | 3-21G |
| Charge | +1 |
| E(RB3LYP) | -213.01640329 a.u. |
| RMS Gradient Norm | 0.00003476 a.u. |
| Dipole Moment | 0.0003 Debeye |
| Point Group | C1 |
         Item               Value     Threshold  Converged?
 Maximum Force            0.000103     0.000450     YES
 RMS     Force            0.000028     0.000300     YES
 Maximum Displacement     0.001239     0.001800     YES
 RMS     Displacement     0.000367     0.001200     YES
 Predicted change in Energy=-9.724604D-08
 Optimization completed.
    -- Stationary point found.
6-31G(d,p) optimisation
The molecule was further optimised yielding the following when published to Dspace, [9], with this log file, here. The following summary table and item table are found in the log file, the calculation took 13 minutes 8.6 seconds to complete:
| File Type | .log |
| Calculation Type | FOPT |
| Calculation Method | RB3LYP |
| Basis Set | 6-31G(d,p) |
| Charge | +1 |
| E(RB3LYP) | -214.18126853 a.u. |
| RMS Gradient Norm | 0.00002534 a.u. |
| Dipole Moment | 0.0002 Debeye |
| Point Group | C1 |
         Item               Value     Threshold  Converged?
 Maximum Force            0.000056     0.000450     YES
 RMS     Force            0.000019     0.000300     YES
 Maximum Displacement     0.001393     0.001800     YES
 RMS     Displacement     0.000408     0.001200     YES
 Predicted change in Energy=-5.975728D-08
 Optimization completed.

-- Stationary point found.
The bond lengths for the N-C bonds are all 1.51Å with C-N-C bond angles of 109.5°, all the H environments are the same with H-C lengths of 1.09Å, H-C-N bond angles of 108.9° and H-C-H bond angles of 110.1°. There are minor discrepancies in the bond lengths at the furthest decimal places this leads to the small dipole moment given.
Frequency Analysis
Frequency analysis was then performed on the optimised system given the following when published, [10], the calculation took 31 minutes and yielded the following summary table, item table and low frequencies found by looking at the log file here, as the system did not converge properly the frequency analysis and optimisation were performed together using the opt=calcall method which took longer but lead to a system which converged:
| File Type | .log |
| Calculation Type | FREQ |
| Calculation Method | RB3LYP |
| Basis Set | 6-31G(d,p) |
| Charge | +1 |
| E(RB3LYP) | -214.18125945 a.u. |
| RMS Gradient Norm | 0.00003011 a.u. |
| Dipole Moment | 0.0001 Debeye |
| Point Group | C1 |
         Item               Value     Threshold  Converged?
 Maximum Force            0.000091     0.000450     YES
 RMS     Force            0.000022     0.000300     YES
 Maximum Displacement     0.001059     0.001800     YES
 RMS     Displacement     0.000260     0.001200     YES
 Predicted change in Energy=-8.244322D-08
 Optimization completed.
    -- Stationary point found.
 Low frequencies ---  -23.2389  -16.8558  -16.5585   -0.0006    0.0002    0.0005
 Low frequencies ---  173.1944  277.8178  283.0497
Although the system suggests it has not converged, which is unexpected considering the starting point was the converged system from the second optimisation above, the "zero" frequencies are with acceptable tolerances, around ±20-30, and no anomalies are seen in the vibration frequencies.
Molecular Orbital and NBO analysis
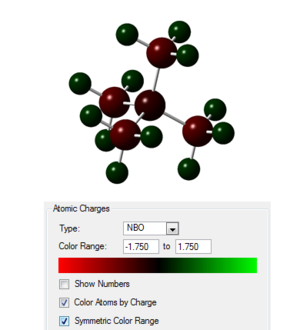
Taking the checkpoint file from the final optimisation the molecular orbitals of the system were calculated as well as the natural bond order, the published calculation is found at the following link [11]. The occupied orbitals were then visualised 5 of which are presented in the table below. In the image to the right the charges on the atoms are shown with the scale given.
| Molecular Orbital | Energy | Description |
|---|---|---|
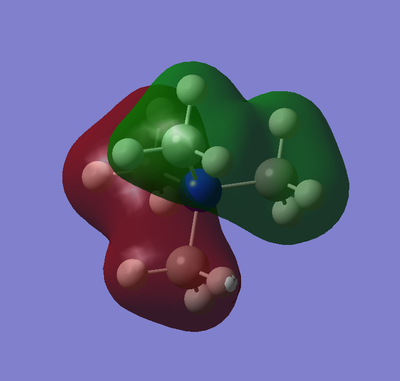 |
-0.92554 | This is a low energy bonding orbital which is similar to a p orbital having just one node on the central N atom. The orbital is almost symmetrical with a C2 to a first order approximation with the lobes are at an angle of 90° to one another. The symmetry is broken by the shape of the methyl groups causing variations in the "bumps" of the surface. The orbital shows strong bonding through-space interactions between the two methyl groups on each side of the central node. There are 2 other orbitals of the same energy which are the same as this but rotated so different groups are encompassed in the nodes. |
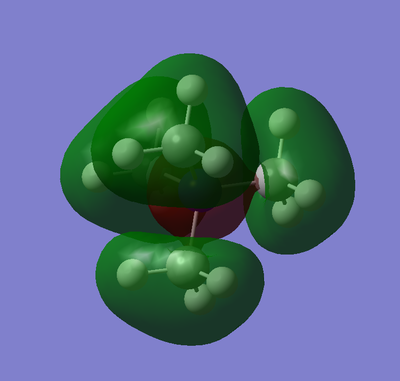 |
-0.80745 | This is a higher energy but still primarily bonding orbital, there are nodes on each of the C-N bonds but there is strong bonding of each of the methyl groups. The symmetry of this orbital is almost 3C3 with axis along the C-N bonds. There is strong bonding in the methyl groups for this orbital but there is no long distance through-space interactions in this orbital, the lobes are very localised. |
 |
-0.69894 | The 2 nodes in this orbital, on a carbon and a plane on the other nitrogen and carbon atoms, give it some antibonding character although the majority of the interactions are bonding. There is a bonding lobe on the carbon that is separated by a node, this lobe bonds the methyl group together. The middle lobe is though-space across the molecule based on the middle hydrogens. The final lobe shows through-space interactions between the remaining protons. This orbital is primarily formed by large diffuse lobes. |
 |
-0.58033 | This orbital is based on the methyl groups only and does not extend to the central carbon. The lobes of the MO are based on either one or two hydrogen atoms with each phase containing an equal number of atoms across the orbital. This orbital contributed to the bonding of the protons in the methyl groups but does not extend further than this, it is very localised to the methyl groups. |
 |
-0.57932 | This is the highest energy occupied orbital with 3 nodes. Each lobe of the orbital gives a layer of the molecular structure. There is a nodal plane across the base carbons (in the image) and 2 other nodes on the nitrogen and top carbon. The lower 2 lobes are through-space interactions of the hydrogen/carbon orbitals in plane. There are three degenerate orbitals that vary from this by symmetry. The orbital is very diffuse as it is spread across the whole species. |
A table of the NBO charges is given below:
| Atom | Charge |
|---|---|
| N | -0.295 |
| C | -0.483 |
| H | 0.269 |
The NBO population analysis was looked at and shows that the C-N bonds are 34% C based (21%=s, 79%=p) and 66% N based (25%=s, 75%=p) this suggests an interaction of formally sp3 orbitals on both the C and N. The slight change in the carbon orbitals from perfect, 25% s 75% p, leads to the small deviation in bond angle although this is almost negligible.
[P(CH3)4]+
3-21G optimisation
A molecule of [P(CH3)4]+ was optimised starting from the geometry of the [P(CH3)4]+ molecule yielding the following when published to Dspace,[12], with this log file,here. The following summary table and item table are found in the log file, the calculation took 2 minutes 27.0 seconds to complete:
| File Type | .log |
| Calculation Type | FOPT |
| Calculation Method | RB3LYP |
| Basis Set | 3-21G |
| Charge | +1 |
| E(RB3LYP) | -498.20552960 a.u. |
| RMS Gradient Norm | 0.00005789 a.u. |
| Dipole Moment | 0.0007 Debeye |
| Point Group | C1 |
         Item               Value     Threshold  Converged?
 Maximum Force            0.000165     0.000450     YES
 RMS     Force            0.000050     0.000300     YES
 Maximum Displacement     0.001512     0.001800     YES
 RMS     Displacement     0.000528     0.001200     YES
 Predicted change in Energy=-6.009204D-07
 Optimization completed.
    -- Stationary point found.
6-31G optimisation
Further optimisation to the 6-31G basis set was performed and gave the following published to Dspace, [13]. The log file is given here which led to the following summary and item tables, the job time is reported as 9 minutes 3.0 seconds:
| File Type | .log |
| Calculation Type | FOPT |
| Calculation Method | RB3LYP |
| Basis Set | 6-31G(d,p) |
| Charge | +1 |
| E(RB3LYP) | -500.82702380 a.u. |
| RMS Gradient Norm | 0.00004034 a.u. |
| Dipole Moment | 0.0009 Debeye |
| Point Group | C1 |
         Item               Value     Threshold  Converged?
 Maximum Force            0.000086     0.000450     YES
 RMS     Force            0.000030     0.000300     YES
 Maximum Displacement     0.001773     0.001800     YES
 RMS     Displacement     0.000519     0.001200     YES
 Predicted change in Energy=-1.361346D-07
 Optimization completed.
    -- Stationary point found.
Frequency Analysis
The optimised system was then calculated for the frequencies which gave the following when published to Dspace, [14] which shows no convergence:
         Item               Value     Threshold  Converged?
 Maximum Force            0.000132     0.000450     YES
 RMS     Force            0.000040     0.000300     YES
 Maximum Displacement     0.012117     0.001800     NO
 RMS     Displacement     0.003582     0.001200     NO
 Predicted change in Energy=-9.236659D-07
Using the opt=calcall method on the optimised system gave convergence with the log file here, on Dspace [15], the calculation job time is given as 39 minutes 40.8 seconds yielding the summary, item and low frequency tables below:
| File Type | .log |
| Calculation Type | FREQ |
| Calculation Method | RB3LYP |
| Basis Set | 6-31G(d,p) |
| Charge | +1 |
| E(RB3LYP) | -500.82697480 a.u. |
| RMS Gradient Norm | 0.00004374 a.u. |
| Dipole Moment | 0.0006 Debeye |
| Point Group | C1 |
         Item               Value     Threshold  Converged?
 Maximum Force            0.000113     0.000450     YES
 RMS     Force            0.000033     0.000300     YES
 Maximum Displacement     0.000854     0.001800     YES
 RMS     Displacement     0.000294     0.001200     YES
 Predicted change in Energy=-2.019002D-07
 Optimization completed.
    -- Stationary point found.
 Low frequencies ---  -41.8034  -13.3706   -0.0029   -0.0017    0.0011   14.3650
 Low frequencies ---  149.2513  184.3966  190.7164
This system has a C-P bond length of 1.82Å and C-P-C bond angle of 109.5°, with minor variations in the lower decimal places, the C-H bond lengths are given as 1.09Å with H-C-H bond angles of 109.0° and H-C-P bond angles of 109.9°.
Molecular Orbital and NBO analysis
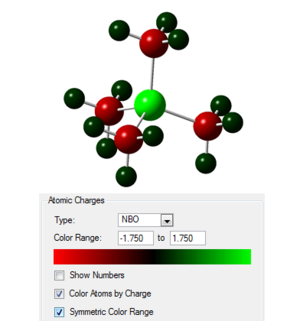
Taking the checkpoint file from the final optimisation the molecular orbitals of the system were calculated as well as the natural bond order, the published calculation is found at the following link [16]. The occupied orbitals were then visualised and are similar to those of the [N(CH3)4]+ system. In the image to the right the charges on the atoms are shown with the scale given.
A table of the NBO charges is given below:
| Atom | Charge |
|---|---|
| P | 1.667 |
| C | -1.060 |
| H | 0.298 |
The NBO population analysis was looked at and shows that the C-P bonds are 60% C based (25%=s, 75%=p) and 40% P based (25%=s, 74%=p, 1%=d) this suggests an interaction of formally sp3 orbitals on both the C and P.
[S(CH3)3]+
3-21G optimisation
A molecule of [S(CH3)3]+ was optimised starting from the geometry of ammonia yielding the following when published to Dspace,[17], with this log file, here. The following summary table and item table are found in the log file, the calculation took 1 minutes 56.3 seconds to complete:
| File Type | .log |
| Calculation Type | FOPT |
| Calculation Method | RB3LYP |
| Basis Set | 3-21G |
| Charge | +1 |
| E(RB3LYP) | -515.05233788 a.u. |
| RMS Gradient Norm | 0.00002728 a.u. |
| Dipole Moment | 1.2880 Debeye |
| Point Group | C1 |
         Item               Value     Threshold  Converged?
 Maximum Force            0.000108     0.000450     YES
 RMS     Force            0.000040     0.000300     YES
 Maximum Displacement     0.001640     0.001800     YES
 RMS     Displacement     0.000605     0.001200     YES
 Predicted change in Energy=-1.908775D-08
 Optimization completed.
    -- Stationary point found.
6-31G optimisation
Further optimisation to the 6-31G basis set was performed and gave the following published to Dspace,[18]. The log file is given here which led to the following summary and item tables, the job time is reported as 6 minutes 40.5 seconds:
| File Type | .log |
| Calculation Type | FOPT |
| Calculation Method | RB3LYP |
| Basis Set | 6-31G(d,p) |
| Charge | +1 |
| E(RB3LYP) | -517.68329133 a.u. |
| RMS Gradient Norm | 0.00002426 a.u. |
| Dipole Moment | 0.9650 Debeye |
| Point Group | C1 |
         Item               Value     Threshold  Converged?
 Maximum Force            0.000078     0.000450     YES
 RMS     Force            0.000026     0.000300     YES
 Maximum Displacement     0.000950     0.001800     YES
 RMS     Displacement     0.000224     0.001200     YES
 Predicted change in Energy=-2.806625D-08
 Optimization completed.

-- Stationary point found.
Frequency Analysis

The optimised system was then calculated for the frequencies which gave the following when published to Dspace,[19]which shows no convergence:
         Item               Value     Threshold  Converged?
 Maximum Force            0.000084     0.000450     YES
 RMS     Force            0.000024     0.000300     YES
 Maximum Displacement     0.007661     0.001800     NO
 RMS     Displacement     0.003187     0.001200     NO
 Predicted change in Energy=-4.420640D-07
Using the opt=calcall method on the optimised system gave convergence with the log file here, on Dspace[20], the calculation job time is given as 7 minutes 19.3 seconds yielding the summary, item and low frequency tables below:
| File Type | .log |
| Calculation Type | FREQ |
| Calculation Method | RB3LYP |
| Basis Set | 6-31G(d,p) |
| Charge | +1 |
| E(RB3LYP) | -517.68327861 a.u. |
| RMS Gradient Norm | 0.00002121 a.u. |
| Dipole Moment | 0.9651 Debeye |
| Point Group | C1 |
         Item               Value     Threshold  Converged?
 Maximum Force            0.000065     0.000450     YES
 RMS     Force            0.000025     0.000300     YES
 Maximum Displacement     0.001484     0.001800     YES
 RMS     Displacement     0.000506     0.001200     YES
 Predicted change in Energy=-1.351727D-07
 Optimization completed.
    -- Stationary point found.
 Low frequencies ---  -13.7218  -10.4420   -0.0038   -0.0027    0.0046   22.5558

 Low frequencies ---  158.5561  194.3859  197.8911
This system has a C-S bond length of 1.82Å and C-S-C bond angle of 102.7°, with minor variations in the lower decimal places, the C-H bond lengths are given as 1.09Å with H-C-H bond angles of 109.4° and H-C-S bond angles of 107.2° and 110.6°.
Molecular Orbital and NBO analysis

Taking the checkpoint file from the final optimisation the molecular orbitals of the system were calculated as well as the natural bond order, the published calculation is found at the following link[21]. The occupied orbitals were then visualised, again they are similar to the [N(CH3)4]+ system. In the image to the right the charges on the atoms are shown with the scale given.
A table of the NBO charges is given below:
| Atom | Charge |
|---|---|
| S | 0.917 |
| C | -0.846 |
| H | 0.297 |
The NBO population analysis was looked at and shows that the C-S bonds are 49% C based (s=20%, p=80%) and 51% S based (s=17%, p=82%, d=1%) this suggests an interaction of formally sp3 orbitals on both the C and S. There is also a lone pair on the S atom with 49% s character and 51% p character.
Comparison of Geometries, Charge Distribution and NBO
All of the C-H lengths are the same for all the molecules, 1.09Å, this is as expected as the methyl systems are removed from the changing heteroatom, X. The C-X bond lengths and C-X-C bond angles vary as shown in the table below:
| Heteroatom | C-X Bond length/ Å | C-X-C Bond angles |
|---|---|---|
| N | 1.51 | 109.5° |
| P | 1.82 | 109.5° |
| S | 1.82 | 102.7° |
The angles for N and P are typical of those for a tetrahedral structure as is expected as they are symmetrical in this way, at least around the central atom. The C-S-C bond angle is distorted as the molecule is trigonal pyramidal in structure and the lone pair pushes the methyl groups together. The bond lengths for C-P and C-S are similar which is mainly due to being in the same period and having similar bonding, 3s and 3p based. The C-N bonds are shorter as the bonds are formed by smaller, 2s and 2p, atomic orbitals.
The charge distribution across the cations is tabulated below:
| Heteroatom | Image showing charge distribution | Charge on X | Charge on C | Charge on H |
|---|---|---|---|---|
| N | 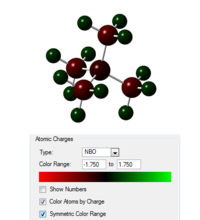 |
-0.295 | -0.483 | 0.269 |
| P | 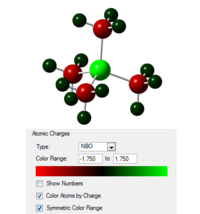 |
1.667 | -1.060 | 0.298 |
| S | 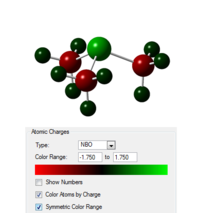 |
0.917 | -0.846 | 0.297 |
The protons are again not affected much by the changing hetero atom which would be due to the distance between the centre and the outlying methyl protons. The distribution of charges on the ammonium ion has a smaller range than the other ions, this is because the nitrogen is much more electronegative than the other central atoms, as it is in a higher period, this leads to the nitogen atom not carrying the formal positive charge which is instead spread across the system to the carbons and outlying protons. The protons themselves are slightly positively charged but as can be seen in the table the carbons are much less negatively charged, carry about half the charge, in the ammonium molecule than in the other two ions.
The other two ions, P and S based, have very similar distributions of charge with a high positive charge on the central atom, high negative charges on the carbons and lower positive charges on the remaining hydrogens. The charge on the phosphorus is also much higher than that on the sulfur again this would be due to the electronegativity of the sulfur being higher than that on the phosphorus making it less accepting of the positive charge.
The table below gives the NBO population analysis calculated contributions of the atomic orbitals for the C-X bonds:
| C-X bond | C orbital contribution | X orbital contribution |
|---|---|---|
| C-N | 34%(s=21%, p=79%) | 66%(s=25%, p=75%) |
| C-P | 60%(s=25%, p=75%) | 40%(s=25%, p=74%, d=1%) |
| C-S | 49%(s=20%, p=80%) | 51%(s=17%, p=82%, d=1%) |
The C-N bond has a 1:2 split in the contribution with the majority coming from the nitrogen orbitals this is in contrast to the other two species which favour the carbon or are equal in contribution. This is most likely due to the higher electronegativity and so more electron density is around the N atom. The C-P bonds are split 60:40 with more electron density on the carbon which is again due to electronegativity but in this case the carbon is the more electronegative atom. Carbon and sulfur have almost equal electronegativity and so contribute equal amounts to the bonding. The contribution also follows the trend in charges on the central atom with the more negative charge contributing more to the orbital.
The component orbitals for the bonds vary around 25:75 s:p character which is indicative of sp3 hybridisation. Orbitals on the P and S atoms have minor contributions from d orbitals which is due to the increased availability as the lowest lying d orbitals are closer in energy to the normally occupied orbitals for these atoms. The variation from 25:75 seen in the C-S bond is due to the geometry, bond angles are close to 90%, as the bonds approach right angles more p character is seen.
Deviations from ideal in the C-N components are again due to small deviations in the geometry with bond angles have small differences to ideal when the hydrogens are taken into account. This suggests that the hydrogens bond better to slightly more s character which leads to more p character to bond with the nitrogen.
The traditional description of an ammonium ion has the positive charge formally based on the nitrogen this is because the chemistry the system undergoes is based mostly on the central atom. However the calculations above suggests that the nitrogen is actually slightly negatively charged with the positive charge delocalised over the protons. This can be justified when we take the electronegativities of the atoms into account as nitrogen is very electronegative more negative charge is localised on it.
[N(CH3)3(CH2OH)]+
3-21G optimisation
A molecule of [N(CH3)3(CH2OH)]+ was optimised based on the structure without the donating group and yielded the following when published to Dspace,[22], with this log file,here. The following summary table and item table are found in the log file, the calculation took 4 minutes 44.2 seconds to complete:
| File Type | .log |
| Calculation Type | FOPT |
| Calculation Method | RB3LYP |
| Basis Set | 3-21G |
| Charge | +1 |
| E(RB3LYP) | -287.80630997 a.u. |
| RMS Gradient Norm | 0.00000937 a.u. |
| Dipole Moment | 1.7310 Debeye |
| Point Group | C1 |
         Item               Value     Threshold  Converged?
 Maximum Force            0.000034     0.000450     YES
 RMS     Force            0.000005     0.000300     YES
 Maximum Displacement     0.000744     0.001800     YES
 RMS     Displacement     0.000211     0.001200     YES
 Predicted change in Energy=-8.891950D-09
 Optimization completed.
    -- Stationary point found.
6-31G optimisation
Further optimisation to the 6-31G basis set was performed and gave the following published to Dspace,[23]. The log file is given here which led to the following summary and item tables, the job time is reported as 7 minutes 9.4 seconds:
| File Type | .log |
| Calculation Type | FOPT |
| Calculation Method | RB3LYP |
| Basis Set | 6-31G(d,p) |
| Charge | +1 |
| E(RB3LYP) | -289.39320012 a.u. |
| RMS Gradient Norm | 0.00002128 a.u. |
| Dipole Moment | 1.5794 Debeye |
| Point Group | C1 |
         Item               Value     Threshold  Converged?
 Maximum Force            0.000063     0.000450     YES
 RMS     Force            0.000010     0.000300     YES
 Maximum Displacement     0.000536     0.001800     YES
 RMS     Displacement     0.000151     0.001200     YES
 Predicted change in Energy=-2.393293D-08
 Optimization completed.
    -- Stationary point found.
Frequency Analysis
The optimised system was then calculated for the frequencies which gave the following when published to Dspace,[24]which shows convergence and so is assumed to be correct, the log file is givenhere. The calculation job time is given as 10 minutes 8.8 seconds yielding the summary, item and low frequency tables below:
| File Type | .log |
| Calculation Type | FREQ |
| Calculation Method | RB3LYP |
| Basis Set | 6-31G(d,p) |
| Charge | +1 |
| E(RB3LYP) | -289.39320012 a.u. |
| RMS Gradient Norm | 0.00002122 a.u. |
| Dipole Moment | 1.5794 Debeye |
| Point Group | C1 |
         Item               Value     Threshold  Converged?
 Maximum Force            0.000109     0.000450     YES
 RMS     Force            0.000021     0.000300     YES
 Maximum Displacement     0.000381     0.001800     YES
 RMS     Displacement     0.000139     0.001200     YES
 Predicted change in Energy=-2.735616D-08
 Optimization completed.
    -- Stationary point found.
 Low frequencies --- -101.6289  -22.3439  -13.4858   -7.7883   -0.0011   -0.0005

 Low frequencies ---    0.0007  120.9509  209.9539
The problem with this optimisation is that there is a large "zero" frequency which leads to an imaginary, negative, vibration which is not correct suggesting this is a transition state.
Reoptimisation to 6-31G(d,p)
As the minima was not attained a small adjust in the structure was made, the negative frequency was a movement of the O-H group and so this was rotated out of alignment slightly, and the system was optimised again giving, [25], which yielded the log file here after 24 minutes 21.4 seconds.The summary and item tables can be seen below:
| File Type | .log |
| Calculation Type | FOPT |
| Calculation Method | RB3LYP |
| Basis Set | 6-31G(d,p) |
| Charge | +1 |
| E(RB3LYP) | -289.39471435 a.u. |
| RMS Gradient Norm | 0.00000523 a.u. |
| Dipole Moment | 2.1354 Debeye |
| Point Group | C1 |
         Item               Value     Threshold  Converged?
 Maximum Force            0.000017     0.000450     YES
 RMS     Force            0.000004     0.000300     YES
 Maximum Displacement     0.000692     0.001800     YES
 RMS     Displacement     0.000154     0.001200     YES
 Predicted change in Energy=-7.010828D-09
 Optimization completed.
    -- Stationary point found.
Frequency Analysis of new structure
The newly optimised structure then had it's vibrational frequencies calculated to check that a minima was definitely found. The published calculation results are given, [26], as well as the log file [[Media:|here.]] The log file gives the following summary, convergence and low frequency tables, the calculation took 13 minutes 10.0 seconds to complete:
| File Type | .log |
| Calculation Type | FREQ |
| Calculation Method | RB3LYP |
| Basis Set | 6-31G(d,p) |
| Charge | +1 |
| E(RB3LYP) | -289.39471435 a.u. |
| RMS Gradient Norm | 0.00000526 a.u. |
| Dipole Moment | 2.1354 Debeye |
| Point Group | C1 |
         Item               Value     Threshold  Converged?
 Maximum Force            0.000017     0.000450     YES
 RMS     Force            0.000005     0.000300     YES
 Maximum Displacement     0.000998     0.001800     YES
 RMS     Displacement     0.000323     0.001200     YES
 Predicted change in Energy=-1.129517D-08
 Optimization completed.
    -- Stationary point found.
 Low frequencies ---  -11.9485   -0.0011   -0.0009   -0.0004    8.1459   14.2038
 Low frequencies ---  133.9935  214.0557  255.7518
Molecular Orbital and NBO analysis
Taking the checkpoint file from the final optimisation the molecular orbitals of the system were calculated as well as the natural bond order, the published calculation is found at the following link[27]. The log file from the calculation is given here the calculation took 3 minutes 14.3 seconds to complete.
The results of these calculations will be discussed in the analysis below.
[N(CH3)3(CH2CN)]+
3-21G optimisation
A molecule of [N(CH3)3(CH2CN)]+ was optimised based on the structure without the donating group and yielded the following when published to Dspace,[28], with this log file,here. The following summary table and item table are found in the log file, the calculation took 5 minutes 8.2 seconds to complete:
| File Type | .log |
| Calculation Type | FOPT |
| Calculation Method | RB3LYP |
| Basis Set | 3-21G |
| Charge | +1 |
| E(RB3LYP) | -304.72320496 a.u. |
| RMS Gradient Norm | 0.00000355 a.u. |
| Dipole Moment | 5.6210 Debeye |
| Point Group | C1 |
         Item               Value     Threshold  Converged?
 Maximum Force            0.000008     0.000450     YES
 RMS     Force            0.000002     0.000300     YES
 Maximum Displacement     0.000284     0.001800     YES
 RMS     Displacement     0.000073     0.001200     YES
 Predicted change in Energy=-1.226116D-09
 Optimization completed.
    -- Stationary point found.
6-31G optimisation
Further optimisation to the 6-31G basis set was performed and gave the following published to Dspace,[29]. The log file is given here which led to the following summary and item tables, the job time is reported as 11 minutes 55.5 seconds:
| File Type | .log |
| Calculation Type | FOPT |
| Calculation Method | RB3LYP |
| Basis Set | 6-31G(d,p) |
| Charge | +1 |
| E(RB3LYP) | -306.39377060 a.u. |
| RMS Gradient Norm | 0.00001828 a.u. |
| Dipole Moment | 5.7631 Debeye |
| Point Group | C1 |
         Item               Value     Threshold  Converged?
 Maximum Force            0.000049     0.000450     YES
 RMS     Force            0.000009     0.000300     YES
 Maximum Displacement     0.000918     0.001800     YES
 RMS     Displacement     0.000242     0.001200     YES
 Predicted change in Energy=-1.994786D-08
 Optimization completed.
    -- Stationary point found.
Frequency Analysis
The optimised system was then calculated for the frequencies which gave the following when published to Dspace,[30]which shows convergence and so is assumed to be correct, the log file is givenhere. The calculation job time is given as 15 minutes 25.1 seconds yielding the summary, item and low frequency tables below:
| File Type | .log |
| Calculation Type | FREQ |
| Calculation Method | RB3LYP |
| Basis Set | 6-31G(d,p) |
| Charge | +1 |
| E(RB3LYP) | -306.39377060 a.u. |
| RMS Gradient Norm | 0.00001839 a.u. |
| Dipole Moment | 5.7631 Debeye |
| Point Group | C1 |
         Item               Value     Threshold  Converged?
 Maximum Force            0.000055     0.000450     YES
 RMS     Force            0.000018     0.000300     YES
 Maximum Displacement     0.000450     0.001800     YES
 RMS     Displacement     0.000147     0.001200     YES
 Predicted change in Energy=-1.888310D-08
 Optimization completed.
    -- Stationary point found.
 Low frequencies ---   -7.6310   -0.0011   -0.0008   -0.0007    6.4450   17.3818

 Low frequencies ---   92.1142  154.6496  213.1335
These frequencies are acceptable and confirm the optimisation was successful.
Molecular Orbital and NBO analysis
Taking the checkpoint file from the final optimisation the molecular orbitals of the system were calculated as well as the natural bond order, the published calculation is found at the following link[31]. The log file from the calculation is given here the calculation took 2 minutes 18.9 seconds to complete.
The results of these calculations will be discussed in the analysis below.
NBO and MO analysis; the effect of EDGs and EWGs
The above calculations were performed to examine the effects of electron withdrawing and electron donating groups on the charge distribution and frontier orbitals of the ammonium ion. A table showing the charge distribution differences is given below the scale in the image is that the brightest red and brightest green correspond to -0.725 and +0.725:
| Molecule | Image showing charge distribution | Charge on N | Charge on C | Charge on H | Charge on O |
|---|---|---|---|---|---|
| [N(CH3)4]+ | 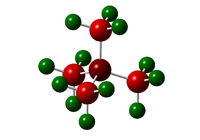 |
-0.295 | -0.483 | 0.269 | N/A |
| [N(CH3)3(CH2OH)]+ | 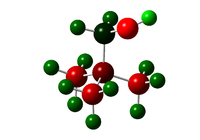 |
-0.322 | -0.493, 0.088(with EDG) | 0.266-0.272, 0.237-0.249(with EDG), 0.521(OH) | -0.725 |
| [N(CH3)3(CH2CN)]+ | 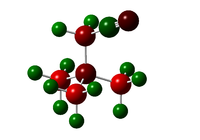 |
-0.289, -0.186(CN) | -0.485, -0.358(with EWG), 0.209(CN) | 0.269-0.282, 0.309(with EWG) | N/A |
The effect of electron withdrawing and electron donating groups is mostly localised to the site at which the group is attached. The OH, EDG, group itself is very polar with the most negative and most positive atoms in the structure being the O and H of this group respectively. The most extreme effect of the EDG is on the carbon to which the group is attached which has gone from a very negative charge about -0.5 to 0.1 this is due to the close O atom which is very electronegative and so draws electron density to it. The donating effect of the group is seen on the central N atom which has become slightly more negative when compared to the non-functionalised structure, -0.32 compared to -0.30, this is the donating effect of the hydroxy group.
The CN, EWG, group also has a strong dipole with the carbon of the group being positively charged when compared to all the other carbons in the molecule. The carbon with the EWG attached is less negatively charged when compared to the other carbons surrounding the central atom, this is the major effect of the electron withdrawing group pulling electron density to itself. The effect of the electron withdrawing group also extends to the central nitrogen which is less negatively charged when compared to the same atom in the system with no functional group.
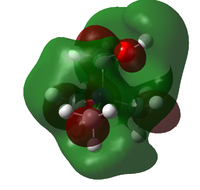
The HOMO and LUMO orbitals for the three ions are given in the table below:
| Molecule | HOMO | LUMO |
|---|---|---|
| [N(CH3)4]+ | 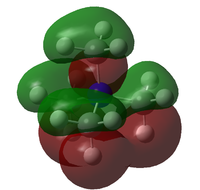 |

|
| [N(CH3)3(CH2OH)]+ | 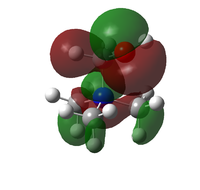 |
|
| [N(CH3)3(CH2CN)]+ | 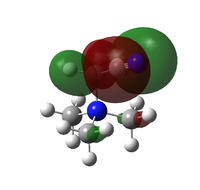 |

|
The general form of all the LUMO orbitals is the same with one very diffuse lobe of one phase spread across the molecule, the green lobe, and 5 or 6 lobes of the opposite phase, red lobes, localised around the carbon and nitrogen atoms. The orbital is overall very diffuse and anti-bonding with nodal surfaces around the carbon and hydrogen atoms. In the EDG and EWG species orbitals there is an extra lobe located on the functional group.
The HOMO orbitals have similar general structures but look very different because they vary in localisation. The HOMO orbitals for the non-functionalised and EDG species are the most similar but the lobes in the EDG system are smaller around the general structure but quite large and localised on the hydroxy group itself. The HOMO orbital for the EWG species is very localised on the nitrile group and has the structure of a π* orbital on the C-N triple bond, the other lobes are very small and will have little effect on the molecule.
References and citations
- ↑ 1.0 1.1 Gaussian 09, Revision C.01, M. J. Frisch, G. W. Trucks, H. B. Schlegel, G. E. Scuseria, M. A. Robb, J. R. Cheeseman, G. Scalmani, V. Barone, B. Mennucci, G. A. Petersson, H. Nakatsuji, M. Caricato, X. Li, H. P. Hratchian, A. F. Izmaylov, J. Bloino, G. Zheng, J. L. Sonnenberg, M. Hada, M. Ehara, K. Toyota, R. Fukuda, J. Hasegawa, M. Ishida, T. Nakajima, Y. Honda, O. Kitao, H. Nakai, T. Vreven, J. A. Montgomery, Jr., J. E. Peralta, F. Ogliaro, M. Bearpark, J. J. Heyd, E. Brothers, K. N. Kudin, V. N. Staroverov, T. Keith, R. Kobayashi, J. Normand, K. Raghavachari, A. Rendell, J. C. Burant, S. S. Iyengar, J. Tomasi, M. Cossi, N. Rega, J. M. Millam, M. Klene, J. E. Knox, J. B. Cross, V. Bakken, C. Adamo, J. Jaramillo, R. Gomperts, R. E. Stratmann, O. Yazyev, A. J. Austin, R. Cammi, C. Pomelli, J. W. Ochterski, R. L. Martin, K. Morokuma, V. G. Zakrzewski, G. A. Voth, P. Salvador, J. J. Dannenberg, S. Dapprich, A. D. Daniels, O. Farkas, J. B. Foresman, J. V. Ortiz, J. Cioslowski, and D. J. Fox, Gaussian, Inc., Wallingford CT, 2010.
- ↑ J. Blixt , J. Glaser , J. Mink , I. Persson , P. Persson and M. Sandstroem, J. Am. Chem. Soc., 1995, 117, 5104 DOI:10.1021/ja00123a011
- ↑ M. Atanasov and D. Reinen , J. Phys. Chem. A, 2001, 105, 5467 DOI:10.1021/jp004511j
- ↑ G. Santiso-Quiñones and I. Krossing, Zeitschrift für anorganische und allgemeine Chemie, 2008, 634, 704 DOI:10.1002/zaac.200700510


