Rep:Mod:JGH1998
Introduction to Molecular Modelling 2
Part 1: Optimisation
NH3
An optimisation of the molecule Ammonia was carried out using calculations from the program Gaussian. The results are listed in the table below:
| Calculation Method | RB3LYP |
| Basis Set | 6-31G(d,p) |
| Final Molecular Energy | -56.55776873 a.u. |
| RMS Gradient | 0.00000485 a.u. |
| Point Group | C3v |
In order to make sure the calculation was fully worked through, the following table from the calculation file was examined:
          Item               Value     Threshold  Converged?
 Maximum Force            0.000004     0.000450     YES
 RMS     Force            0.000004     0.000300     YES
 Maximum Displacement     0.000072     0.001800     YES
 RMS     Displacement     0.000035     0.001200     YES
 Predicted change in Energy=-5.986281D-10
 Optimization completed.
    -- Stationary point found.
                           ----------------------------
                           !   Optimized Parameters   !
                           ! (Angstroms and Degrees)  !
 --------------------------                            --------------------------
 ! Name  Definition              Value          Derivative Info.                !
 --------------------------------------------------------------------------------
 ! R1    R(1,2)                  1.018          -DE/DX =    0.0                 !
 ! R2    R(1,3)                  1.018          -DE/DX =    0.0                 !
 ! R3    R(1,4)                  1.018          -DE/DX =    0.0                 !
 ! A1    A(2,1,3)              105.7412         -DE/DX =    0.0                 !
 ! A2    A(2,1,4)              105.7412         -DE/DX =    0.0                 !
 ! A3    A(3,1,4)              105.7412         -DE/DX =    0.0                 !
 ! D1    D(2,1,4,3)           -111.8571         -DE/DX =    0.0                 !
 --------------------------------------------------------------------------------
Force is the derivative of an energy-distance graph, and so the system is at equilibrium when . From the information in the optimisation file above, we can see that the force converges with a gradient of near 0. This means our calculation went to completion, giving us a fully optimised structure.
NH3 |
The nitrogen atom in ammonia is sp3 hybridised, and so the pseudostructure is tetrahedral, with an expected bond angle of 109.5°. The optimised N-H bond length is 1.018Å. This is close to the literature value of 1.012Å[1] The optimised bond angle is 105.7412°. This smaller bond angle is expected from the tetrahedral pseudostructure , as the lone pair of electrons on the nitrogen atom repels the H-N bond, contracting the angle. This angle is smaller than the literature value of 106.67°.[1]
The full optimisation file for NH3 is linked to here.
Part 2: Vibrations and Charges
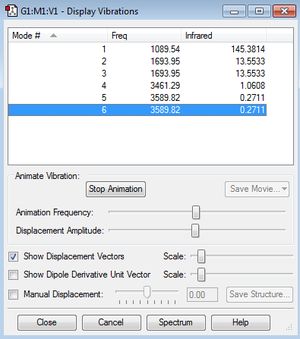
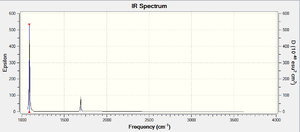
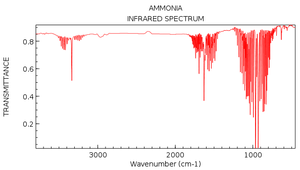
As expected by the 3N-6 rule, there are 6 modes of vibration (N=4 for a molecule of NH3). We can see modes 2 and 3 are degenerate, as well as modes 5 and 6. Modes 1, 2 and 3 are bending vibrations, and modes 4,5 and 6 are stretching vibrations. Mode 4 is a symmetrical stretching mode. Mode 1 is known as the umbrella mode as the H atoms open and close in the manner of an umbrella. In the experimental spectrum of gaseous ammonia, 4 bands would be expected, as there are 6 modes, with two pairs of degenerate modes. However, if you observe the infrared intensities in the table, mode 1 has an intensity of 145.3814. This large intensity is due to the nature of the vibration. At one extreme of the vibration in mode 1, the the molecule is planar, and so the net dipole moment is 0. At the other extreme, the dipole moment is very large. This gives a large change in dipole moment, which corresponds to the large intensity. The relative intensities of modes 4, 5 and 6 are so small in comparison to the intensity of mode 1, that they would not show on the spectrum. As modes 2 and 3 are degenerate, their intensities add up to 27.1066, which, relative to the intensity of mode 1, will be visible. We therefore expect most experimental spectra of gaseous ammonia only have 2 absorption bands at approximately 1100 cm-1 and 1700 cm-1, as seen in the calculated spectrum below. However, if we look at an actual IR spectrum of ammonia, we see a third peak at 3400-3500cm-1 which would correspond to modes 4, 5 and 6 [2]. N.B. The y-axis on the spectrum is transmittance, which is inversely related to absorbance (epsilon on the calculated graph). The x-axis is also inverted, which is standard for experimental IR spectra.
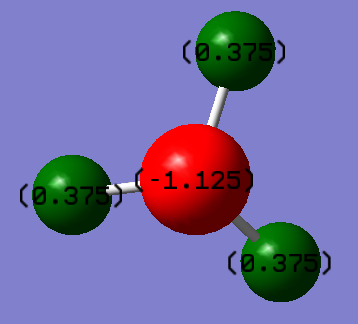
If NH3 were a completely ionic compound, we would expect the central nitrogen atom to have a charge of -3, and each hydrogen atom to have a charge of +1. However, ammonia is a covalent compound, and so electron density is shared between the atoms, based on their electronegativities. Nitrogen is very electronegative, and so will pull electron density towards it, resulting in a negative charge. This means that electron density is pulled away from the hydrogen atoms, resulting in them having a slight positive charge. The calculated charge distribution is shown below:
Part 3: Reaction and Orbitals
We can use energy values calculated in Gaussian to predict the energies of reactions. Here we will use calculations to predict the energy of the Haber-Bosch process.
N2
An optimisation of a nitrogen molecule was carried out. The results are listed in the table below:
| Calculation Method | RB3LYP |
| Basis Set | 6-31G(d,p) |
| Final Molecular Energy | -109.52412868 a.u. |
| RMS Gradient | 0.00000365 a.u. |
| Point Group | D∞h |
We can see that the calculation has gone to completion from the table below:
         Item               Value     Threshold  Converged?
 Maximum Force            0.000006     0.000450     YES
 RMS     Force            0.000006     0.000300     YES
 Maximum Displacement     0.000002     0.001800     YES
 RMS     Displacement     0.000003     0.001200     YES
 Predicted change in Energy=-1.248809D-11
 Optimization completed.
    -- Stationary point found.
                           ----------------------------
                           !   Optimized Parameters   !
                           ! (Angstroms and Degrees)  !
 --------------------------                            --------------------------
 ! Name  Definition              Value          Derivative Info.                !
 --------------------------------------------------------------------------------
 ! R1    R(1,2)                  1.1055         -DE/DX =    0.0                 !
 --------------------------------------------------------------------------------
The full optimisation file for N2 is linked to here.
N2 |
The optimised bond length of N2 was calculated to be 1.10550Å. This is very close to the literature value of 1.0975Å.[3]
There is one vibration, a symmetrical stretch at 2457.31cm-1. As there is no overall change in dipole moment, this vibration would not show on an infrared spectrum.
H2
An optimisation of a hydrogen molecule was carried out. The results are listed in the table below:
| Calculation Method | RB3LYP |
| Basis Set | 6-31G(d,p) |
| Final Molecular Energy | -1.17853936 a.u. |
| RMS Gradient | 0.00000017 a.u. |
| Point Group | D∞h |
We can see the calculation went to completion from the table below:
        Item               Value     Threshold  Converged?
 Maximum Force            0.000000     0.000450     YES
 RMS     Force            0.000000     0.000300     YES
 Maximum Displacement     0.000000     0.001800     YES
 RMS     Displacement     0.000001     0.001200     YES
 Predicted change in Energy=-1.164080D-13
 Optimization completed.
    -- Stationary point found.
                           ----------------------------
                           !   Optimized Parameters   !
                           ! (Angstroms and Degrees)  !
 --------------------------                            --------------------------
 ! Name  Definition              Value          Derivative Info.                !
 --------------------------------------------------------------------------------
 ! R1    R(1,2)                  0.7428         -DE/DX =    0.0                 !
 --------------------------------------------------------------------------------
The full optimisation file for H2 is linked to here.
H2 |
The optimised bond length of H2 was calculated to be 0.7428Å. This is very accurate, as the literature value for the bond length in a hydrogen molecule is 0.74Å.[4] There is one vibration, a symmetrical stretch at 4465.68cm-1. As there is no overall change in dipole moment, this vibration would not show on an infrared spectrum.
Calculating the Energy of the Haber-Bosch Process
This reaction is an equilibrium between Hydrogen, Nitrogen and Ammonia gas: N2 + 3H2 ⇌ 2NH3
E(NH3)= -56.55776873 a.u.
2*E(NH3)= -113.11553746 a.u.
E(N2)= -109.52412868 a.u.
E(H2)= -1.17853936 a.u.
3*E(H2)= -3.53561808 a.u.
ΔE=2*E(NH3)-[E(N2)+3*E(H2)]= -0.0557907 a.u.
Converting this into kJmol-1, we find that the energy of reaction is -146.47849401 kJmol-1. Compared to a literature value of -91.8kJmol-1, we have a much larger energy of reaction. This could be due to the method we used for calculating the energy of reaction. We may not have taken certain factors into account during calculations, resulting in a different calculated value to experimental. The reaction is very exothermic, implying that the ammonia product is more stable than the gaseous reactants.
Part 5: H2SiO
Optimisation
An optimisation of a molecule of H2SiO was carried out. The results are listed in the table below:
| Calculation Method | RB3LYP |
| Basis Set | 6-31G(d,p) |
| Final Molecular Energy | -365.90001403 a.u. |
| RMS Gradient | 0.00000941 a.u. |
| Point Group | C2v |
We can see the calculation went to completion from the table below:
         Item               Value     Threshold  Converged?
 Maximum Force            0.000023     0.000450     YES
 RMS     Force            0.000009     0.000300     YES
 Maximum Displacement     0.000022     0.001800     YES
 RMS     Displacement     0.000015     0.001200     YES
 Predicted change in Energy=-4.981720D-10
 Optimization completed.
    -- Stationary point found.
                           ----------------------------
                           !   Optimized Parameters   !
                           ! (Angstroms and Degrees)  !
 --------------------------                            --------------------------
 ! Name  Definition              Value          Derivative Info.                !
 --------------------------------------------------------------------------------
 ! R1    R(1,2)                  1.4865         -DE/DX =    0.0                 !
 ! R2    R(1,3)                  1.4865         -DE/DX =    0.0                 !
 ! R3    R(1,4)                  1.5317         -DE/DX =    0.0                 !
 ! A1    A(2,1,3)              111.6859         -DE/DX =    0.0                 !
 ! A2    A(2,1,4)              124.1571         -DE/DX =    0.0                 !
 ! A3    A(3,1,4)              124.1571         -DE/DX =    0.0                 !
 ! D1    D(2,1,4,3)            180.0            -DE/DX =    0.0                 !
 --------------------------------------------------------------------------------
The optimisation file for H2SiO is linked to here.
The final calculated structure is shown below, where the central atom (silicon) has a double bond to the red atom (oxygen):
H2SiO |
The silicon atom is sp2 hybridised, and so the molecule takes on a trigonal planar pseudostructure. The silicon-oxygen double bond has an optimised bond length of 1.5317Å and the silicon-hydrogen optimised bond length is 1.4865Å. The literature values for these bond lengths are 1.552Å and 1.507Å respectively. We would expect the bond angles in this molecule to be close to 120°, as the central silicon atom is sp2 hybridised. Calculations show the H-Si-O bond angle to be 124.1571°, and the H-Si-O bond angle to be 111.68588°. This respective increase and decrease in bond angle is expected, as the oxygen atom is surrounded by lone pairs of electrons, which repels the H-Si bond, increasing the H-Si-O bond. The literature values for these bond angles are 124.0° and 112.0° respectively. [5]
Vibrational Analysis

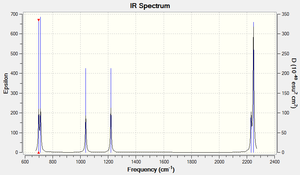
As expected by the 3N-6 rule, there are 6 modes of vibration in this molecule (N=4). Modes 1,2 and 3 are bending modes, and modes 5 and 6 are stretches. Mode 4 is a combination of a bend and a stretch. As the Si=O bond has a permanent dipole, all modes have a net dipole moment, even if they are symmetrical stretches (mode 5). This means all modes will be shown on the spectrum. Modes 1 and 2, as well as modes 3 and 4 are close in frequency, and so if the spectrum is not well resolved, it may only show 4 vibrations.
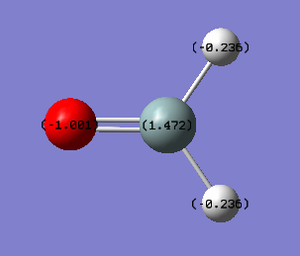
H2SiO is a covalent compound. Therefore we expect there to be electron density shared between atoms in the molecule. Oxygen and hydrogen are both more electronegative than silicon. This means that they both will pull electron density away from the central silicon atom, resulting in a positive charge on the silicon atom. This also means that the oxygen and hydrogen atoms will have a negative charge. However, as oxygen is more electronegative than hydrogen, the oxygen atom will have a lower charge than the hydrogen atoms.
Molecular Orbitals
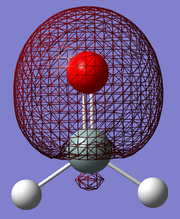
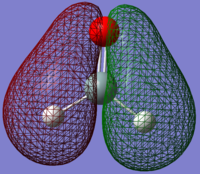
1: The first selected MO shows the σ-bond between the silicon and the oxygen atom. In this image, we can see that there is no electron density surrounding the hydrogen atoms. This shows that this orbital only acts in the bond between the silicon and oxygen atoms. This is formed by the oxygen 2s and the silicon sp2 atomic orbitals.
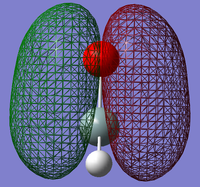
2: This MO shows the π-bond between the silicon and oxygen atoms. We can see in this that there is no electron density surrounding the hydrogen atoms. This shows that this orbital only acts in the bond between the silicon and oxygen atoms. This is formed by the oxygen 2p and the silicon 3p atomic orbitals.
3: This MO is the π*-antibonding orbital. It is the lowest unoccupied molecular orbital, and is therefore the orbital that accepts electron pairs to react. When a lewis base donates its pair of electrons into this orbital, the π-bond between the silicon and oxygen atoms breaks, giving the oxygen atom a negative charge. This is similar to the mechanism of nucleophilic addition to carbonyls.
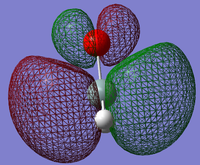
4: While this MO looks as if it is part of a π-bond between the silicon and oxygen, we can see that it surrounds the hydrogen atoms in electron density as well. This implies a mixing of the p orbitals on the oxygen atom and the s orbitals on the hydrogen atoms. This bonding MO is occupied, and so would help stabilise the Si-O double bond.
5: This MO is the corresponding antibonding orbital to MO 4. This is occupied, and so it makes the contribution to bonding of bonding MO (MO 4) redundant.
References
- ↑ 1.0 1.1 Herzberg, G., Electronic spectra and electronic structure of polyatomic molecules,Van Nostrand,New York, 1966.
- ↑ http://webbook.nist.gov/cgi/cbook.cgi?ID=C7664417&Type=IR-SPEC&Index=1
- ↑ Tables of Interatomic Distances and Configuration in Molecules and Ions, L.E. Sutton, ed., London: The Chemical Society, 1958.
- ↑ Roger L. DeKock; Harry B. Gray; Harry B. Gray (1989). Chemical structure and bonding. University Science Books. p. 199. ISBN 0-935702-61-X.
- ↑ http://www.colby.edu/chemistry/webmo/H2SiO.html

