Rep:Mod:JFelixMod2
Optimising a BH3 molecule
A borane molecule was optimised as shown. Its key values were as follows:
| BH3 optimisation (3-21G) | |
| File Type | .log |
| Calculation Type | FOPT |
| Calculation Method | RB3LYP |
| Basis Set | 3-21G |
| E(RB3LYP)/a.u. | -26.46226447 |
| RMS Gradient Norm/a.u. | 0.0000138 |
| Dipole Moment/Debye | 0.0001 |
| Point Group | C2V |
| Job cpu time/seconds | 54 |
The calculation took 54 seconds and yielded an incorrect point group calculation of C2v. However this is not too uncommon as a very high degree of accuracy is required to recognise correct point groups. The optimised bond distance was 1.94Å and the bond angle was 120°. The RMS gradient is below 0.001, implying that the optimisation was complete. This is confirmed by the item table from the log file:
         Item               Value     Threshold  Converged?
 Maximum Force            0.000027     0.000450     YES
 RMS     Force            0.000017     0.000300     YES
 Maximum Displacement     0.000164     0.001800     YES
 RMS     Displacement     0.000096     0.001200     YES
 Predicted change in Energy=-5.138746D-09
 Optimization completed.
    -- Stationary point found.
                           ----------------------------
                           !   Optimized Parameters   !
                           ! (Angstroms and Degrees)  !
 --------------------------                            --------------------------
 ! Name  Definition              Value          Derivative Info.                !
 --------------------------------------------------------------------------------
 ! R1    R(1,2)                  1.1944         -DE/DX =    0.0                 !
 ! R2    R(1,3)                  1.1944         -DE/DX =    0.0                 !
 ! R3    R(1,4)                  1.1944         -DE/DX =    0.0                 !
 ! A1    A(2,1,3)              119.9955         -DE/DX =    0.0                 !
 ! A2    A(2,1,4)              119.9955         -DE/DX =    0.0                 !
 ! A3    A(3,1,4)              120.009          -DE/DX =    0.0                 !
 ! D1    D(2,1,4,3)            180.0            -DE/DX =    0.0                 !
 --------------------------------------------------------------------------------
The optimised molecule was then further optimised with the more complex basis set 6-31G. Its key values were as follows:
| BH3 optimisation (6-31G(d,p)) | |
| File Type | .log |
| Calculation Type | FOPT |
| Calculation Method | RB3LYP |
| Basis Set | 6-31G(d,p) |
| E(RB3LYP)/a.u. | -26.61532374 |
| RMS Gradient Norm/a.u. | 0.00001791 |
| Dipole Moment/Debye | 0.0001 |
| Point Group | C2V |
| Job cpu time/seconds | 12 |
         Item               Value     Threshold  Converged?
 Maximum Force            0.000034     0.000450     YES
 RMS     Force            0.000017     0.000300     YES
 Maximum Displacement     0.000114     0.001800     YES
 RMS     Displacement     0.000071     0.001200     YES
 Predicted change in Energy=-3.683633D-09
 Optimization completed.
    -- Stationary point found.
                           ----------------------------
                           !   Optimized Parameters   !
                           ! (Angstroms and Degrees)  !
 --------------------------                            --------------------------
 ! Name  Definition              Value          Derivative Info.                !
 --------------------------------------------------------------------------------
 ! R1    R(1,2)                  1.1923         -DE/DX =    0.0                 !
 ! R2    R(1,3)                  1.1924         -DE/DX =    0.0                 !
 ! R3    R(1,4)                  1.1924         -DE/DX =    0.0                 !
 ! A1    A(2,1,3)              119.9985         -DE/DX =    0.0                 !
 ! A2    A(2,1,4)              119.9985         -DE/DX =    0.0                 !
 ! A3    A(3,1,4)              120.003          -DE/DX =    0.0                 !
 ! D1    D(2,1,4,3)            180.0            -DE/DX =    0.0                 !
 --------------------------------------------------------------------------------
Again the RMS gradient's being significantly below 0.1 and the item list confirm that the optimisation had run to completion (very quickly as compared to the first run, likely because the molecule had already been partially optimised). The new bond distance was 1.92Å while the bond angle remained 120° - a likely outcome for an archetypal trigonal planar molecule with 3 identical R groups.
The respective total energies for the 3-21G and 6-31G(d,p) basis sets are -26.46226447a.u. and -26.61532374. However, these two values cannot be compared to one another as the change in basis sets/pseudo-potentials has a huge effect on the total energy value.
Optimising a TlBr3 molecule
A molecule of Tl3 was optimised using a LANL2DZ pseudo-potential. The summary of the optimisation calculation is as follows:
| TlBr3 optimisation | |
| File Type | .log |
| Calculation Type | FOPT |
| Calculation Method | RB3LYP |
| Basis Set | LANL2DZ |
| E(RB3LYP)/a.u. | -91.21812851 |
| RMS Gradient Norm/a.u. | 0.0000009 |
| Dipole Moment/Debye | 0 |
| Point Group | D3H |
| Job cpu time/seconds | 39.3 |
         Item               Value     Threshold  Converged?
 Maximum Force            0.000002     0.000450     YES
 RMS     Force            0.000001     0.000300     YES
 Maximum Displacement     0.000022     0.001800     YES
 RMS     Displacement     0.000014     0.001200     YES
 Predicted change in Energy=-6.084014D-11
 Optimization completed.
    -- Stationary point found.
                           ----------------------------
                           !   Optimized Parameters   !
                           ! (Angstroms and Degrees)  !
 --------------------------                            --------------------------
 ! Name  Definition              Value          Derivative Info.                !
 --------------------------------------------------------------------------------
 ! R1    R(1,2)                  2.651          -DE/DX =    0.0                 !
 ! R2    R(1,3)                  2.651          -DE/DX =    0.0                 !
 ! R3    R(1,4)                  2.651          -DE/DX =    0.0                 !
 ! A1    A(2,1,3)              120.0            -DE/DX =    0.0                 !
 ! A2    A(2,1,4)              120.0            -DE/DX =    0.0                 !
 ! A3    A(3,1,4)              120.0            -DE/DX =    0.0                 !
 ! D1    D(2,1,4,3)            180.0            -DE/DX =    0.0                 !
 --------------------------------------------------------------------------------
The item table and RMS gradient values confirm that it has indeed converged, presumably on a minimum. The point group was identified correctly and the calculation time of 12 seconds, although smaller than for the simpler 6-31G(d,p) optimisation of BH3 can be explained by the calculation having been done on the HPC/SCAN system. The optimal Tl-Br bond distance is 2.65Å and the Br-Tl-Br angle was 120°.
Optimising a BBr3 molecule
Using a GEN Basis potential configured to use different pseudo-potentials for atoms of different sizes, a molecule of BBr3 was optimised:
| BH3 optimisation | |
| File Type | .log |
| Calculation Type | FOPT |
| Calculation Method | RB3LYP |
| Basis Set | Gen |
| E(RB3LYP)/a.u. | -64.43645277 |
| RMS Gradient Norm/a.u. | 0.00000397 |
| Dipole Moment/Debye | 0.0001 |
| Point Group | C2V |
| Job cpu time/seconds | 39.7 |
         Item               Value     Threshold  Converged?
 Maximum Force            0.000008     0.000450     YES
 RMS     Force            0.000005     0.000300     YES
 Maximum Displacement     0.000040     0.001800     YES
 RMS     Displacement     0.000025     0.001200     YES
 Predicted change in Energy=-4.333865D-10
 Optimization completed.
    -- Stationary point found.
                           ----------------------------
                           !   Optimized Parameters   !
                           ! (Angstroms and Degrees)  !
 --------------------------                            --------------------------
 ! Name  Definition              Value          Derivative Info.                !
 --------------------------------------------------------------------------------
 ! R1    R(1,2)                  1.934          -DE/DX =    0.0                 !
 ! R2    R(1,3)                  1.934          -DE/DX =    0.0                 !
 ! R3    R(1,4)                  1.9339         -DE/DX =    0.0                 !
 ! A1    A(2,1,3)              119.9963         -DE/DX =    0.0                 !
 ! A2    A(2,1,4)              120.0019         -DE/DX =    0.0                 !
 ! A3    A(3,1,4)              120.0019         -DE/DX =    0.0                 !
 ! D1    D(2,1,4,3)            180.0            -DE/DX =    0.0                 !
 --------------------------------------------------------------------------------
The optimisation has converged and examining the molecule in the .log file shows that the optimal bond distance and angle are 1.93Å and 120° respectively.
Comparison of bond distances
| Optimised Molecule | Bond distance/Å |
| BH3 | 1.91 |
| TlBr3 | 2.65 |
| BBr3 | 1.93 |
Boron and thallium are in the same group but thallium is significantly larger because it is further down the group. By extension this means its orbitals are more diffuse. For this reason it is less strongly bonded to bromine which is on a much more comparable size scale to boron.
Hydrogen and bromine are both non-metals, though bromine is more electronegative at 2.96 on the Pauling Scale vs 2.20 for hydrogen. Both of these are more electronegative than boron. As such, the B-H and B-Br bonds both have slight ionic character (more for Br) despite being mostly covalent.
Frequency analysis of a BH3 molecule
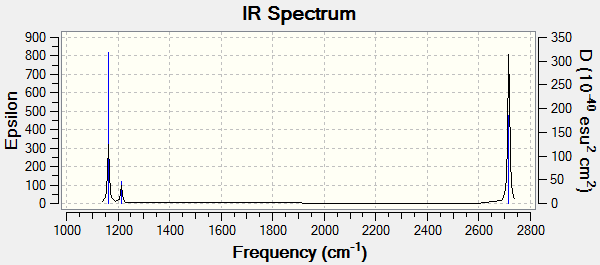
A frequency analysis of a borane molecule was carried out on Gaussian. The calculation summary and low frequency values for the analysis were as follows:
| BH3 frequency | |
| File Type | .log |
| Calculation Type | FREQ |
| Calculation Method | RB3LYP |
| Basis Set | 6-31G(d,p) |
| E(RB3LYP)/a.u. | -26.61532374 |
| RMS Gradient Norm/a.u. | 0.00001797 |
| Dipole Moment/Debye | 0.0001 |
| Point Group | C2V |
| Job cpu time/seconds | 52 |
Low frequencies ---   -7.2066   -3.8574   -0.0010   -0.0008   -0.0008   14.7798
Low frequencies --- 1162.9982 1213.2138 1213.2244
The total energy value is the same as the total energy value for the 6-31G(d,p) basis set optimisation - the molecule that the analysis was run on - confirming that the structure has been maintained and thus that the analysis has run correctly. Similarly, the RMS gradient is significantly below 0.001. The majority of the first line of low frequencies are acceptably near zero (the middle 4) and the largest, 14.7798cm-1 is in the region of two orders of magnitude smaller than the smallest non-zero low frequency, 1162.9982cm-1. All in all, it seems that this frequency analysis has been quite successful. The only slight problem is that the point group is listed as C2v, whereas the molecule actually has D3h symmetry. Enforcing this symmetry for the calculation would have slightly improved the results.
The predicted IR spectrum was as follows:
Frenquency analysis of a TlBr3 molecule
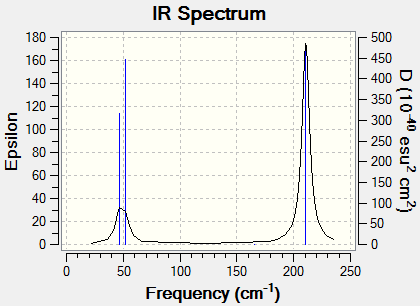
A frequency analysis of a molecule of Tl3 was carried out.
| TlBr3 frequency | |
| File Type | .log |
| Calculation Type | FREQ |
| Calculation Method | RB3LYP |
| Basis Set | LANL2DZ |
| E(RB3LYP)/a.u. | -91.21812851 |
| RMS Gradient Norm/a.u. | 0.00000088 |
| Imaginary Freq | 0 |
| Dipole Moment/Debye | 0 |
| Point Group | D3H |
| Job cpu time/seconds | 31.2 |
Low frequencies ---   -3.4213   -0.0026   -0.0004    0.0015    3.9367    3.9367
 Low frequencies ---   46.4289   46.4292   52.1449


