
Rep:Mod:JD26MGO
Introduction
Aim of the Study
Within this study General Utility Lattice Program (GULP) is used to determine the vibrational phonon modes, lattice energy, free energy and thermal expansion coefficient of the MgO crystal, these calculations are made using the Quasi Harmonic approximation and then molecular dynamic methods at varying temperatures to compare.
MgO Crystal Structure
Magnesium oxide crystal structure can be depicted as a primitive cell or a conventional cell. The conventional cell shows the face-centred cubic structure of the crystal whereas the primitive cell is a rhombohedron and is the simplest description of the crystal. The face-centred cubic structure simplifies the following calculations as the whole cell can be described by the lattice constants which due to Pythagoras theorem is the parameter of the primitive cell.
Reciprocal Space and k Vectors
Direct space descriptions are Fourier transformed into reciprocal space vectors.
This is useful due to the use of k points and vectors. All vibrations within the crystal structure are related to a particular k vector, and certain conformational energies can be determined using the k-point values and their relation to wavelength.
The main benefits of reciprocal space is related to X-ray diffraction and/or phonon modes.
Phonons
Phonos are packets of vibrational energy. The particle form of vibrational/ thermal energy. Phonos have both wave and particle like properties. Phonons are the best method to study energy within crystals due to the periodic nature.
Quasi-harmonic Approximation
The harmonic model is flawed and does not account for many effects which cause indications of untrue behaviour such as infinite thermal conductivity. To adapt this model the quasi-harmonic approximation is used which assumes the harmonic approximation at all crystal geometries, but the phonon frequencies are volume dependent. The ananharmonic factor causes the equilibrium bond length to be temperature dependent. This approximation better describes volume dependent thermal effects. This approximation tends to only be accurate around the crystals Debye constant which for MgO is 950K [1] , near the maximum of the temperature range tested.
Molecular Dynamics
This method is based on movement, deriving the movement from Newton's equations of motion taking into account the interatomic potentials and other forces. Therefore this method is classically based and works best near the classical limit, at low temperatures.[2]
Methodology
Calculations were performed in RedHat Linux using DLvisualize to display the structures and General Utility Lattice Program (GULP) to perform the calculations. GULP used for performing a variety of simulations on materials with various boundary conditions, for example 0D, 1D, 2D or 3D, 3D being the focus here. DLvisualize is useful for the construction and manipulation of the crystal structure and works well with General Utility Lattice Program.
Results and Discussion
Internal Energy of MgO crystal

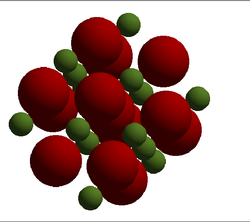
For the calculations it is best to define a unit cell, in this section calculations have been carried out on the primitive unit cell shown on the right. This is the simplest cell that can describe the crystal.Using QHA the free energy of the primitive cell at 0 K was calculated to be . This is the energy required to move all of the lattice atoms from the lattice structure to infinity. The energy of larger cells can now be found through multiplication. Within this calculation the Mg ion and Oxygen ion are assigned charges of +2 and -2 respectively and electrostatic potentials due to this are accounted for in the calculation. The primitive cell is a rhombohedron with a lattice parameter of a = 2.978 Å and internal angle α = 60°. The calculated cell vectors of this cell are also shown below in Table 1. The LogFile for this can be found here
| 0.00000 | 2.10597 | 2.10597 |
|---|---|---|
| 2.10597 | 0.00000 | 2.10597 |
| 2.10597 | 2.10597 | 0.00000 |
The conventional cell is shown in fig.2 with a FFC structure with a lattice constant of 4.212 Å and an internal angle of 90 degrees. The relationship between the primitive cell and the conventional cell is determined by Pythagoras.
Phonon Dispersion Curves of MgO

The phonon modes of MgO were calculated and presented using a dispersion curve. Phonons were computed at 50 k points along the path in k-space. The frequency of the phonon required to excite the vibration is plotted here against the symmetry points W, L, Γ, X, W, K. This dispersion graph shows 6 phonon lines or dispersion curve branches which matches well with literature[3].. The branches that do not tend to 0 at Γ are optic branches and relate to when the atoms move opposite to each other. The lower branches are in the acoustic region where the atoms move in phase, with the same amplitude and direction. The acoustic branches tend to zero as the wavelength tends to infinity, supported by the equation .
Phonon Density of States of MgO
The Density of States (DOS) is a simplified energy level diagram produced from summation over all states at one particular frequency. This average of all the k values produces an indication of the number of vibrational modes at one particular frequency, which indicated the distribution of phonons in terms of energy.
Theoretically to produce results of the highest accuracy an infinitely sized grid would be used but the calculations would be extensive and cost outweigh the small increase in accuracy. Therefore by increasing grid size slowly a compromise can be found where accuracy is to a negligible value <0.1 meV.
The DOS graph for the grid size 1x1x1shown in fig.4 shows 4 peaks, 2 around 300 cm-1 and 2 around 700-800 cm-1. If you compare the result of this single point DOS to fig.3 then the corresponding symmetry point would be L. The intensities also fit symmetry point L as the lower frequency peaks of higher intensity match the degenerate branches.
 |
 |
 |
 |
The 1x1x1 grid size does not give an accurate description of the DOS of MgO crystal structure therefore further calculation were carried out to determine an approachable yet accurate grid size. As grid size was increased the number of peaks increased and intensity decreased and then the peaks began to merge, very little change was seen about 25x25x25. After many calculations (not all shown here) it was determined that the accuracy increase above 25x25x25 was insignificant and therefore 25x25x25 was a good compromise and matches quite well with literature [4].
When comparing the MgO structure to other structures such as CaO, zeolite or a metal lattice, we need to take into account many varying properties. The interaction potentials and cell size in k space are particularly important properties which will effect the free energy and the suitability of 25x25x25 grid size. For CaO which has similar interaction potentials and cell size a 25x25x25 grid size should produce results of a similar accuracy.
Computing the Free Energy using the Quasi-Harmonic Approximation
| Grid Dimensions | Free Energy/eV | Accuracy/meV |  |
|---|---|---|---|
| 1x1x1 | -40.93030 | 0.1 eV | |
| 2x2x2 | -40.92661 | 0.1 eV | |
| 4x4x4 | -40.92645 | 0.5 meV | |
| 10x10x10 | -40.92648 | 0.1 meV | |
| 15x15x15 | -40.926482 | 0.1 meV | |
| 20x20x20 | -40.926483 | 0.1 meV | |
| 25x25x25 | -40.926483 | N/A |
The calculations completed above were repeated but at a higher temperature, 300K. The calculated free energy was then compared to the grid dimensions and corresponding accuracy. The free energy decreases with increasing grid size, this is explained using entropy and microstates as an increase in microstates causes a decrease in entropy and a decrease in the magnitude of free energy.
The accuracy increases with grid dimensions until it converges/ the accuracy value becomes insignificant.
The Thermal Expansion of Mgo
Here the MgO structure is optimised with respect to the free energy and then the free energy computed with QHA and the data produced compared with results using molecular dynamics.
Thermal expansion is the effect of temperature on the molecular/atomic vibration amplitudes which causes an increase in interatomic distance. As the vibrational amplitudes increase the cell size increases and expansion occurs. With QHA this is where the anharmonic effects are important as for a diatomic withe harmonic approximation no expansion would be expected, but QHA accounts for this expansion.
 |
 |
The Gibb's Free energy of the crystal was calculated using the QHA, a 25x25x25 grid and varying the temperature from 0 K to 1000 K at intervals of 100 K. The effect of temperature on the Free energy and lattice parameter were monitored and the graphs above describe the trends. Temperature and the free energy, as shown in fig.10, have a negative correlation, an increase in temperature causes an increase in the negative value of the free energy. This is explained by . The graph shows a non-linear trend, this could be due to limitations in the calculations, changes in pressure or due to the entropic temperature dependance causing a more complicated free energy and temperature relationship than expected.
Temperature and the lattice constant, as shown in fig.9, have a positive linear relationship with a good fit ( R2 =0.9786).
Molecular Dynamics
In the graphs shown below the QHA and MD trends with respect to Free Energy vs Temperature are very different but for Cell Volume vs Temperature the results are similar. Note that for the MolecularDynamics calculations a 2x2x2 super cell was required to ensure no destructive in phase loss of data. The results were then scaled so comparisons could be made.
Molecular dynamics is classical, Newtonian mechanics based and therefore the free energy is dependent on the kinetic and potential contributions of which kinetic energy is thermally dependent. Therefore the change of temperature is expected to cause and increase in free energy as shown below. This does not agree with the QHA results as QHA is quantum, thermodynamics based and the increasing entropy causes a decrease in free energy.
As QHA is harmonic oscillator based and therefore only accurate around the equilibrium point, at high temperatures it is assumed that the classical MD free energy results are more accurate but due to many assumptions the data does not match literature. [5]
 |
 |
QHA and MD produce similar results when it comes to thermal expansion especially between 300-1000K. At lower temperatures the anharmonicity is less prominent causing a diversion from the linear trend. For the linear sections similar thermal expansion coefficients are produced.
αV:QHA = 2.13 x10⁻⁵ K-1
αV:MD = 3.21 x10⁻⁵ K-1
Calculated from the gradient and intercept using : A low thermal expansion coefficient is expected due to MgO being isotropic because of the strong ionic bonding counteracting the thermal expansion. The values caculated are similar to valuse found in literature. [6] [7]
Assumptions of QHA and MD
The quasi-harmonic approximation and molecular dynamics theory are both based on many assumptions, a typical few such as the Born-Oppenheimer Approximation, that atoms are solid, spherical, charged are expected. These limit the accuracy of the calculations and cause differences with experimental values.
QHA and MD both are inaccurate around the MgO melting point due to neither being able to account for phase changes. QHA is inaccurate at higher temperatures as the approximation is suited to equilibrium conditions.
Accuracy is also limited by the need for efficient calculations, if more time was spared calculations of a much higher accuracy could be performed particularly for MD calculations.
Conclusion
Within this experiment the calculations were successfully carried out and results on the phonon modes, lattice energy, free energy and thermal expansion coefficient produced. Two approaches were compared, QHA and MD and the outcomes of each compared to literature. It was determined that at lower temperatures the QHA approach suited most, as these temperatures are around the equilibrium point. At higher temperatures the classical approach produces more accurate results.
References
- ↑ Stephen Stackhouse, Lars Stixrude, Bijaya B. Karki Thermal Conductivity of Periclase (MgO) from First Principles. PHYSICAL REVIEW LETTERS;104, 208501 (2010) DOI: 10.1103/PhysRevLett.104.208501
- ↑ Dominik Marx and Jürg Hutter,AB Initio Molecular Dynamics: Basic Theory and Advanced Methods,Cambridge University Press,978-1-107-66353-4,URL: http://assets.cambridge.org/97811076/63534/frontmatter/9781107663534_frontmatter.pdf
- ↑ M. J. L. S4NGSTER,t G. PECKHAM? and D. H. SAUNDERSONZ,Lattice dynamics of magnesium oxide,1970 J. Phys. C: Solid State Phys. 3 1026, URL : (http://iopscience.iop.org/0022-3719/3/5/017)
- ↑ A. Otero-de-la-Roza ∗, David Abbasi-Pérez, Víctor Luaña,Gibbs2: A new version of the quasiharmonic model code. II. Models for solid-state thermodynamics, features and implementation,Computer Physics Communications 182 (2011) 2232–2248,doi:10.1016/j.cpc.2011.05.009
- ↑ O. Madelung, U. Rössler, M. Schulz, Semiconductors · II-VI and I-VII Compounds; Semimagnetic Compounds,Condensed Matter,Volume 41B 1999,DOI: 10.1007/b71137
- ↑ R.S. Krishnan, R. Srinivasan, S. Devanarayanan,Thermal Expansion of Crystals,International Series in The Science of The Solid State, J. Appl. Phys, 1936, 7
- ↑ L. S. Dubrovinsky, S. K. Saxena, Thermal Expansion of Periclase (MgO) and Tungsten (W) to Melting Temperatures, Physics and Chemistry of Minerals,October 1997, Volume 24, Issue 8, pp 547-550,DOI 10.1007/s002690050070