Rep:Mod:JB713MgO
Third Year Computational lab: The Free Energy and Thermal Expansion of MgO
An MgO structure was loaded and analysed using DLVisualize in order to determine it's statistic mechanical properties. DLvisualize was used to display the structures with GULP being used to analyse and run the calculations. Internal energy, Phonon dispersion and Density of states were calculated with varying factors i.e. grid size and temperature to determine the relationship between the quantities and the given factors. Finally a molecular dynamics calculation was run to compare the thermal expansion via MD calculations and those carried out via the quasi-harmonic approximation.
Calculating the internal energy of an MgO crystal
A conventional cell of MgO was loaded into DLViz, an ionic potential model was chosen as the parameters for the calculation with shells not included and a single point chosen.
A conventional cell is the simplest possible cell with lattice vectors along the lattice point axes and differs from a primitive cell which, while generally being of a similar shape, exists around a singular lattice point. The conventional cell has 4 times the volume of the primitive and is more indicative of the actual structure and behaviour of MgO and thus was chosen.
This yielded an internal energy value of
Calculating the Phonon modes of MgO
The vibrations of the MgO structure were then analysed by calculating the phonon dispersion and density of states.
Another Conventional cell of MgO was loaded into DLViz and a GULP Phonon dispersion calculation was set up using 50 Npoints and Phonon eigenvectors included in the calculation. The calculation analyses the dispersion along the symmetry points of this can be seen in fig. 1
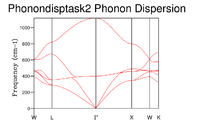
The phonon dispersion graph shows frequencies of the phonons at the given symmetry points in the lattice. The dispersion curve shows 3 Optical and 3 Acoustic modes. Optical vibrational modes are vibrations that cause the atoms to move in opposite directions upon excitation (Out of phase), this results in them having a non zero value at at which point the wave vector . There are 3 Acoustic vibrational modes observed in fig. 1, these arise from vibrations that cause the atoms to move in sync with one another i.e. the same direction (In phase), as the wavelength tends to infinity the phonon's frequencies converge to 0 at as given by the two relations below:
and where v is the frequency (s-1), c is the speed of light (ms-1), k is the wavevector and is the wavelength (m-1)
There are 3 Acoustic modes present which can in turn be split into two categories, transverse and longitudinal. There are two transverse modes which become degenerate between the symmetry points and and a single longitudinal mode.
The Density of states
The density of states is the number of states per energy at a given energy.
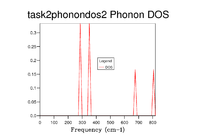
The DOS was calculated for a 1x1x1 grid by setting the shrinking factors to 1 for each axis. The resulting graph can be seen in fig. 2 it portrays 4 peaks, the pair between 270 and 370 cm-1 are twice the density of those between 650 and 820 cm-1. Comparison with fig. 1 suggests that the DOS is being calculated at symmetry point L, The phonon dispersion at the given frequencies are identical for the two graphs at L and the increased density of the peaks at the lower frequencies can be attributed to the double degeneracy of the dispersions at those frequencieswhich can be seen via the overlap of the phonon dispersions at the lower frequencies.
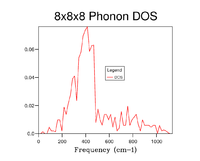
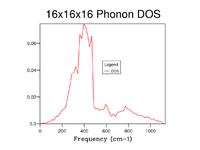
The Density of states was calculated at 7 different Grid sizes: 1x1x1, 2x2x2, 3x3x3, 4x4x4, 8x8x8, 16x16x16 and 32x32x32. Increasing the grid size results in a more accurate depiction of the Density of states for a given system, as can be seen in the graphs below the Density of states begins to add more peaks as the grid size increases and incrementally begins to form the more indicative DOS that can be seen in fig. 4 and fig. 5, which shows 16x16x16 and 32x32x32 respectively. The highest point of the DOS remains around 400 cm-1 consistently throughout the grid size with larger frequencies having generally lower densities, the key thing that changes is that the DOS goes from seemingly random jagged peaks to a more averaged structure. This is because by increasing the grid size, the number of K points that the DOS is calculated across is increased and thus the the average values for the DOS are made more accurate and encompass more of the system making them more accurate to what the DOS should be realistically, resembling more of a bell curve that favours low frequencies.


.
Looking at the graphs alone one can surmise that the 16x16x16 Grid size is the minimal suitable grid for a reasonable approximation of the DOS, the justification for this being that the DOS function resembles that of the most realistic and accurate 32x32x32 while calculating a lot faster, this means that for multiple calculations this ideal. That being said for the most accurate observed 32x32x32 is ideal as when testing above this there was very little difference to that point that graphs were near identical see fig. 5, despite also being a bit longer in duration than 16x16x16 it is no way slow and thus is feasible for the calculations run during the rest of this experiment. One thing to note is that for much larger grid sizes the time taken becomes completely unrealistic for any sort of experimental usage in the context of this experiment with 64x64x64 for example taking well over 10 minutes as opposed to the miniscule time of the 32x32x32 and 16x16x16.
Computing the Free energy
The HelmHoltz Free Energy of the systems was the calculated and analysed taking multiple grid sizes into account the same 7 grid sizes were used as well as n=48 at a set Temperature of 300K.
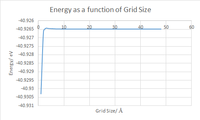
Table 1 below as well as fig. 6 shows the trend in the Free energy as the Grid size increases. There is an initial sharp increase in the free energy from n=1 to n=3 then gradually the expected trend is observed up until n=48, the trend observed shows the incremental decrease in the Helmholtz free energy with an increasing grid size, this can be rationalised by considering the formulae relating Helmholtz energy to internal energy, volume and entropy:
where A is the Helmholtz Free energy U is the internal energy and TS is the product of the temperature and Entropy
Thus as the volume increases via an increase in the grid size, the Internal energy component of Helmholtz gets smaller thus decreases, in addition if one was to look at the entropy from a statistical mechanical viewpoint
by increasing the grid size there are more available microstates for the system to take, the more microstates the greater the entropy and thus the greater the negative entropic contribution to the value of the Helmholtz free energy thus decreasing the overall helmholtz energy value. The key thing to take away is that the larger the grid size, the more k points taken into account hence a better average and thus the more accurate the value is for the system.

Extrapolating these trends and the theory behind the results to other materials is also possible take CaO, Calcium oxide is incredibly similar in structure to MgO but has a slightly larger lattice constant[1] of due to the larger size of Calcium relative to Magnesium as such when computing it in reciprocal space there are less K points required for the equivalent level of accuracy and as such a smaller grid is required to reach an energy value with the same degree of accuraacy, this is because a larger unit cell in real space correlates to a smaller brillouin zone. For CaO a 16x16x16 might be the most accurate as opposed to 32x32x32 for MgO. The case of a Zeolite is very similar but on a much larger scale as it has a lattice constant[2] of meaning by the same logic as for CaO, a much smaller grid would required for example 8x8x8 or even 4x4x4. Taking a metal into consideration is an interesting case as Metal form highly ordered structure with atoms rather than ions with delocalised electrons distributed throughout the system as opposed to being localised around positive ions and as such this would impact the coulombic interactions that are factored into the simulation thus despite Lithium for example having a lattice constant[3] of which is less than the experimental value of MgO one may have to use a larger than expected grid size to account for this difference in lattice.
| Grid Size nxnxn (n) | Energy eV |
|---|---|
| 1 | -40.930301 |
| 2 | -40.926609 |
| 3 | -40.926432 |
| 4 | -40.92645 |
| 8 | -40.926478 |
| 16 | -40.926482 |
| 32 | -40.926483 |
| 48 | -40.926483 |
The Thermal expansion of MgO
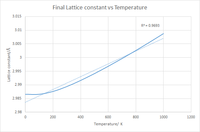
The Gibbs free energy of the system was calculated by loading a 32x32x32 MgO structure and changing the Optimisation opts to Optimise Gibbs Free energy and setting the shrinking factors to 32,32,32, the temperature was then varied between 0 and 1000 K to determine the effects of the temperature on the Free energy and the Lattice constant at a given Grid size. Table 2 and figs' 8 and 10show the trends in Gibbs free energy and Lattice constant with increasing temperature.
Taking the final lattice constants at the given temperatures and plotting them against the varying T can be seen in fig 8, this depicts a strong positive correlation between the lattice constant and the Temperature which is indicative of thermal expansion. The trend is initially gradual for 0 and 100 K then becomes a nearly perfectly linear trend between the two, including all of the data points gives an R2 value of 0.9693, excluding the first two data points gives an R2 value of 0.9945 as can be seen in fig 9, this suggests a very accurate correlation between the two, with the first two values being slightly different possibly due to limitation in the calculation but regardless of these two points the relationship is still significant and is expected. The thermal expansion observed is caused by the increasing thermal energy in turn increasing the kinetic energy of the molecules in the system resulting in larger vibrational and translational motion, consequently the average distance between the molecule becomes greater thus the higher the heat the greater the kinetic energy and separation.

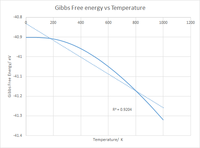
Plotting the Gibbs Free energy against the Temperature also yields the expected result that being the Free energy of the system decreases with increasing Temperature, this relationship can be derived mathematically as seen below:
Thus despite the Gibbs free energy increasing slightly with increasing volume, it is heavily outweighed by the entropic contribution due to the large temperature values, checking the log files confirms the expected positive entropy for the system and thus increasing the temperature further lowers the Gibbs Free energy. This can be seen in the graph by the initial gradual change in Free energy followed by a sharp near linear decrease with temperature suggesting a strong negative correlation. This is further enforced by an R 2 value of 0.9204 for all data points and a value of 0.9261 when isolating the mostly linear part of the curve. The fact that the curve isn't perfectly linear does suggest that the Pressure isn't constant as if it was the gradient would be exactly linear with a gradient of -S given by
Of course this could also be due to a limitation of the approximation however as it impossible to see from the log files if the pressure had changed it is hard to determine this.
Extrapolating this trend to the Melting point temperature [6], one would assume that Phonons would be a poor model to analyse a lattice as the Quasi-Harmonic approximation then begins to greatly deviate from the expected trend/values when a substance melts it goes from an ordered structure to a disordered one leading to a large increase in lattice constant and desynchronised vibrations which given that the QH approximation cant account for the random vibrations the results become insufficient and too inaccurate for comparison to experimental.
The thermal expansion in Quasi Harmonic is possible due to the Grüneisen[4] parameter which dictates the properties of a lattice based on the temperature it is also related to anharmonicity and gives an approximate idea of how much the system is affected by the anharmonicity. A perfectly harmonic system would not experience this and as such the thermal expansion would not be prevalent.

| Temperature K | Energy eV | Lattice constant |
|---|---|---|
| 0 | -40.901799 | 2.986563 |
| 100 | -40.90242 | 2.986563 |
| 200 | -40.909377 | 2.987604 |
| 300 | -40.928125 | 2.98939 |
| 400 | -40.958594 | 2.991629 |
| 500 | -40.999436 | 2.994134 |
| 600 | -41.049316 | 2.99682 |
| 700 | -41.107119 | 2.999643 |
| 800 | -41.171892 | 3.002587 |
| 900 | -41.243018 | 3.005634 |
| 1000 | -41.319849 | 3.008783 |
Calculating the Thermal expansion coefficients
Linear Thermal expansion coefficient:
Volumetric Thermal expansion coefficient:
One interesting thing to note about the linear and Volumetric is that they are related by a factor of approximately 3, actually 3.022, this suggests that Magnesium oxide is an isotropic[5] material which is consistent with the equal distortion/increase in the lattice constants as isotropic materials have equal expansion along each direction. Thus the formulae for Linear and Volumetric can be related by
Comparing these values to literature values one paper[7] given a range of 28-1000 °C or 301.15-1273.15 K which would result in a very similar to that in the experiment gave an averaged value of with the Linear and Volumetric coefficient at 293 and which are very close to the values obtained from the experiment, the deviation in average value is most likely due to the fact that the model used assumes that at every lattice constant the harmonic oscillator is applicable to the system whereas in reality this may not be the case.
Interestingly the experimental values at near room temperature for both Linear and Volumetric are within 0.0000005 and 0.000001 respectively. This suggests that over the range in this experiment the highest contribution is that of approximately room temperature as it correlates to that value in real experiments.
Molecular Dynamics
For the final part using a 32 Unit MgO cell the Thermal expansion was calculated via a Molecular Dynamics approach as opposed to the previous Quasi Harmonic approximation, it was set to an NPT ensemble in which the system has a constant Temperature, Pressure and number of Molecules. The Temperature was then varied from 0 - 1000 K once again in order to compare with the previous part of the experiment, with equilibration and production steps set to 500 each and 5 sampling and trajectory steps.
Not that to compare the Volumes, the volume of the MD calculation was divided by 32 to get the volume of a single unit cell. Hence fig. 12 shows the Volume per unit cell vs the Temperature.
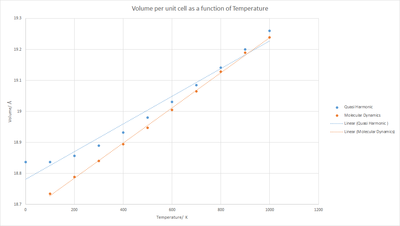
Both the Quasi Harmonic and Molecular Dynamics approaches show the exact same expected trend of an increasing volume with temperature, in general the Quasi Harmonic values are higher than those of the Molecular Dynamics values, this discrepancies consistently decreases with increasing temperature till 900 K at which point the values become almost equivalent, the trend lines also cross one another. The Quasi harmonic approximation treats every single lattice constant value as applicable to the Harmonic oscillator by using a method that makes the Phonon's behaviour and quantities dependent on volume whereas MD relies on time iterative positions and momenta based on initial conditions and factors in more complicated intermolecular interactions, via newtonian mechanics, than the Quasi harmonic approximation does. However it must be noted that due to the force field reliance of the MD method it tends to not account for quantum effects like tunneling[9]. It is very possible that the change in overall trend of towards the higher temperatures is due to the fact that Quasi Harmonic accounts for anharmonic behaviour[8] as it treats the system as a harmonic oscialltor and as such at the higher temperatures where the anharmonic contribution is more significant it would increase considerably slower than that of MD. Note that Anharmonicity is deviation from harmonic oscillatory behaviour so that the energy profile as a function of bond distance no longer resembles a simple potential well and instead at a given distance the potential increases much slower with the lattice constant. It is most commonly present at high energy and large lattice constants/bond separation, thus due to high temperatures increasing the energy it is logical to assume that this s a major factor in the change of the trend for the other temperature values at which Quasi is larger in value than MD. This would also help to account for the decrease of that discrepancy as the greater the temperature the larger the anharmonic contribution and as such the increase in volume is slower than that of the MD calculation. A major factor in this with respect to anharmonicity is the case of anharmonic decay [10] in phonons which is when phonons become lower in energy due to the anharmonicity of the system.
Conclusion
Overall this experiment was very successful, the trends and data observed were all as expected and comparable to actual experimental values with any deviation being either reasonable or down to the model used where the discrepancy can be explained. The Quasi-Harmonic approximation proved to provide suitable results which despite in some cases did deviate always maintained the predicted trends and tended to only deviate by very small amounts. Molecular dynamics wasn't utilised for all parts of the experiment but analysis of a 32 unit supercell provided with data that agreed with both the Quasi harmonic and experimental to a sufficient degree.
References
1. Demkov AA, Navrotsky A. Materials fundamentals of gate dielectrics. The Netherlands: Springer; 2005.
2. Stamires DN. Properties of the Zeolite, Faujasite, substitutional series: A review with new data. California: Imternational applied science; 1973.
3. Hermann K. Crystallography and Surface Structure: An Introduction for Surface Scientists and Nanoscientists. : Wiley-VCH Verlag GmbH & Co. KGaA; 2011.
4. Harris P, et al. Some physics of the Gruneisen parameter. New Jersey: National Technical Information Service; 1972.
5. Vinson JR. Plate and Panel structures of Isotropic, Composite and Piezoelectric Materials, including Sandwich Construction. Delaware: Springer; 2005.
6. Shukla K, Paskin A. Self-consistent and Quasiharmonic approximations: The equation of state and the high temperature instability. : Pergamon Press Ltd; 1982.
7. Bowles JFW, Howie RA, Vaughan DJ, Zussman J. Rock-forming Minerals: Non-silicates: oxides, hydroxides and sulphides, 2nd ed. London: The Geological Society; 2011.
8. Kitaigorodsky A. Molecular crystals and Molecules. New York: Academis Press INC; 1973.
9. Meller J. Molecular Dynamics. : Nature Publishing group; 2001.
10. Chatzakis I, Yan H, Song D, Berciaud S. Temperature dependence of the anharmonic decay of optical phonons in carbon nanotubes and graphite. USA: ; .
Appendix:


