
Rep:Mod:Inorganic ri3717 summer 2019
EX3
BH3 optimisation (3-21G)
-
 Optimised BH3 molecule

-
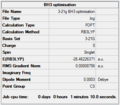 Summary table for optimised BH3 molecule

Item table for optimised BH3 moleucule
         Item               Value     Threshold  Converged?
 Maximum Force            0.000217     0.000450     YES
 RMS     Force            0.000105     0.000300     YES
 Maximum Displacement     0.000900     0.001800     YES
 RMS     Displacement     0.000441     0.001200     YES
 Predicted change in Energy=-1.635269D-07
 Optimization completed.
Total energy using 3-21G optimisation = -26.46226371 a.u.
BH3 optimisation (6-31G)
         Item               Value     Threshold  Converged?
 Maximum Force            0.000012     0.000450     YES
 RMS     Force            0.000008     0.000300     YES
 Maximum Displacement     0.000064     0.001800     YES
 RMS     Displacement     0.000039     0.001200     YES
 Predicted change in Energy=-1.131126D-09
 Optimization completed.
-
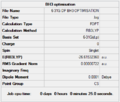 Summary table for optimised BH3 molecule

Total energy using 6-31G optimisation = -26.61532360 a.u.
Low frequencies table for for optimised BH3
 Low frequencies ---  -10.3498   -3.4492   -1.2454   -0.0055    0.4779    3.2165
 Low frequencies --- 1162.9519 1213.1527 1213.1554
Optimised BH3 molecule |
| Mode # | Wavenumber (cm-1) | Intensity (arbitrary units) | Symmetry | IR active? | Description |
|---|---|---|---|---|---|
| 1 | 1163 | 93 | A2 | yes | out-of-plane bend |
| 2 | 1213 | 14 | E | yes | bend |
| 3 | 1213 | 14 | E | yes | asymmetric bend |
| 4 | 2582 | 0 | A1 | no | symmetric stretch |
| 5 | 2716 | 126 | E | yes | asymmetric stretch |
| 6 | 2716 | 126 | E | yes | asymmetric stretch |
-
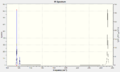 IR spectrum for BH3

In the IR spectrum for BH3, there appears to be three peaks (1163, 1213, 2716 cm]-1) although there are six vibrations. This is because some of the vibrations have very close or equal vibration frequencies, or zero intensity because the vibration is symmetrical and not IR active. Peaks from modes 2 and 3 overlap, so do 5 and 6, and mode 4 has zero intensity, resulting in three peaks in total.
MO diagram of BH3. Original image [1]
-
MO diagram for BH3
Important differences between the real and LCAO MOs are that real MOs are more diffuse and have an overall shape of the overlapping atomic orbitals.
Ng611 (talk) 20:36, 20 May 2019 (BST) This is too vague.
Qualitative MO theory is useful to a large extent when making predictions and understanding the interactions between how atomic orbitals interact to form molecular orbitals. However, there is still a need for us to understand that MO theory may not fully represent the actual orbital interactions.
NH3 optimisation (6-31G)
E(NH3)= -56.55776872 a.u.
E(BH3)= -26.61532360 a.u.
E(NH3BH3)= -83.22468893 a.u.
Association energy, ΔE=E(NH3BH3)-[E(NH3)+E(BH3)]
= -83.22468893 -[-56.55776872 -26.61532360]
= -0.05159661 a.u.
Based on the energy calculation above, the B-N dative bond is weak compared to other bonds such as C-C (~350 kJ/mol) or C-N (~300 kJ/mol).
Ng611 (talk) 20:38, 20 May 2019 (BST) Good comparisons, but PROVIDE A REFERENCE FOR YOUR VALUES
1 a.u.= 2625.5 kJ/mol
-0.05159661 a.u.= -135.466873 kJ/mol
Ng611 (talk) 20:38, 20 May 2019 (BST) Keep in mind the accuracy of your calculations (about 1 kJ/mol)
NI3 optimisation (GEN)
Link to my completed B3LYP/6-31G(d,p)LANL2DZ NI3 frequency file
File:Ri3717 GEN NI3 OPTIMISATION.LOG
-
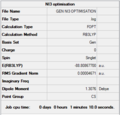 Summary table for optimised NI3 molecule

Item table for optimised NI3
         Item               Value     Threshold  Converged?
 Maximum Force            0.000061     0.000450     YES
 RMS     Force            0.000037     0.000300     YES
 Maximum Displacement     0.000459     0.001800     YES
 RMS     Displacement     0.000285     0.001200     YES
 Predicted change in Energy=-3.108653D-08
 Optimization completed.
Optimised NI3 Ion |
Optimised N-I distance= 2.18404
Mini project: Ionic liquids
[N(CH3)4]+, [P(CH3)4]+ optimisation (6-31G d,p)
Optimised [N(CH3)4]+ Ion |
File:RI3717 NCH34+ SYM OPT.LOG
-
![Summary table for optimised [N(CH3)4]+ ion](/images/thumb/d/df/Ri3717_NCH34%2B_6-31G_summary.PNG/120px-Ri3717_NCH34%2B_6-31G_summary.PNG) Summary table for optimised [N(CH3)4]+ ion
Summary table for optimised [N(CH3)4]+ ion
![Summary table for optimised [N(CH3)4]+ ion](/wiki/File:Ri3717_NCH34%2B_6-31G_summary.PNG)
Item table for optimised [N(CH3)4]+
         Item               Value     Threshold  Converged?
 Maximum Force            0.000132     0.000450     YES
 RMS     Force            0.000062     0.000300     YES
 Maximum Displacement     0.001114     0.001800     YES
 RMS     Displacement     0.000491     0.001200     YES
 Predicted change in Energy=-6.321232D-07
 Optimization completed.
Low frequencies table for optimised [N(CH3)4]+
 Low frequencies ---    0.0007    0.0011    0.0012   35.1707   35.1707   35.1707
 Low frequencies ---  218.6022  317.3460  317.3460
-
![Summary table for optimised [P(CH3)4]+ ion](/images/thumb/4/4d/Ri3717_PCH34%2B_6-31G_summary.PNG/120px-Ri3717_PCH34%2B_6-31G_summary.PNG) Summary table for optimised [P(CH3)4]+ ion
Summary table for optimised [P(CH3)4]+ ion
![Summary table for optimised [P(CH3)4]+ ion](/wiki/File:Ri3717_PCH34%2B_6-31G_summary.PNG)
Item table for optimised [P(CH3)4]+
         Item               Value     Threshold  Converged?
 Maximum Force            0.000035     0.000450     YES
 RMS     Force            0.000010     0.000300     YES
 Maximum Displacement     0.000241     0.001800     YES
 RMS     Displacement     0.000133     0.001200     YES
 Predicted change in Energy=-2.345703D-08
 Optimization completed.
Low frequencies table for optimised [P(CH3)4]+
 Low frequencies ---   -0.0031   -0.0008    0.0007   50.6301   50.6301   50.6302
 Low frequencies ---  187.9221  213.0069  213.0069
Comparing charge distribution
-
![Charge distribution for [N(CH3)4]+](/images/thumb/2/2b/Ri3717Charge_distribution%2C_n.PNG/120px-Ri3717Charge_distribution%2C_n.PNG) Charge distribution for [N(CH3)4]+
Charge distribution for [N(CH3)4]+
![Charge distribution for [N(CH3)4]+](/wiki/File:Ri3717Charge_distribution,_n.PNG)
-
![Charge distribution for [P(CH3)4]+](/images/thumb/9/96/Ri3717Charge_distribution%2C_p.PNG/120px-Ri3717Charge_distribution%2C_p.PNG) Charge distribution for [P(CH3)4]+
Charge distribution for [P(CH3)4]+
![Charge distribution for [P(CH3)4]+](/wiki/File:Ri3717Charge_distribution,_p.PNG)
| Charge distribution | Central atom (N or P) | C | H |
|---|---|---|---|
| [N(CH3)4]+ | -0.295 | -0.483 | +0.269 |
| [P(CH3)4]+ | +1.667 | -1.060 | +0.298 |
Electronegativity of N is 3.04[2], that of P is 2.19[3]. Considering the electronegativity of C, which is 2.55[4], C-N bond is expected to be polar with more electron density towards N, and C-P bond is polar with more electron density towards C. These are both reflected in the charge distribution of these ions in the table above.
[N(CH3)4]+: The charge distribution in C-N bond for [N(CH3)4]+ shows that C is about half negatively charged than the C in [P(CH3)4]+. This is because the carbon atoms in [N(CH3)4]+ is bonded to a strongly electronegative atom, N. The central N atom draws electron density towards itself, resulting in a slight negative charge of -0.295 even though the whole ion is positively charged. The positive charge is on the H atoms in the methl groups.
[P(CH3)4]+: In the bonding between C and P, more electron density is pulled towards the C atom as it is more electronegative than P. The central P atom experiences the pull of electron density from the four methyl groups, resulting in a +1.667 charge. H atoms also hold some positive charges.
Ng611 (talk) 20:42, 20 May 2019 (BST) Consider the effect of symmetry as well!
What does the "formal" positive charge on the N represent in the traditional picture?
It represents a +1 charge on the N atom, although in reality the charge is spread out on the whole ion. From the charge distribution obtained for [N(CH3)4]+ above, we can see that the positive charge is in deed not on the N atom but on hydrogen atoms.
Ng611 (talk) 20:47, 20 May 2019 (BST) This answer is too vague. You need to explain why this discrepancy exists.
On what atoms is the positive charge actually located for this cation?
There could be a slight positive charge on the substituents such as H (+0.298 for [N(CH3)4]+), but a significant amount of positive charge is located on N (+1.667 in the case of [N(CH3)4]+).
Three valence MOs, occupied
MO#20
-
 Molecular orbital #20

Bonding orbital
-
Formation of molecular orbital #20
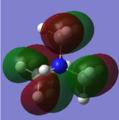
MO#17
-
 Molecular orbital #17

partially antibonding -- C-N interactions are antibonding through space.
-
Formation of molecular orbital #17
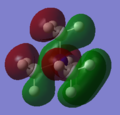
MO#16
-
 Molecular orbital #16

partially antibonding -- C-N interactions are antibonding through space.
-
Formation of molecular orbital #16
Ng611 (talk) 20:46, 20 May 2019 (BST) Your LCAOs look good, although your FOs in MO 20 look to be oriented incorrectly. Your other two MOs, though correct, are very similar. A wider variety of MOs would have improved this further, as would labelling your interactions.
References
- ↑ Hunt, Patricia. “Lecture 4 Tutorial Problem Model Answers.” 9 May 2019.
- ↑ Winter, Mark. “Nitrogen: Electronegativity.” WebElements Periodic Table, WebElements Ltd, www.webelements.com/nitrogen/electronegativity.html.
- ↑ Winter, Mark. “Phosphorus: Electronegativity.” WebElements Periodic Table, WebElements Ltd, www.webelements.com/phosphorus/electronegativity.html.
- ↑ Winter, Mark. “Carbon: Electronegativity.” WebElements Periodic Table, WebElements Ltd, www.webelements.com/carbon/electronegativity.html.