Rep:Mod:Inorganic mm1517
BH3
3-21G Basis Set
Method: B3LYP
Summary table
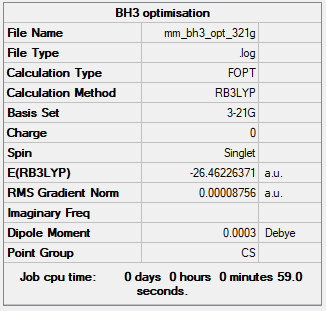
The optimisation was successful, as the gradient is below 0.001. However, the point group was not as expected, it is Cs instead of D3h. Very small differences in the x, y and z coordinates result in a breakage of symmetry causing the incorrect point group. Additionally, Gaussian requires incredibly accurate numbers to get the precise symmetry of the molecule, something not achieved by merely building the molecule and running a basic optimisation.
Energy of BH3 at 3-21G basis set = -69477 kJmol-1
Optimisation Table
         Item               Value     Threshold  Converged?
 Maximum Force            0.000217     0.000450     YES
 RMS     Force            0.000105     0.000300     YES
 Maximum Displacement     0.000919     0.001800     YES
 RMS     Displacement     0.000441     0.001200     YES
The table shows that the forces and displacements have successfully converged, so the optimisation is complete. This also informs us that the placements have converged, meaning that for a small displacement the energy remains unchanged.
Jmol Dynamic Image
Optimised BH3 at 3-21G |
6-31G Basis Set
Method: B3LYP
Summary table
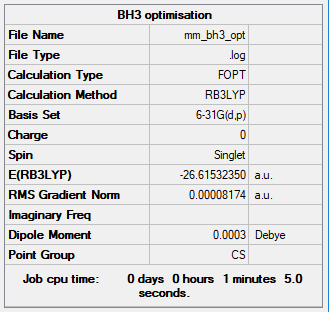
The optimisation was successful due to the gradient value being lower than 0.001. However, like the basis set 3-21G, the point group is Cs instead of D3h. The cause of this is the same for both basis sets, that differences inn the x, y and z coordinates result inn a breakage of symmetry, leading to an incorrect point group assignment.
Energy of BH3 at 6-31G basis set = -69879 kJmol-1
The energy of BH3 at 6-31G basis set cannot be compared to that of 3-21G, as they are in different basis sets.
Optimisation Table
        Item               Value     Threshold  Converged?
 Maximum Force            0.000203     0.000450     YES
 RMS     Force            0.000098     0.000300     YES
 Maximum Displacement     0.000653     0.001800     YES
 RMS     Displacement     0.000415     0.001200     YES
Both the force and displacement successfully converged, providing further evidence that the optimisation went to completion.
Jmol Dynamic Image
Optimised BH3 at 6-31G |
Frequency
Frequency file: MM BH3 FREQ 631G.LOG
Vibrational Spectrum
Low frequencies ---   -0.1187   -0.0049   -0.0012   42.2482   42.2484   43.3387
Low frequencies --- 1163.5889 1213.5519 1213.5521
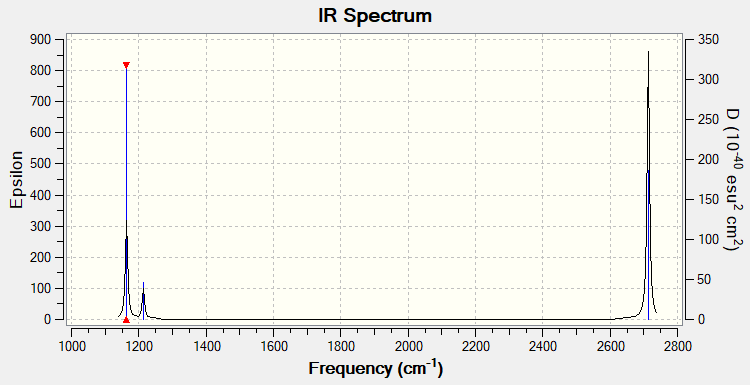
| Wavenumber (cm-1 | Intensity (arbitrary units) | Symmetry | IR active? | Type |
| 1164 | 93 | A2' ' | Yes | Out-of-plane bend |
| 1214 | 14 | E' | Very slight | In-plane bend |
| 1214 | 14 | E' | Very slight | In-plane bend |
| 2580 | 0 | A1' | No | Totally symmetric stretch |
| 2713 | 126 | E' | Yes | Asymmetric stretch |
| 2713 | 126 | E' | Yes | Asymmetric stretch |
6 vibrational frequecies are reported in the Gaussian file, however only 3 vibrations are observed on the graph. The peak at 1164 cm-1 corresponds to the A2' ' symmetry, which has a high intensity resulting in the tall height of the peak, and is IR-active so is seen. The two E' bends seen at 1214 cm-1 are degenerate, so are seen as a single peak with low intensity. However the A1' stretch at 2580 cm-1 is not observed. As this stretch is symmetric, there is no change in dipole moment and thus it is not IR active, so is not observed on the spectrum. Finally, the two E' asymmetric stretches at 2713 cm-1 are degenerate, so are seen as a single peak of high intensity.
Good explanation of the observed spectra and clearly identifying the peaks. Smf115 (talk) 22:28, 31 May 2019 (BST)
Frequency Summary Table
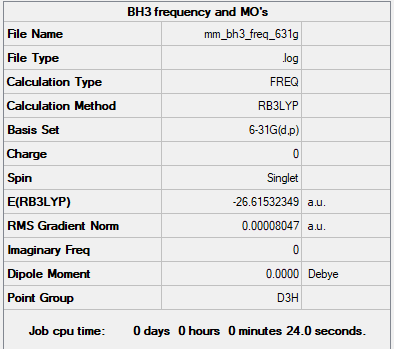
Frequency analysis is reliable and has gone to completion, as the gradient is lower than 0.001. In order to do the frequency analysis, the point group had to be changed from Cs to D3h, which was done by constraining the symmetry to D3h and re-running the optimisation.
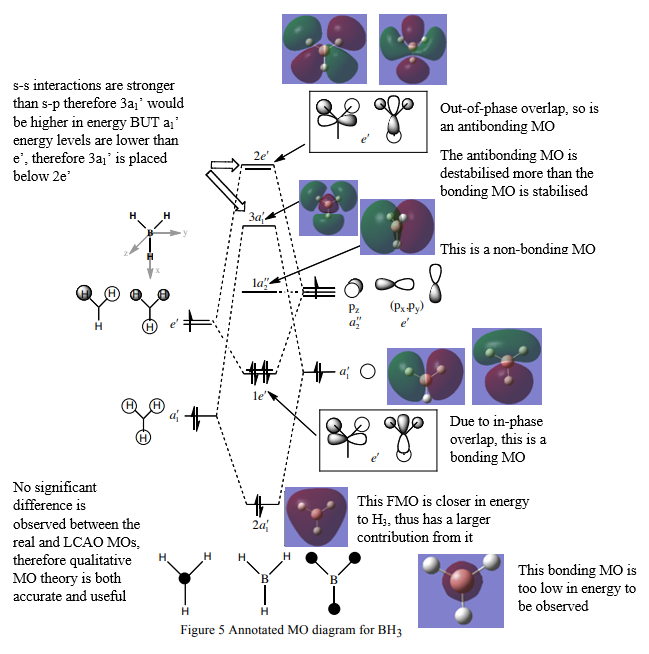
MO Diagram
This diagram was taken from Professor Hunts Lecture 4 Tutorial Problem Model Answers.
Link: http://www.huntresearchgroup.org.uk/teaching/teaching_comp_lab_year2a/Tut_MO_diagram_BH3.pdf
Good inclusion of the calculated MOs on the diagram, however, you haven't discussed the similarities and differences between the calculated MOs and the LCAOs. Smf115 (talk) 22:38, 31 May 2019 (BST)
Association Energies
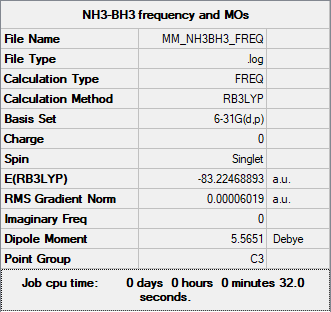
The energy of optimised BH3 at 6-31G was found to be -69879 kJmol-1 In order to compute a reaction energy, the energies of NH3 and NH3-BH3 are additionally required.
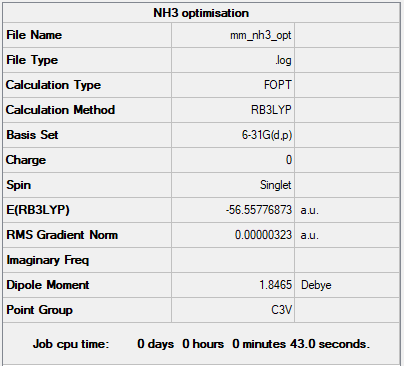
NH3
Method: B3LYP
Basis set: 6-31G
Summary Table
Energy of NH3 at 6-31G basis set = -148492 kJmol-1
Optimisation Table
        Item               Value     Threshold  Converged?
 Maximum Force            0.000006     0.000450     YES
 RMS     Force            0.000003     0.000300     YES
 Maximum Displacement     0.000013     0.001800     YES
 RMS     Displacement     0.000007     0.001200     YES
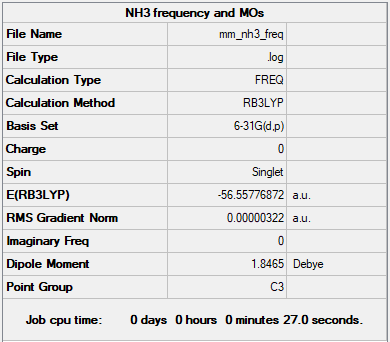
Frequency Analysis
Frequency file - File:MM NH3 FREQ.LOG
Low frequencies ---   -0.0138   -0.0032   -0.0015    7.0783    8.0932    8.0937
Low frequencies --- 1089.3840 1693.9368 1693.9368
As the energies in the summary table and the frequency analysis table are identical up to the final 2 decimal places, it is confirmed that the minimum was found.
Jmol Dynamic Image
Optimised NH3 at 6-31G |
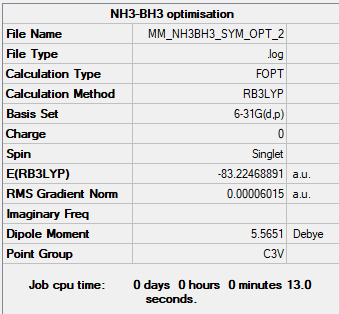
NH3-BH3
Method: B3LYP
Basis set: 6-31G
Summary Table
Energy of NH3-BH3 at 6-31G basis set = -218506 kJmol-1
Optimisation Table
        Item               Value     Threshold  Converged?
 Maximum Force            0.000115     0.000450     YES
 RMS     Force            0.000060     0.000300     YES
 Maximum Displacement     0.000569     0.001800     YES
 RMS     Displacement     0.000345     0.001200     YES
Frequency Analysis
Frequency file: MM NH3BH3 FREQ.LOG
Low frequencies ---   -0.0249   -0.0032   -0.0005   17.1466   17.1490   37.2133
Low frequencies ---  265.8038  632.2133  639.3565
As the energies are identical up to the final 2 decimal places, it is confirmed that the minimum was found.
Jmol Dynamic Image
Optimised NH3-BH3 at 6-31G |
Calculation of Association Energy
E(BH3) = -26.61532350 a.u.
E(NH3) = -56.55776873 a.u.
E(NH3BH3) = -83.22468891 a.u.
ΔE = E(NH3BH3) - [E(NH3) + E(NB3)] = -0.05159668 a.u. = -135 kJmol-1
The B-N bond in ammonia borane is dative, with the nitrogen donating a lone pair of electrons to the electron deficient boron atom. Due to the large electronegativity difference between boron and nitrogen, the assumption that the bond has ionic character can be made. -135 kJmol-1 is a moderately weak bond when compared to a C-C bond in isoelectronic ethane, which has an association energy of about 350 kJmol-1 [1]
[1] - J. E. Huheey, E. A. Keiter, and R. L. Keiter, Inorganic Chemistry, 4th ed. (1993).
Correct calculation with the final reported energy value given to the right degree of accuracy and great comparison to a relevant and referenced literature value! Smf115 (talk) 22:34, 31 May 2019 (BST)
NI3
Method: B3LYP
Basis set: GEN
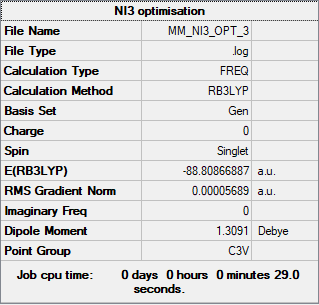
Optimised N-I distance = 2.183 Å
Iodine has a significantly larger radii than nitrogen, as it is low down in Group 7. Therefore due to their mis-matched orbital sizes, the orbital overlap is inefficient, meaning the N-I bond distance increases and the strength of the bond weakens.
Summary Table
Energy of NI3 at GEN basis set = -233167 kJmol-1
Optimisation Table
         Item               Value     Threshold  Converged?
 Maximum Force            0.000084     0.000450     YES
 RMS     Force            0.000062     0.000300     YES
 Maximum Displacement     0.001258     0.001800     YES
 RMS     Displacement     0.000609     0.001200     YES
Frequency
Low frequencies ---   -1.7762   -1.7378   -0.7562   -0.0031    0.0322    0.0731
Low frequencies ---  101.3566  101.3572  148.4310
Frequency file: MM NI3 OPT 3.LOG
Jmol Dynamic Image
Optimised NI3 at GEN |
Correct implementation of the pseudopotential here, just note that Gen isn't the basis set used, it is the keyword which tells Gaussian to read in a user-defined basis set/pseudopotential. Overall, a very good section 1 which is only let down by the presentation in places, while it is nice that you've documented all the calculation steps of the lab (e.g. 3-21G initial BH3 optimisation), they aren't really relevant to the content of the report itself. Smf115 (talk) 22:41, 31 May 2019 (BST)
Ionic Liquids
[N(CH3)4]+
Method: B3LYP
Basis set: 6-31G
Summary Table
Energy of [N(CH3)4]+ at 6-31G basis set = -562333 kJmol-1
Optimisation Table
         Item               Value     Threshold  Converged?
 Maximum Force            0.000015     0.000450     YES
 RMS     Force            0.000008     0.000300     YES
 Maximum Displacement     0.000212     0.001800     YES
 RMS     Displacement     0.000081     0.001200     YES
Frequency
Frequency file: MM N4 FREQ.LOG
Low frequencies ---    0.0013    0.0013    0.0014   21.4206   21.4206   21.4206
Low frequencies ---  188.2035  292.4104  292.4104
Jmol Dynamic Image
Optimised [N(CH3)4]+ at 6-31G |
[P(CH3)4]+
Method: B3LYP
Basis set: 6-31G
Summary Table
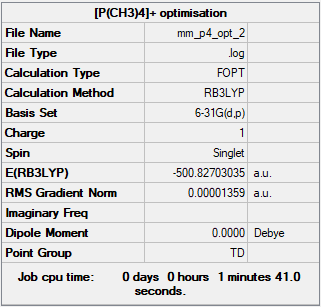
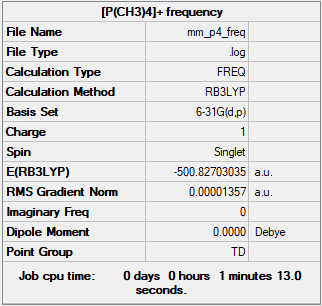
Energy of [P(CH3)4]+ at 6-31G basis set = -1314921 kJmol-1
Optimisation Table
         Item               Value     Threshold  Converged?
 Maximum Force            0.000064     0.000450     YES
 RMS     Force            0.000015     0.000300     YES
 Maximum Displacement     0.000147     0.001800     YES
 RMS     Displacement     0.000109     0.001200     YES
Frequency
Frequency file: MM P4 FREQ.LOG
Low frequencies ---    0.0030    0.0039    0.0040   24.0415   24.0415   24.0415
Low frequencies ---  159.9379  194.7249  194.7249
Jmol Dynamic Image
Optimised [P(CH3)4]+ at 6-31G |
Excellent presentation of your structure information and good calculations. Smf115 (talk) 15:54, 2 June 2019 (BST)
Charge Comparison of [N(CH3)4]+ and [P(CH3)4]+
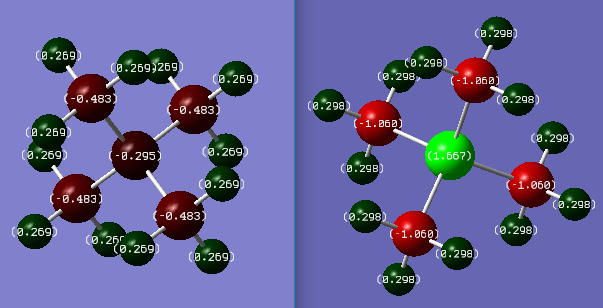
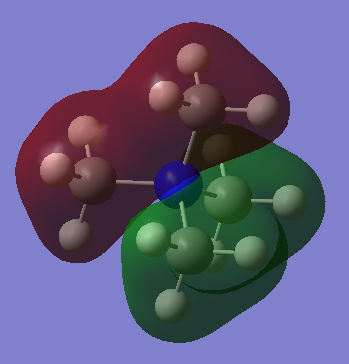
Colour range used = -1.667 to 1.667
The molecule on the left shows the charge distribution for [N(CH3)4]+ and on the right [P(CH3)4]+.
                         Central Atom    Carbon      Hydrogen
Charges on [N(CH3)4]+    -0.295          -0.483      0.269
Charges on [P(CH3)4]+    1.667           -1.060      0.298
The nitrogen in [N(CH3)4]+ has a more positive charge than the carbons, despite being more electronegative. This is because in order to form the 4th bond, the nitrogen has used its lone pair of electrons, thus creating the formal charge of +1. The formal charge is the charge that would occur if the electrons were shared evenly between nuclei. However in reality, the positive charges are infact located on the hydrogens, with the nitrogen having a negative charge. The charge range is small in [N(CH3)4]+, showing that the electronegativity difference is small between carbon and nitrogen, meaning the bond is less polar and is stronger.
However in [P(CH3)4]+ the charge range is much larger. This is because there is a larger electronegativity difference between phosphorus and carbon, hence the bond is more polar and is weaker. Additionally the phosphorus radii is much larger than the carbon radii, meaning the orbital sizes are mis-matched, so the orbital overlap is less efficient than the nitrogen carbon bond. Carbon has the more negative charge as it has a higher electronegative than the phosphorus, resulting in phosphorus having a positive charge.
Correct NBO charges and good, uniform colour range used to display the distributions across both ILs. The analysis of the charge distribution is ok however, the comparison of electronegativities could have included the H's and other effects such as symmetry could have been considered.
You identify that the positive charge actually sits on the H atoms in [N(CH3)4]+ which is good but your explanation of how the formal charge arises in the traditional picture should have considered formal electron counting. Smf115 (talk) 16:03, 2 June 2019 (BST)
LCAOs of 3 occupied valence MOs of [N(CH3)4]+
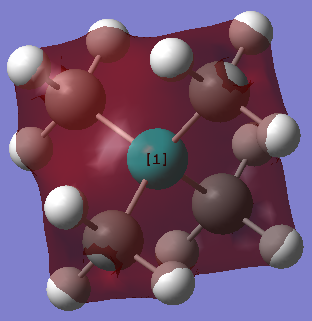
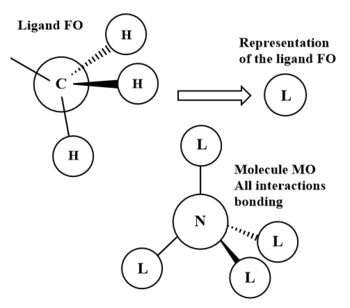
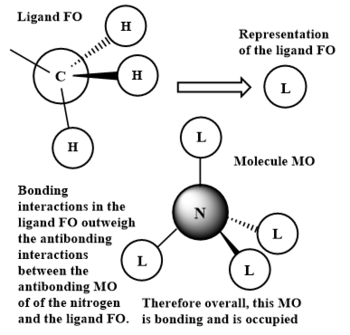
The ligand FO consists of entirely s-orbitals, 2s on the carbon and 1s on the hydrogens. As they are all in phase, the interactions between them is purely bonding. In turn, the nitrogen FO is a 2s orbital, which is the same phase as the ligand FO. The resultant molecule MO has purely bonding interactions between same phase orbitals, therefore is bonding and is very low in energy. No nodal plane is seen.
As in the previous ligand FO, the 2s carbon orbital and the 1s hydrogen orbitals are all in phase, so have solely bonding interactions. However, despite the nitrogen FO also being a 2s orbital as before, it is now in opposite phase to the ligand FO. The final molecule MO therefore now has anti bonding interactions between the nitrogen and ligand FOs, as well as the bonding interactions both in the FOs and through space bonding interactions between the ligand FOs. The bonding interactions outweigh the anti bonding interactions son this molecule MO is overall bonding. No nodal plane is observed.
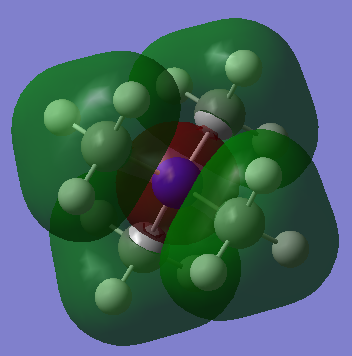
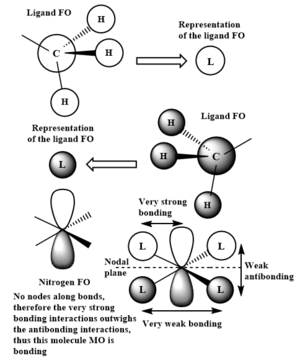
The nitrogen FO involved is now a 2p orbital. The ligand FOs adjacent to the nitrogen 2p lobes are in phase with it. Therefore there is both bonding interactions in the ligand FO, and a very strong bonding interaction between the ligand FO and the in-phase nitrogen 2p orbital. There is also weak bonding interactions between the two in-phase ligand FOs through space. An anti bonding bonding interaction exists in the molecule MO between the out of phase ligand FOs on opposite sides of the molecule. A nodal plane is observed in this MO. As there are no nodal planes seen along bonds, the bonding interactions are much stronger than the through space anti bonding interactions. To conclude, this MO is overall bonding.
Correct LCAOs, FOs and main interactions highlighted in your chosen MOs and it is well presented (however, it would have been good to see the last one drawn in the same tetrahedral arrangement). There are a few errors (e.g. there is a change of phase and hence a node in your second MO between the FOs and N), you haven't labelled which MOs are being analysed, and it would have been good to see a greater range of MOs chosen as these are all quite similar/simple. Smf115 (talk) 16:14, 2 June 2019 (BST)
Overall, a good report with a very well presented project section. Smf115 (talk) 16:14, 2 June 2019 (BST)

