Rep:Mod:IanBotham
Module 3
Samuel Murphy
Aims and Introduction
In module 1, it was stated that the endo- cyclopentadiene dimer was more kinetically stable than the exo- isomer due to secondary orbital overlap. However, these interactions were unable to be modelled using molecular mechanics / force field methods as the electronic aspects of reactivity were not taken into account. Although these methods work well for structure determination, they are flawed when it comes to describing electronic distribution, changes in bonding type and bonds being made & broken. The latter describes transition structures whereby there are no longer fitted formulae for the energy. In module 2, the scrödinger equation was numerically solved, using molecular orbital-based methods (ie. DFT), to find the stable state equilibrium position on the Potential Energy Surface (PES) curve. This stable state was analysed by vibational frequency calculations showing only positive frequencies which confirmed a minimum (ie. stable ground state). The calculations effectively show the second derivatives of the PES curve and so positive frequencies correspond to minima (stable ground states) and negative frequencies correspond to maxima (transition states). The main aim of this module 3 is to characterise transition structures on potential energy surfaces for the Cope rearrangement and Diels Alder cycloaddition reactions through the computational calculations mentioned. A secondary aim is to learn how to use the programs and methods needed to characterise such transition structures including the Intrinsic Reaction Coordinate (IRC) method and the calculation of reaction paths and barrier heights (activation energy).
The concept of of transition states was first introduced by Michael Polanyi and Henry Eyring in 1936. Eyring went on to calculate point by point the trajectory of a free H atom approaching the H2 molecule to form a transition state.[1] Most theoretical ideas about transition states came from such calculations including new computational methods like the ones used in the second year lab. This lab involved carrying out dynamics calculations using model potential energy surfaces to explore transition states of a triatomic system. The total energy could quickly be calculated for different geometries of the triatomic system using an analytical function of the atomic coordinates. [2] However, experimental methods can now permit the observation of transition states and clock, in real time, the formation and decay of the activated complex shown by Ahmed Zewail on the dissociation of NaI.[3]
The Cope Rearrangement of 1,5-hexadiene
Introduction

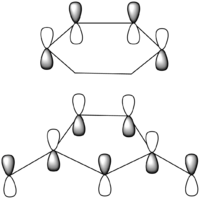
This [3,3]-sigmatropic shift rearrangement of 1,5-hexadiene involves migrating of allyl group across 3 carbons in a pericyclic concerted process. The reaction proceeds thermally (Δ) with an electron count of 6 (4n+2) so there follows Hückel topology with suprafacial components.[4] The main controversy surrounding the reaction used to be over the type of mechanism that it followed whether it be concerted, stepwise or dissociative. However, it is now generally accepted, through numerous experimental and computational studies, that the reaction proceeds in the concerted fashion mentioned via either a "chair" or a "boat" transition structure (figure 1). Using several different Density Funtioncal Theory (DFT) methods including BLYP / 6-31G*, it was shown that the C2v "boat" transition state was higher in energy than the C2h "chair" transition structure by about 5-6 kcalmol-1. This method method provides activation energies and enthalpies within 1 kcalmol-1 of experimental values showing high accuracy calculations.[5] In this first part these calculations will be made using Gaussian 09W.
Optimizing the Reactants and Products
The reaction mechanism for the cope re-arranagment was rationalized through calculating the optimised geometries of energies of various different 1,5-hexadiene conformers. Calculated activation energies and enthalpies usually use the lowest energy conformation as a reference so it is important that this conformer is found. Anti conformers contained a dihedral angle of 180o (approximately anti-periplanar (a.p.p)) whereas gauche conformers contained a dihedral angle close to 60o.
HF/3-21G Optimization
Using GaussView 5.0, 1,5-hexadiene was sketched with an "anti" linkage for the central four sp3 carbon atoms and the structure cleaned with "Clean" option selected under Edit. A .gjf input file was created on GaussView 5.0 with job type = OPT, method = HF/3-21G and the %mem under the link menu specified to 250 MB. The file was submitted to Gaussian 09W and later SCAN to obtain the published D-space link. The resulting .chk checkpoint file was opened on GaussView 5.0 and the energy noted from the Results summary. The symmetrize option was selected under Edit and the symmetry point group noted.
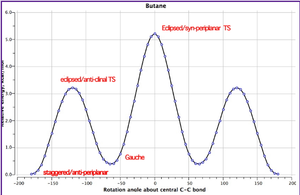
This method was repeated for another conformer with a "gauche" linkage for the central four sp3 carbon atoms. It was expected that this structure would have a higher energy than the "anti" structure as due to more favourable orbital overlap in "anti" form lowering the energy. Henry Rzepa calculated (using a DFT method known as ωB97XD/6-311G(d,p)) the graph in figure 2 for nButane showing that the anti-periplanar conformation is lower in energy than the gauche conformation by ~0.7 kcalmol-1. The anti-periplanar conformation comprises four sets of σC-H/σ*C-H-orbital interactions and 2 sets of σC-C/σ*C-C interactions which are more stabilising than the two sets of σC-H/σ*C-H interactions, two sets of σC-C/σ*C-H and two sets of σC-H/σ*C-C for the gauche conformation. Furthermore, the bond-bond Pauli repulsion energy also slightly disfavours. Although van der Waals interactions favour the gauche form, overall the anti-periplanar form is more stable at a lower energy. [6] The central 4 carbon atoms of the 1,5-hexadiene take up either an "anti" or "gauche" "nButane" conformation so these same stabilizing affects can be applied.
Further conformers were sketched and optimised through rotation of the terminal C-C bonds to see if they were lower in energy. All of these different "anti" and "gauche" conformations are shown below in table 1 including structural images, Jmols, point group symmetries, energies (Hartrees) and relative energies (kcalmol-1).
Table 1: Various anti and gauche conformers of 1,5-hexadiene
| Conformer (DOI:D-Space ) |
Structural image | Point Group Symmetry | Energy (Hartrees) HF/3-21G |
Relative Energy (kcalmol-1) |
| anti 1 (DOI:10042/to-10998 ) |
C2 | -231.69260 | 0.04 | |
| anti 2 (DOI:10042/to-10999 ) |
Ci | -231.69254 | 0.08 | |
| anti 3 (DOI:10042/to-11000 ) |
C2h | -231.68907 | 2.25 | |
| anti 4 (DOI:10042/to-11001 ) |
C1 | -231.69097 | 1.06 | |
| gauche 1 (DOI:10042/to-11002 ) |
C2 | -231.68772 | 3.10 | |
| gauche 2 (DOI:10042/to-11003 ) |
C2 | -231.69167 | 0.62 | |
| gauche 3 (DOI:10042/to-11004 ) |
C1 | -231.69266 | 0.00 | |
| gauche 4 (DOI:10042/to-11009 ) |
C2 | -231.69153 | 0.71 | |
| gauche 5 (DOI:10042/to-11010 ) |
C1 | -231.68962 | 1.91 | |
| gauche 6 (DOI:10042/to-11011 ) |
C1 | -231.68916 | 2.20 |
All of the structures calculated in table 1 were shown to match exactly in energy (to 5 d.p) and symmetry point group to the corresponding conformers in Appendix 1, including the anti 2 conformer of Ci point group symmetry. The C1 gauche 3 conformer was shown to be the lowest in energy with -231.69266 Hartrees (0.00 kcalmol-1) higher than the anti 1 (-231.69260 Hartrees / 0.04 kcalmol-1) and anti 2 (-231.69254 Hartrees / 0.08 kcalmol-1) conformers. This is due to short stabilising H-H van der Waals contacts which dominate the orbital interactions and bond-bond Pauli repulsion energy which favour "anti" conformers. Further stabilisation is due to hyperconjugation and allyly group interactions.
MO analysis
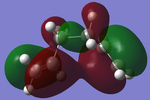
The molecular orbitals were calculated for the three lowest energy conformers which were anti 1, anti 2 and gauche 3. The same method and basis set was used with pop=full being added to the additional keywords. The new .gjf input files were submitted to Gaussian 09W as well as SCAN (D-space link). The .chk checkpoint files were opened for each conformer and the MOs selected under the Edit menu. Only the molecular orbitals were looked at as they can be used to rationalize the stability. The HOMOs of the anti 1, anti 2 and gauche 3 conformers are shown below in table.
Table 2: The HOMO molecular orbital of the anti 1, anti 2 and gauche 3 conformer
| Conformer (DOI:D-Space ) |
HOMO Molecular Orbital | Relative energy (kcalmol-1) |
| anti 1 (DOI:10042/to-11029 ) |
0.04 | |
| anti 2 (DOI:10042/to-11030 ) |
0.08 | |
| gauche 3 (DOI:10042/to-11031 ) |
0.00 |
It can be seen from the gauche 3 HOMO that there is significant overlap between the orbitals of the two allyl groups which stabilise the conformer. This is overlap is not present in the anti 1 and anti 2 conformers causing them to be slightly higher in energy.
DFT/B3LYP/6-31G(d) Re-optimization
The .chk checkpoint file of the Ci anti 2 structure was opened on Gaussview 5.0 and a new .gjf input file saved. The job type was kept as OPT but the method was changed to DFT / B3LYP with basis set 6-31G(d). The %mem was again specified as 250 MB and the chk file name changed under the Link 0 tab. The file was submitted to Gaussian 09W and later to SCAN to obtain the published D-space link again. The resulting .chk checkpoint file was opened on GaussView 5.0 and the energy and symmetry noted as before. As the anti 1 and gauche 3 conformer were calculated to be of lower energy than the anti 2 conformer they were also reoptimized with all the results shown below in table 2.
Table 3: The re-optimized geometries and energies of the anti 1, anti 2 and gauche 3 1,5-hexadiene conformers
| Conformer (DOI:D-Space ) |
Structural image | Point Group Symmetry | Energy (Hartrees) HF/3-21G |
Relative Energy (kcalmol-1) |
| anti 1 (DOI:10042/to-11014 ) |
C2 | -234.61179 | 0.00 | |
| anti 2 (DOI:10042/to-11013 ) |
Ci | -234.61170 | 0.06 | |
| gauche 3 (DOI:10042/to-11015 ) |
C1 | -234.61133 | 0.29 |
All 3 conformers have lowered in energy by ~3 Hartrees after re-optimizing with the more accurate method and basis set (DFT/B3LYP/6-31G(d).The results of the calculation show that the lowest conformer is now the anti 1 with -234.61179 Hartrees (0.00 kcalmol-1). The previously lowest energy conformer, gauche 3, is now the relatively highest in energy out of the 3 (-234.61133 hartrees / 0.29 kcalmol-1). The anti 2 conformer is still in between with -234.61170 Hartrees (0.06 kcalmol-1).
MO analysis
As for the initially optimized structures, MO analysis was carried out on the re-optimized structures using the same method. the HOMO molecular orbitals for the 3 structures are shown below in table 4.
Table 4: The HOMO molecular orbital of the re-optimized anti 1, anti 2 and gauche 3 conformer
| Conformer (DOI:D-Space ) |
HOMO Molecular Orbital | Relative energy (kcalmol-1) |
| anti 1 (DOI:10042/to-11057 ) |
0.00 | |
| anti 2 (DOI:10042/to-11058 ) |
0.06 | |
| gauche 3 (DOI:10042/to-11060 ) |
0.29 |
There is still more overlap shown for the gauche 3 HOMO of allyl orbitals compared to the other two conformers but it has decreased from the previous optimization. This decrease of overlap has caused the conformer to now be highest in relative energy out of the 3 and lowest as it was after the first optimization. The favourable σ-σ* overlap not dominates and so favours the anti conformers
Van der Waals interactions
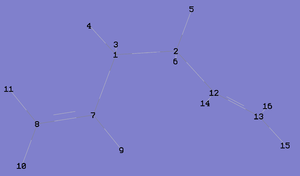
The increase in energy of the gauche 3 conformer can also be rationalized through considering Van der Waals interactions. These H-H interactions occur in the ~2.4-2.6Å region and stabilise the molecule. These contacts for the optimized and reoptimized structures are shown below in table 5 with the labelling of the atoms shown in figure 3a and b. Note: Only interactions between hydrogens on non-adjacent carbons have been considered.
 |
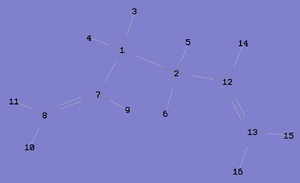 | |||
Table 5: A comparison H-H Van der Waals interactions in the optmized and pre-optimized gauche 3 conformer
| H-H contacts | Optimization method | |
| HF/3-21G | DFT/B3LYP/6-31G(d) | |
| H(4)---H(11) | 2.43 Å | 2.43 Å |
| H(3)---H(14) | 2.55 Å | 2.61 Å |
| H(6)---H(16) | 2.43 Å | 2.46 Å |
| H(9)---H(14) | 2.67 Å | N/A |
It can be seen that the optimized structure has 4 stabilising H-H interactions compared to the 3 for the reoptimized structure which makes it more stable and lower in relative energy. Also, the interactions which are present in both are shorter (hence more attractive) or the same as that of the optimized structure which further shows why it is lower in relative energy compared to the other conformers. After the 1st optimization these interactions are dominant enough to overcome the orbital overlap and pauli bond-bond repulsion which favour the anti conformers. However, these interactions decrease after the 2nd optimization no longer being dominant which means the anti 1 and anti 2 conformers are now lower in relative energy.
Geometry Comparisons
The optimized geometry of the anti 2 Ci conformer using the HF / 6-21G method was compared with the optimized geometry using the DFT / B3LYP / 6-31G(d) method through measuring bond lengths and angles on GaussView 5.0. These measurements are shown below in table 5. The overall geometry does not change considerably with the C(2)-C(5) dihedral angles, H(A)-C(1)-C(2) angles and C(2)-C(3)-H(B) angles all staying the same. The C=C double bonds become longer (1.32 Å vs. 1.33 Å) after optimization whereas two of the C-C bonds become shorter (1.50 Å vs. 1.51Å) and the C(3)-C(4) bond length remains the same (1.55 Å). The C(1)-C(4) and C(3)-C(6) dihedral angles increase optimisation relieving strain with helps to explain the decrease in relative energy.
Table 6: A comparison of the bond lengths and dihedral angles in the anti 2 1,5-hexadiene conformed when optimized with HF / 3-21G and DFT / B3LYP / 6-31G(d)
| Optimization Method | C(1)=C(2) & C(5)=C(6) bond length (Å) |
C(2)-C(3) & C(4)-C(5) bond length (Å) |
C(3)-C(4) bond length (Å) |
C(1)-C(4) dihedral angle (o) |
C(2)-C(5) dihedral angle (o) |
C(3)-C(6) dihedral angle (o) |
H(A)-C(1)-C(2 angle (o) |
C(2)-C(3)-H(B) angle (o) |
| HF / 3-21G | 1.32 | 1.51 | 1.55 | -115 | -180 | 115 | 122 | 110 |
| DFT / B3LYP / 6-31G(d) | 1.33 | 1.50 | 1.55 | -119 | 180 | 119 | 122 | 110 |
Vibrational Frequency Analysis

The optimized anti 2 structure from the DFT/B3LYP/6-31G was opened on GaussView 5.0 and a new .gjf input file created. The job type was changed to Freq but the rest of the method was kept the same. The file was submitted to Gaussian 09W and later to SCAN (DOI:10042/to-11017 ). The .chk checkpoint file was opened in GaussView 5.0 and Vibrations selected under the results menu displaying the IR spectrum (figure 5). The .log file was also opened and the low frequencies noted (figure

The top line of low frequencies are all close to zero which shows the optimzation was successful. The second line of low frequencies are all positive which shows that a minimum has been reached on the potential energy surface (PES). Negative frequencies would indicate a maximum on the PES which would mean a transition state has been reached and the optimization was not successful.
Thermochemical Data
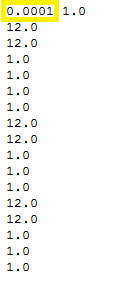
The .log file from the anti 2 FREQ calculation was opened and the values under the thermochemistry heading were noted. These values correspond to a temperature of 298 K but they were also calculated at 0 K using the Freq=ReadIsopes additonal keywords. The .gjf input file was then edited on wordpad to include the text at the end shown in figure 6. The highlighted text is the temperature set to 0.0001 K as 0 K could not be used. The edited file was then submitted to Gaussian 09W and SCAN (DOI:10042/to-11018 ). The thermochemistry values were again noted from the .log file and are shown below in table 7 compared to the values calculated at 298 K.
Table 7: A comparison of the thermochemical data at 0K and 298.15 K for the anti 2 conformer of 1,5-hexadiene
| Thermochemical Data / Eh (Hartree) | ||
| 0 K | 298.15 K | |
| The sum of electronic and zero-point energies | -234.468775 | -234.46921 |
| The sum of electronic and thermal energies | -234.468775 | -234.461856 |
| The sum of electronic and thermal enthalpies | -234.468775 | -234.460912 |
| The sum of electronic and thermal free energies | -234.468775 | -234.500822 |
The first value is the potential energy at 0 K including the zero-point vibrational energy (E = Eelec + ZPE) so it is not surprising that the calculations at 0 K and 298 K (-234.468775 Hartrees) are very similar. They are not exactly the same as the calculation at "0K" was actually at 0.0001 K but they are the same to 3 d.p (-234.469 Hartrees). Also because the molecular mass numbers used for carbon and hydrogen did not take into account isotopic contribution like the 298 K calculation.
The second is the energy at the temperature stated (p = 1 atm) including contributions from the translational, rotational, and vibrational energy modes at this temperature (E = E + Evib + Erot + Etrans). At 0K this the energy value is the same as for the first value as there is zero contribution from thermal energies. Conversely, at 298 K, the energy increase as expected from the thermal energy.
The third contains an additional correction for RT (H = E + RT) which is particularly important for dissociation reactions. It is again the same value at 0K as there are no thermal contributions but at 298 K it increases as the thermal enthalpy is increasing.
Finally, the last value includes the entropic contribution to the free energy (G = H - TS). as expected this is the same at 0K as there are no thermal contributions. At 298.15 K, the energy value decreases due to negative contributions from the free energy as free energy decreases becoming more negative with increasing temperature.[7]
Optimizing the "Chair" and "Boat" Transition Structures
Optimizing the "Chair" Transition Structure

In this section, the optimisations were calculated for to a transition state instead of to a minimum as done before. the easiest way to do this is to have a reasonable for the transition structure end then compute force constant matrix for the first steps of the optimisation. This is what has been done here.
The CH2CHCH2 allyl fragment was sketched on GaussView 5.0 and a .gjf input file created with job type = OPT and method = HF/3-12G. The file was submitted to Gaussian 09W and then SCAN (DOI:10042/to-11091 ). The optimised .chk checkpoint file was opened and copied and pasted twice into a new molecule group window. The two allyl fragments were positioned ~2.2 Å apart anti-symmetrically and the file saved as a .gjf file. Two allyl fragments were pasted into a new molecule group window and a new .gjf file created. The job type was set as Opt+Freq with Optimization to a TS Berny selected as well as "calculate force constants Once". Opt=NoEigen was added to the additonal keywords before the file was submitted to Gaussian 09W and SCAN (DOI:10042/to-11092 ). The optimized structure (figure 7) was opened on Gaussview 5.0 and the vibrations viewed under the results menu. The frequency calculation gave an imaginary frequency at -818 cm-1(animated here) in accordance with the script, corresponding to the cope re-arrangement.
The transition structure was then optimized again using the frozen coordinate method. The guess transition structure was pasted into a new molecule group window and the Redundant Coord Editor selected from the edit menu. A new coordinate was created and two of the terminal carbons from the allyl fragments identified (1 and 6)from the GaussView 5.0 window. "Bond" was selected instead of "Unidentified" on the coordinate editor as well as "Freeze Coordinate" instead of "Add". The bond length was also specified to 2.2 Å. Another coordinate was created in the same way but using carbons 3 and 4. Now set up the optimization as if it were a minimum and you should see the option Opt=ModRedundant already included in the input line. Submit the job. An optimization as then run on Gaussian 09W and later SCAN (DOI:10042/to-11096 ) using the same method as before but with Opt=ModRedundant included in the input line. This optimised structure is very similar to previously optimized structure but with the bond forming/breaking distances set at 2.20 Å.
This bond forming/breaking distance was then too optimized again using the redundant coord editor. Two new coordinates were created with the carbons as before but "Bond" was chosen instead of "unidentified" and "Derivative" instead if "Add". A TS Berny transition state optimization was run as before but this time without force constant calculation (option was left as "Never"). A normal guess Hessian modified to include the information about the two coordinates differentiated was used instead. The .gjf input file was submitted to Gaussian 09W and SCAN (DOI:10042/to-11120 ) and the resulting .chk checkpoint file opened on GaussView 5.0. The optimised structure looked similar to before but now the bond forming/breaking distance was shortened to 2.02 Å.
The method was changed to DFT/B3LYP/6-31G(d) and the whole frozen coordinate method repeated with a new .gjf input. This file was submitted to Gaussian 09W and SCAN (DOI:10042/to-11129 ) and the .chk checkpoint file opened on GaussView 5.0. The bond breaking/forming distances of the optimised structure had shortened even more to 1.97 Å and the imaginary frequency increased to -565.39 cm-1.
Optimizing the "Boat" Transition Structure

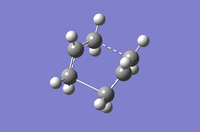
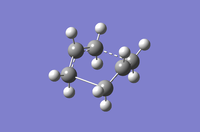
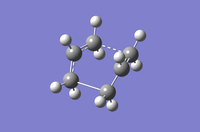
The boat transition structure was then optimised using both the QST2 and QST3 methods separately. In the QST2 method, the reactants and products are specified and the calculation will interpolate between the two to find the transition structure. For the calculation to work, the reactants and products have to be numbered in the same way so the atom number were therefore edited on Gaussview 5.0 using the atom list editor. So firstly, the .chk checkpoint file of the optimised Ci anti 2 conformer was opened and the structure pasted into a new molecule group window. In the same window the "add to mol group" option was selected to create a second page in the same window. The anti 2 conformer was then pasted into this second window. The numbered structures are shown below in figure 9.
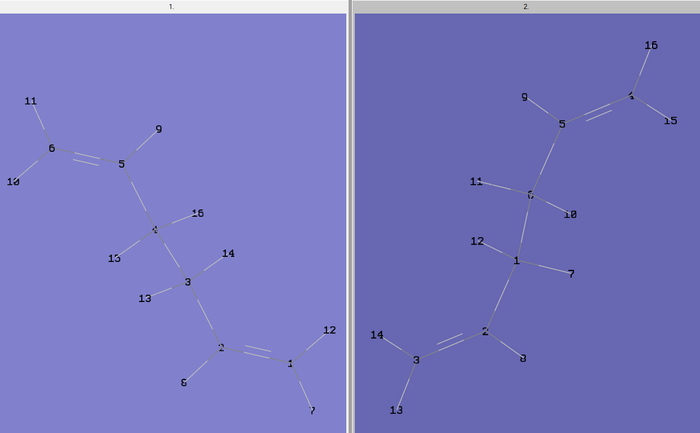
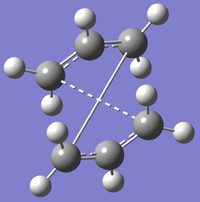
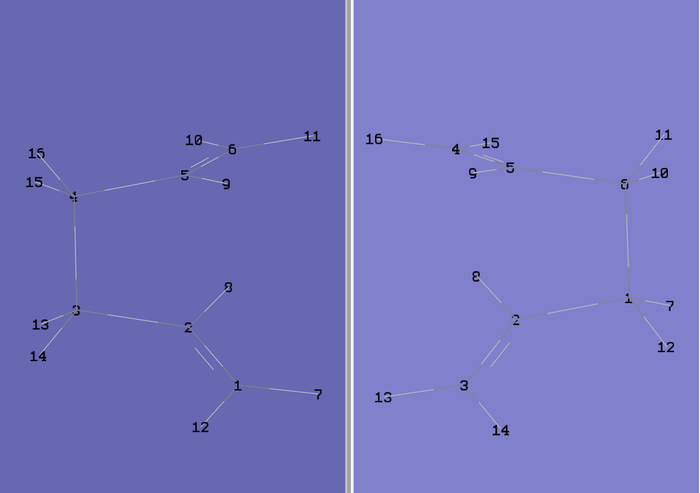
The file was then saved as .gjf input file with job type = Opt+Freq and TS(QST2) selected with method = HF/3-12G. The file was submitted to Gaussian 09W and SCAN (DOI:10042/to-11121 ) and failed as expected. The .chk checkpoint file was opened and the structure (figure 10) found to look like a dissociated chair transition structure. When the calculation interpolates linearly between the two structures it simply translates the top allyl fragment and does not consider rotation around the central bonds[2]. Therefore, this has to be done manually before running the optimisation. The original input file for the QST2 calculation was opened and the angles of the react and product modified to closer match the boat transition structure. Firstly, the central dihedral angle of the reactant (C2-C3-C4-C5 for reactant in figure 9 above) was altered to 0o. Then the C2-C3-C4 and C3-C4-C5 angles for the reactant were altered to 100o. The same was done for the product molecule resulting in the two structures shown below in figure 11.
The QST2 calculation was then run again as before on Gaussian and SCAN (DOI:10042/to-11124 ) but this time it converged to the boat transition structure. The vibrational frequencies showed just one imaginary frequency at -839.22 cm-1 corresponding to the cope re-arrangement. This exercise shows that the QST2 useful in finding the transition state but to ensure success, it is imoportant to alter the reactants and products so they are close to the transition structure.
Another more reliable method is the QST3 method which allows the input of a guess transition state. the guess boat transition structure (figure 8) was added to the same molecule window on the QST2 input file so that there were now 3 molecules in the same window. The guess structure was re-numbered to match the reactants and products and the optimisation changed to TS(QST3). The file was submitted to Gaussian 09W and SCAN (DOI:10042/to-11125 ) and the resulting .chk checkpoint file showed convergence to the boat transition structure had been successful. The vibrational frequencies again showed one negative frequency at -840.00 cm-1 which corresponded to the cope re-arrangement. The two methods were also repeated but for the DFT/B3LYP/6-31G(d) method and basis set with all of the results tabulated below in table 8.
Table 8: A comparison of the QST2 and QST3 methods for optimisation methods HF / 3-21G and DFT / B3LYP / 6-31G(d)
| HF/3-21G | DFT/B3LYP/6-31G(d) | |||
| QST2 | QST3 | QST2 | QST3 | |
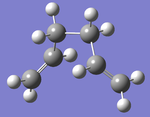
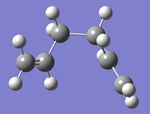
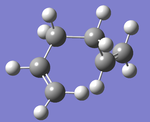
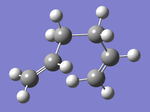
| Structural Image | 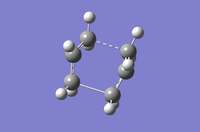
|
|
|
|
| JMol | JMol | JMol | JMol | JMol |
| Imaginary Frequency (cm-1) | -839.22 | -840.00 | -529.93 | -530.34 |
| D-Space Link | DOI:10042/to-11124 | DOI:10042/to-11125 | DOI:10042/to-11127 | DOI:10042/to-11128 |
| Energy (Hartrees) | -231.60280143 | -2.3160280247 | -234.54309250 | -234.54308886 |
Energies
Frequency analysis was carried out on the HF/3-12G optimised anti 2 conformer (DOI:10042/to-11126 ) to gain the thermochemical data. This data is shown below (table 9) along with data for the chair and boat transition structures.
Table 9: A summary of energies for the chair % boat transition structures and the Ci anti 2 conformer after optmisations with methods HF / 3-21G and DFT / B3LYP / 6-31G(d)
| HF/3-21G | DFT/B3LYP/6-31G(d) | |||||
|---|---|---|---|---|---|---|
| Electronic energy | Sum of electronic and zero-point energies | Sum of electronic and thermal energies | Electronic energy | Sum of electronic and zero-point energies | Sum of electronic and thermal energies | |
| at 0 K | at 298.15 K | at 0 K | at 298.15 K | |||
| Chair TS | -231.61932248 | -231.466700 | -231.461341 | -234.55698274 | -234.414925 | -234.409006 |
| Boat TS (TS QST2) | -231.60280143 | -231.450937 | -231.445313 | -234.54309250 | -234.402349 | -234.396013 |
| Reactant (anti 2) | -231.69254 | -231.539539 | -231.532566 | -234.61170 | -234.46921 | -234.461856 |
All of these energies have good agreement with the values in Results table in the script.[8]
Intrinsic Reaction Coordinate (IRC) method
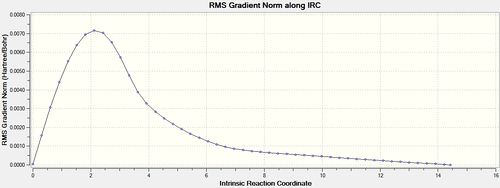
The IRC method is used to find which conformer the reaction paths from the chair and boat transition structures lead to. It follows the minimum energy of the transition structure down to a local minimum (the product) on the PES. The method also produces an RMS gradient plot which confirms whether a local minimum or maximum has been reached or not (ie. zero gradient).
Chair Transition Structure
The .chk checkpoint file was optimised for the chair transition state optimised with the frozen coordinate method (methods = B3LYP/6-31G(d). A new .gjf input file was saved with job type = IRC and method = DFT/B3LYP/6-31G(d) (same as optimisation). Due to the symmetrical reaction coordinate, it only needs to be compute in the forward direction instead of both ways so the former option was selected. Initially, the force constant calculation was set to only calculate once and the number of points along the IRC set to 50. The file was submitted to Gaussian 09W and SCAN(DOI:10042/to-11143 ) and the .chk output file opened on GaussView 5.0. As seen from figures 12 and 13 below, the minimum geometry had not been reached.
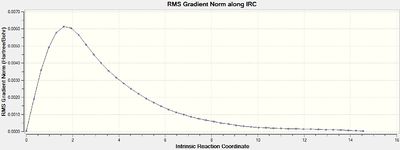
The total energy plot shows that the final geometry has been 'optimised' to -234.60739 Hartrees but figure 3 shows that this is not a minimum geometry. The RMS gradient has not reached zero which shows that the PES curve has not reached a minimum as it has a gradient. The IRC was therefore run again but this time specifying to compute the force constants at every step along the IRC coordinate. This was the most reliable method compared to the other methods which included computing more points along the IRC or running a normal optimisation on the last point on the IRC. It is the most computationally expensive and is not always feasible for large systems but the molecules used were deemed small enough and there was enough time to wait for the longer calculation. The new .gjf input file was submitted to SCAN (DOI:10042/to-11140 ) and the .chk output file again opened on GaussView 5.0. After this calculation, a minimum was indeed found shown in figures 14 and 15 below.
The Total Energy plot showed that the energy of the minimised geometry wa now -234.61067 Hartrees and the RMS gradient now close to zero (<0.001) which proved minmisation. The minimised geometry (Jmol) closely resembled that of the gauche 2 conformation and shared the C2 symmetry of 1,5-hexadiene so this was reoptimized with the DFT method to compare energies. This newly optimised gauche 2 conformer (DOI:10042/to-11141 ) had an energy of -234.61069 Hartrees further showing that the chair transition state is of gauche 2 conformation.
Boat Transition Structure
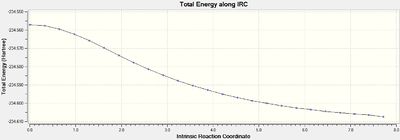
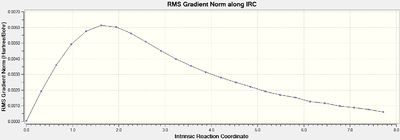
The latter calculation method was used to find the IRC of the boat transition structure so force constants were calculated at every step along the coordinate. The .chk checkpoint file of the boat transition structure optimised with the QST2 DFT method was opened and saved as a new .gjf file before being submitted to SCAN (DOI:10042/to-11150 ). The Total Energy and RMS gradient plots are shown below in figures 16 and 17.
The RMS gradient is close to zero (<0.001) which shows the optimisation has been successful. the final structure was cleaned and re-optimised with the DFT/B3LYP/6-31G(d) (DOI:10042/to-11337 ) to produce an optimised structure (Jmol) which resembled the gauche 3 conformer. It has an energy of -234.61133 and C1 symmetry which matches exactly the gauche 3 energy of -234.61133 Hartrees and symmetry of C1.
Activation energy (Ea) calculations
Finally, the activation energies were calculated for the reaction via both transition structures with the different optimisation methods (HF/3-12G and B3LYP/6-31G(d)). The chair and boat transition structures had already been re-optimised with the B3LYP/6-31G(d) level of theory so only frequency calculations were needed.
0 K
The activation energies were calculated by taking the difference from the transition structure and the starting reactant. This data was taken from the Thermochemistry data from the .log files of the frequency calculations. The difference in Hartrees was multiplied by 627.509 to get the activation energy in kcalmol-1. For the 0 K calculations, 'the sum of electronic and zero-point energies' was used as this is at 0 K. For the HF level of theory the gauche 3 conformer was used as the reactant as this was lowest in energy and for the DFT level of theory anti 1 was used for the same reason. (Frequency calculation: gauche 3 HF (DOI:10042/to-11183 ) and anti 1 DFT DOI:10042/to-11184 ). The calculations are shown below in table 8.
Table 8: Calculation of the activation energies via the chair and boat transition structures at 0 K
| HF/3-21G | DFT/B3LYP/6-31G(d) | ||||
| Chair | Boat | Chair | Boat | ||
| sum of electronic and zero point energies (Hartrees) | -231.466700 | -231.450937 | sum of electronic and zero point energies (Hartrees) | -234.414925 | -234.402349 |
| sum of electronic and zero point energies of 1,5 hexadiene (gauche 3 C1) (Hartrees) | -231.539486 | -234.539486 | sum of electronic and zero point energies of 1,5 hexadiene (anti 1 C2) (Hartrees) | -234.469298 | -234.469298 |
| Difference in energy (Hartrees) | 0.072786 | 0.088549 | Difference in energy (Hartrees) | 0.054373 | 0.066949 |
| Difference in energy (kcal/mol) | 45.67 | 55.57 | Difference in energy (kcal/mol) | 34.12 | 42.01 |
Via the chair transition structure, the experimental activation energy is 33.5 ± 0.5 kcalmol-1. It is clear from table 8 that the DFT level of theory calculated value of 34.12 is much closer to the experimental value than the HF calculated value of 45.67. Similarly the experimental value via the boat transition structure activation energy of 44.7 ± 2.0 kcalmol-1 is much closer to the DFT calculation (42.01 kcalmol-1) than the HF calculation (55.57 kcalmol-1).
298 K
For the 298 K calculations (table 9), 'the sum of electronic and thermal energies' was used as this is at 298 K. The same reactants were used in the calculations as for the 0 K calculations.
Table 9: Calculation of the activation energies via the chair and boat transition structures at 298 K
| HF/3-21G | DFT/B3LYP/6-31G(d) | ||||
| Chair | Boat | Chair | Boat | ||
| the sum of electronic and thermal energies (Hartrees) | -231.461341 | -231.445313 | the sum of electronic and thermal energies (Hartrees) | -234.409006 | -234.396013 |
| the sum of electronic and thermal energies of 1,5 hexadiene (gauche 3 C1) (Hartrees) | -231.532646 | -231.532646 | the sum of electronic and thermal energies of 1,5 hexadiene (anti 1 C2) (Hartrees) | -234.461966 | -234.461966 |
| Difference in energy (Hartrees) | 0.071305 | 0.087333 | Difference in energy (Hartrees) | 0.05296 | 0.065953 |
| Difference in energy (kcal/mol) | 44.74 | 54.80 | Difference in energy (kcal/mol) | 33.23 | 41.39 |
Again it can be seen from table 9 that the DFT level of theory is much more accurate than the Hf level of theory compared to the experimental values.
The Diels Alder Cycloaddition
The Diels-Alder reaction is an example of a π4s + π2s cycloaddition involving the movement of 6-π electrons in a concerted process. Firstly the common reaction between cis-butadiene was be investigated before looking at the regioselectivity that can evolve in the second reaction between maleic anhydride and cyclohexa-1,3-diene. Normal electron demand is a reaction between an electron rich diene and an electron poor dienophile.
Cis-butadiene and ethylene cycloaddition
Cis-butadiene was sketched on GaussView 5.0 and optimised (job type = OPT) with the semi-empirical AM1 method and pop=full in the additional keywords. The .gjf input file was submitted to SCAN (DOI:10042/to-11353 ) and molecular orbitals selected from the .chk checkpoint file. The higher level DFT / B3LYP / 6-31G(d) method was also used to optimise (DOI:10042/to-11355 ) the molecule and calculate the MOs. The same to methods were used to optimise the ethylene molecule as well (AM1-(DOI:10042/to-11356 ), DFT - (DOI:10042/to-11357 )). The HOMOs and LUMOs were calculated for both molecules using both methods of optimisation shown below in table 10.
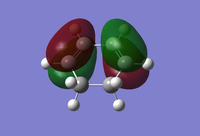
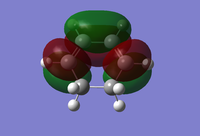
Table 10 : The HOMO LUMOs of cis-butadiene and ethylene when optimised with the semi-empirical AM1 method and the DFT / B3LYP / 6-31G(d) method
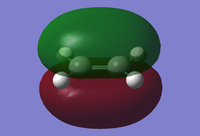
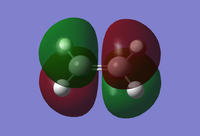
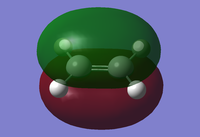
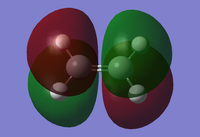
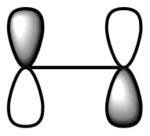
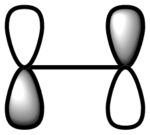
With respect to the reflection plane it can be seen that the cis-butadiene HOMO is asymmetric whereas the LUMO is Symmetric. Conversely, the HOMO of ethylene is symmetric and the LUMO asymmetric.
The principle of conservation of orbital symmetry means that only molecular orbitals of the same symmetry can interact allowing for predictions of the reaction mechanism. Two different interacting MOs need significant overlap density which is only possible when they share the same symmetry. No significant overlap density is possible for anti-symmetric pairing which forbids the interaction. Although all MOs of one reactant with a particular symmetry will interact with the MOs of the other reactant with the same symmetry, interactions between occupied MOs does not lead to a net energy change so are omitted. Only the interaction of occupied MOs (ie. HOMO) of a molecule with unoccupied MOs (ie. LUMO) of the other molecule will lead to a stabilization of the system.[9] In the case above, the cycloaddition follows a normal electron demand Diels-Alder involving an electron rich diene and an electron-poor dienophile. Therefore the important MO interaction is that of the HOMO of cis-butadiene (diene) with the LUMO of ethylene (dienophile). It can be seen in table 10 that these are both asymmetric and so the interaction will indeed lead to stabilization of the system.
Frozen Coordinate Method
The transition state was optimised using the frozen coordinate method as for the chair transition state optimisation carried out before. The AM1 optimised cis-butadiene and ethylene molecules were pasted into the same molecule window on GaussView 5.0 and positioned in the envelope type structure. The redundant coordinate editor was first used to fix the bond breaking/forming bonds between the two molecules as before to ~2.2 Å. After a normal optimisation to a minimum being carried out, the redundant coordinate was again used but this time the "fixed" option was changed to derivative for the same two bonds. A TS Berny optimisation (job type = Opt+Freq) was then carried out and the resulting .chk checkpoint opened on GaussView 5.0 to analyse. The structure of the transition state is shwon below in figure 18 along with a Jmol structure.
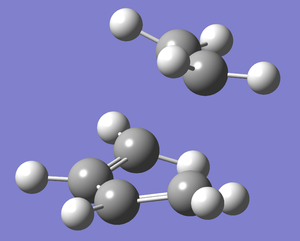
The structure showed the expected envelope type structure with the partly formed σ C-C bonds in the transition structure measured at 2.21 Å. The 3 double bonds are between 1.37-1.38 Å and the single bond is 1.39 Å. The typical sp3-sp3 C-C bonds are 1.54 Å whereas the typical sp2-sp2 C=C bond lengths are shorter at 1.33 Å.[10]The bonds measured are of intermediate value which suggests that there is delocalisation of the π system which disrupts the hybridisation. In fact the double bond on the ethylene fragment changes from sp2 to sp3 hybridisation during the cycloaddition so it makes sense that the transition bond length is intermediate of the two literature values. The partly formed σ C-C bonds of 2.21 Å are considerably longer than the literature values measured but the Van der Waals radius of the C atom is 1.70 Å so two of these radii with no overlap could theoretically form a longer bond of 3.4 Å at the shortest. Therefore, it can be concluded about the C-C bond length of the partly formed σ C-C bonds in the TS that it is in between the two extremes of a C-C single bond (1.54 Å) and the sum of the VdW radii (3.4 Å).
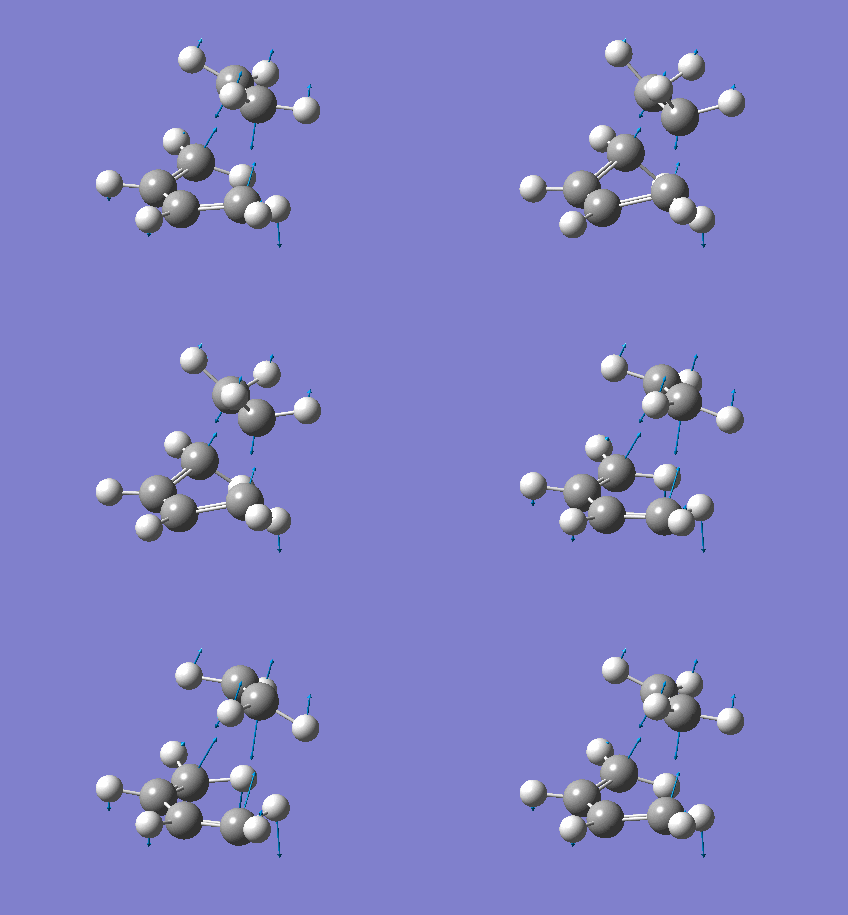
The vibrational frequencies calculated showed only one negative frequency corresponding to reaction path at the transition state at -819.42 cm-1 (figure 19). The lowest positive frequency was at 167.40 cm-1 also shown below in figure 20.
 |
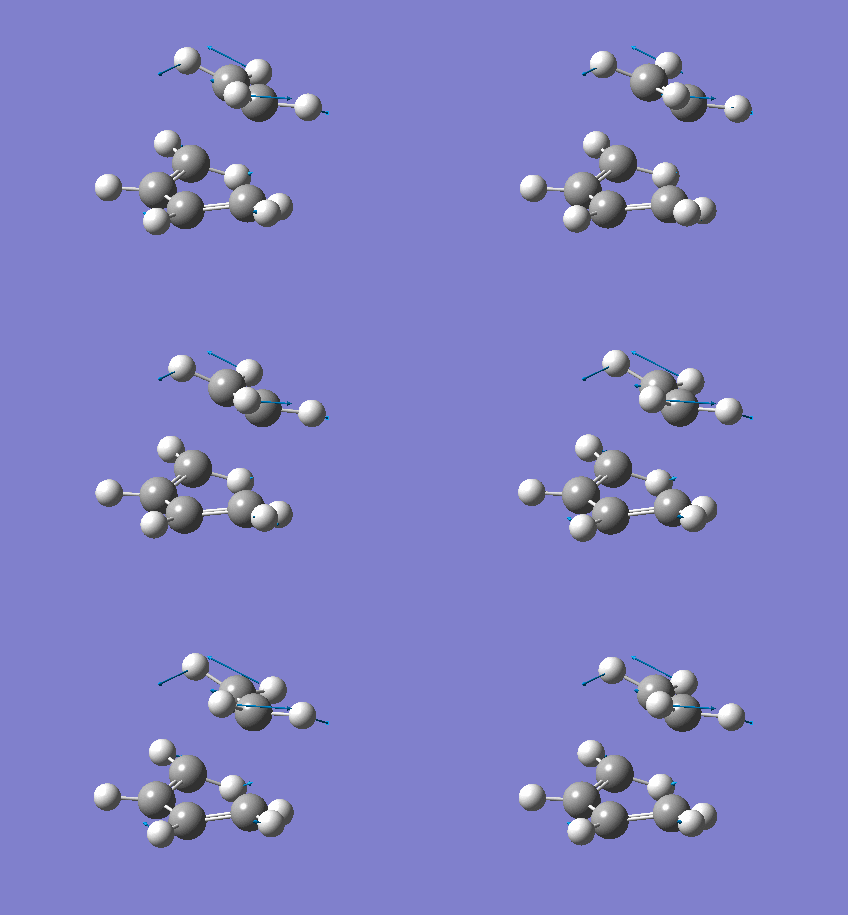 | |||
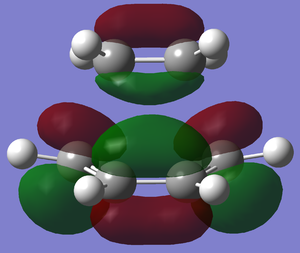
The imaginary frequency showed stretching of the two molecules in the direction of the bond to be made/broken as expected for the transition state. The formation of the two bonds is synchronous as the molecules are stretching in the direction of the bond together. This differs from the lowest positive frequency which shows a slight twisting of the two molecules roughly orthogonal to the bond breaking forming bond. This low frequency stretch is asynchronous as the ethylene is twisting in the opposite direction to the cis-butadiene. This vibrational analysis shows that the transition state optimisation was successful as it only gave one imgainary frequency which differs a lot from the lowest positive frequency. A "pop=full" energy calculation was then carried out on Gaussian 09W to allow analysis of Molecular orbitals. The calculated HOMO-1, HOMO and LUMO molecular orbitals are shown below in table 11 below.
Table 11: The HOMO and LUMO molecular orbitals of the transition state
| HOMO | LUMO | |
| Structural Image | 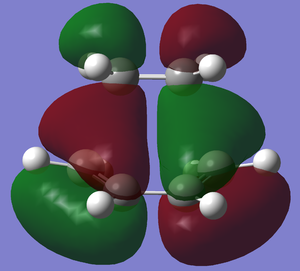
|
|
| Relative Energy | -0.32388 | 0.02314 |
| Corresponding LCAOS | 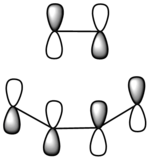
|
|
| Symmetry with respect to the reflection plane | Anti-symmetric | Symmetric |
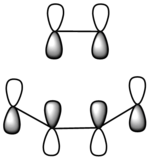
The HOMO at the transition structure is anti-symmetric and has been made from the anti-symmetric cis-butadiene HOMO and anti-symmetric LUMO of ethylene. This reaction is allowed as the two interacting MOs have the same symmetry and so can interact to stabilise the energy of the system. The LUMO is shown to be symmetric and made up from the symmetric LUMO of cis-butadiene and the symmetric HOMO of ethylene. This interaction is again allowed as all interacting MOs are symmetric. The overall reaction is allowed as the HOMO of the diene interacts with the LUMO of the dienophile to stabilise the energy of the system. Further overlap between the HOMO of the dienophile and LUMO of the diene (inverse electron demand) also helps stabilise the energy.
Regioselectivity of the Diels Alder Reaction
Cyclohexa-1,3-diene reaction with maleic anhydride
The regioselectivity of the Diels Alder Reaction was studied through looking at the cycloaddition between cyclohexa-1,3-diene and maleic anhydride. This facile reaction proceeds to give primarily the kinetic ENDO adduct which suggests the the reaction is under kinetic control and the EXO transition state is higher in energy.[11] The two mechanisms for the formation of the Exo- and Endo- adducts are shown below in figure 22.

Maleic anhydride was sketched on GaussView 5.0 and optimised to a minimum (job type = Opt) with the semi empirical AM1 method and pop=full in the additional key words. The .gjf input file was submitted to SCAN (DOI:10042/to-11201 ) and the resulting MOs shown (table 13). The same was done for the cyclohex-1,3-diene (DOI:10042/to-11202 ) and the resulting MOs shown (table 13).
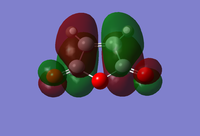
Table 13 : The HOMOs and LUMOs of maleic anhydride and cyclohexa-1,3-diene calculated with the semi-empirical AM1 method
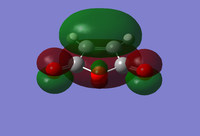
It can be seen that the both the HOMO of maleic anhydride and the LUMO of cyclohexa-1,3-diene are symmetric whereas the LUMO of maleic anhydride and the HOMO of cyclo-1,3-hexadiene are anti-symmetric.
Frozen Coordinate Method
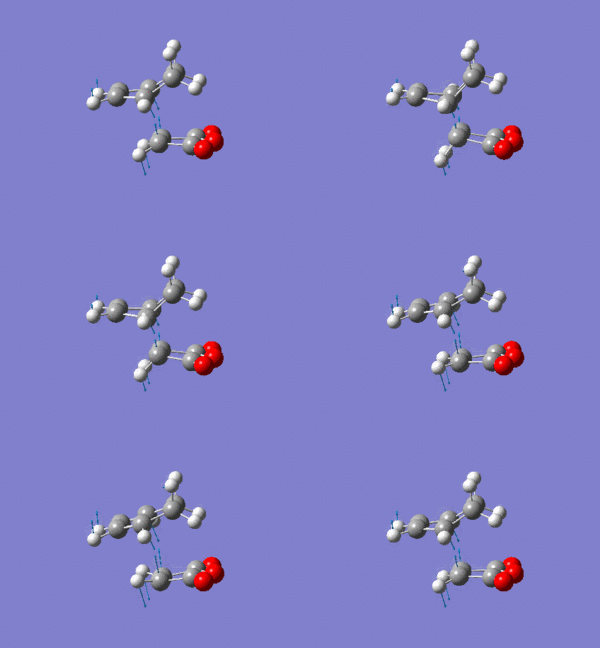
After AM1 optimisation, the two reactants (maleic anhydride and cyclohexa-1,3-diene) were copy and pasted into the same molecule window on GaussView 5.0. Firstly they were positioned in the Exo transitional structure and then separately in the Endo transitional structure. The frozen coordinate method was used to find the transitional structure for both exo and endo as for the cope-rearrangement and the previous Diels-Alder investigation. The bonds were firstly fixed to ~ 2.2 Å and optimised to a minimum before being optimised to a TS Berny with the derivative option selected. A frequency and MO calculation was carried out as well. The transition structures for both the exo and endo form were found shown below in table 14 along with relative energies and important vibrational stretches.
It can be seen that the endo transition structure is lower in energy by 0.68 kcalmol-1 which explains why the endo adduct is the kinetic adduct formed. The vibrational analsysis shows 1 imaginary frequency for both adducts which correspond to the reaction path at the transition state as they are synchronously stretching towards the bond to be broken/made. The low frequencies are also shown for both adducts and are shown to be asynchronously twisting away from the bond to made/broken.
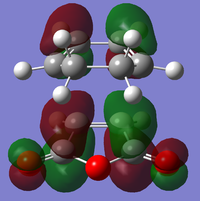
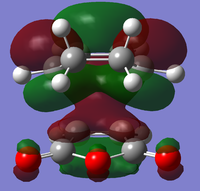
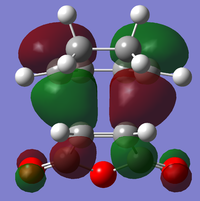
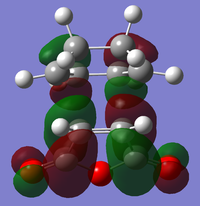
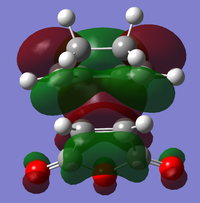
The HOMO-1, HOMO, LUMO and LUMO+1 molecular orbitals are plotted for both the exo and endo adduct, shown below in table 15.
Table 15 : The HOMO-1, HOMO, LUMO and LUMO+1 for the exo and endo transition structure
| HOMO -1 | HOMO | LUMO | LUMO +1 | ||
| Exo | Structural Image | 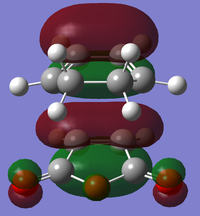
|

|
|
|
| Relative Energy | -0.36670 | -0.34281 | -0.04039 | -0.02013 | |
| Corresponding LCAOS | 
|
|
|
| |
| Symmetry with respect to the reflection plane | Symmetric | Anti-symmetric | Anti-symmetric | Symmetric | |
| Endo | Structural Image | 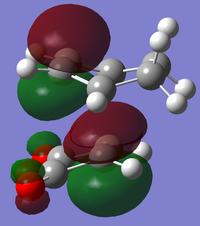
|
|
|
|
| Relative Energy | -0.36842 | -0.34504 | -0.03567 | -0.02015 | |
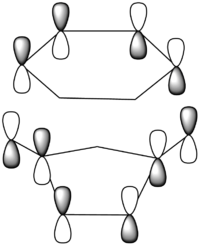
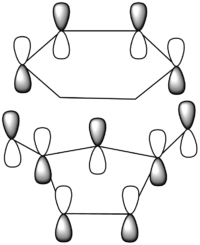
| Corresponding LCAOS | 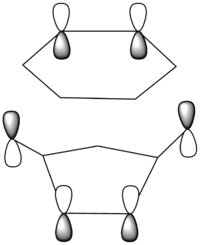
|

|
|
| |
| Symmetry with respect to the reflection plane | Symmetric | Anti-symmetric | Anti-symmetric | Symmetric |
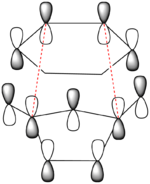
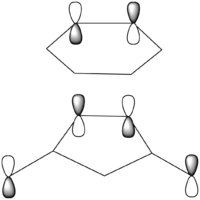
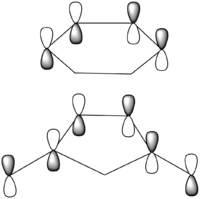
There is a large node (for exo and endo) in the HOMO between the -(C=O)-O-(C=O)- fragment and the remainder of the system. This shows that the electronegative oxygen atoms are withdrawing the electron density away from the C=C double bond on the maleic anhydride (dienophile). This makes the double bond more electron poor which is favourable for the reaction with the electron rich cyclohexa-1,3-diene (normal electron demand). It can also be seen that there is “secondary orbital overlap effect” present for the endo adduct but not the exo adduct which helps stabilise the endo form kinetically. This effect is shown in figure A for the LUMO+1 orbitals showing the stabilising overlap of non-bonding orbitals. The HOMO-1 for the endo adduct also shows a possible interaction between the oxygen orbitals and the non-bonding orbitals on the cyclohexa-1,3-diene.
Bond lengths
The bond lengths of the partly formed σ C-C bonds and the other C-C distances were measured and are shown below in table 15. (C-C through space distances between the -(C=O)-O-(C=O)- fragment of the maleic anhydride and the C atoms of the “opposite” -CH2-CH2- for the exo and the “opposite” -CH=CH- for the endo).
Table 15 :Carbon-Carbon bond distances in the exo and endo adducts
| Partially formed C-C (Å) | Through space C-C (Å) | C=C maleic anhydride(Å) | C=C cyclohexa-1,3-diene (Å) | C-C maleic anhydride(Å) | C-C cyclohexa-1,3-diene (Å) | |
|---|---|---|---|---|---|---|
| Exo | 2.17 | 2.94 | 1.41 | 1.39 | 1.49 | 1.40, 1.49 and 1.52 |
| Endo | 2.17 | 2.89 | 1.41 | 1.39 | 1.49 | 1.40, 1.49 and 1.52 |
There are more steric repulsions in the endo-form than the exo form but the secondary orbital effects shown earlier dominate the sterics. The structure is therefore a compromise between steric repulsions and secondary orbital overlap.
IRC
The Intrinsic Coordinate Method (IRC) was used as before to find the structure of the transition state at maximum energy on the total energy graph. The number of steps was increased to 100, the force constant set to calculate at every step and the calculation run in both directions (not just forwards as before).
Exo
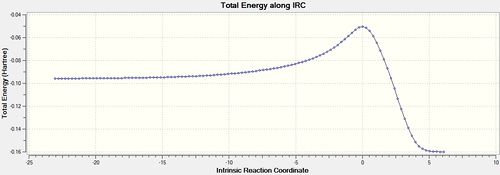
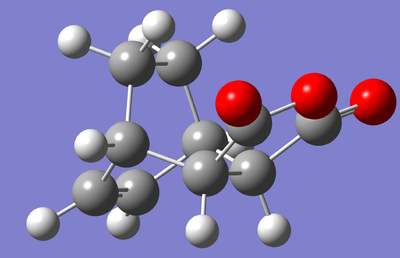
The IRC calculation finished after 111 steps with the total energy and RMS gradient plots shown below in figures 22 and 23. The structure of the transition state is shown in figure 5 and resembles the exo form as expected but now with full bonds. (DOI:10042/to-11283 )
 |
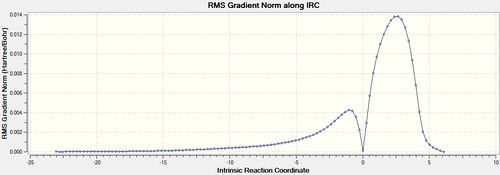 | |||
The RMS gradient is very close to zero (<0.001) at 3 points on the plot which correspond to the starting reactants (minimum), the transition state (maximum) and the products (minimum). The corresponding point on the total energy graph for the middle transition state maximum is when the energy is highest which makes sense. The shape of the total energy graph shows that the reaction is exothermic as the products are lower in energy than the reactants. This further agrees with the fact the reaction is under kinetic control as heat is being released and not put in to the system.
Endo
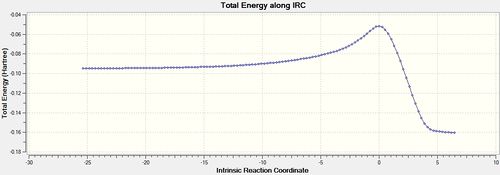
The IRC calculation finished after 124 steps with the total energy and RMS gradient plots shown below in figures 25 and 26. The structure at the maximum energy closely resembles the endo transition structure but now with full bonds between the two reactants. (DOI:10042/to-11284 )
 |
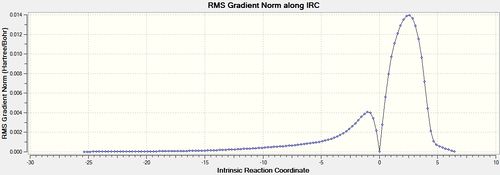 | |||

The shape of both graphs are similar to the exo adduct apart from the maxmimu energy on the total energy graph which is slightly different.
Comparison
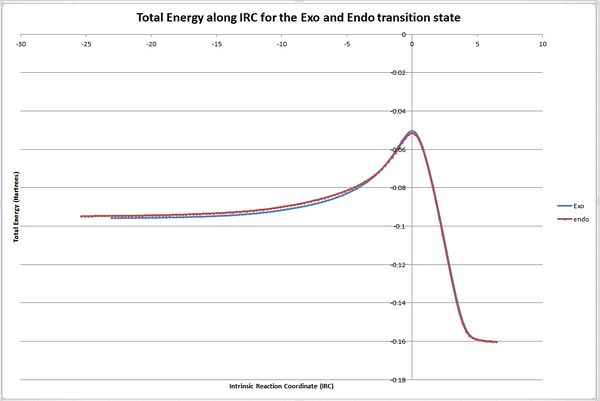
The data from both the exo and endo total energy plots was saved as a text file and inputted into excel to create a graph. This graphs showin both energy plots is shown below in figure 28. Figure 29 shows a zoomed in snapshot of the maximum energy.
 |
 | |||

It can be seen from the figures 28 and 29 that the barrier height for the endo form is lower than that of the exo form. This supports that the endo form is more kinetically stable as the transitional state barriers is lower in energy. It can also be seen from figure 30 that the endo adduct is lower in energy than the exo adduct suggesting it is more thermodynamically stable. However, this is incorrect as the exo form is more thermodynamically stable and the endo form is only formed due the reaction being under kinetic control. This error could be down to the semi-empirical method used. Using a more accurate DFT method might solve this problem.
Conclusion
In conclusion, computational methods using Gaussian 09W were successfully used to model the transition states of the cope rearrangement and the Diels-Alder reaction. Four different methods was used which were the TS berny opttimisation, the frozen coordinate method and the QST2 & QST3 methods. Vibrational frequency analysis was used to find the negative imaginary frequencies of the transition states which were animated to prove that they corresponded to the transition state. The Intrinsic Coordinate Method (IRC) was also important in determining which product was formed from a certain transition state and in determining the structure of a transition state.
The DFT/B3LYP/6-31G(d) method was shown to be more accurate than the HF/3-21G although requiring more computational demand. For the Diels-Alder calculations, the semi-empirical AM1 method was used to minimise the computational demand. To imporve the accuracy of the results, a more accurate method like DFT/B3LYP/6-31G(d) could be used instead to improve the results.
References and Citations
- ↑ A. H. Zewail, Femtochemistry: ultrafast dynamics of the chemical bond, volume 1, World Scientific Pub Co Inc, England, 1994, pp. 36-37
- ↑ 2.0 2.1 https://wiki.ch.ic.ac.uk/wiki/index.php?title=Mod:phys3
- ↑ A. H. Zewail, J. Phys. Chem. A, 2000, 104 (24),5660
- ↑ H. Rzepa, Pericyclic Reactions: Examples of sigmatropic reactions, 2010
- ↑ O. Wiest et al., J. Am. Chem. Soc., 1994, 116 (22), 10337
- ↑ 6.0 6.1 H. Rzepa, Conformational analysis: conformations of saturated, straight-chain hydrocarbons: σ-σ conjugation, 2011
- ↑ T. Frolov, Phys. Rev. B. 79, 2009, 79 (4), 045430
- ↑ https://wiki.ch.ic.ac.uk/wiki/index.php?title=Mod:phys3#Results_Table
- ↑ R. Sustmann, Pure Appl. Chem, 40 1974, 569
- ↑ B. P. Stoicheff, Tetrahedron, 17, 1962, 135-145
- ↑ Y. W. Goh, ''Org. Biomol. Chem.'', 5, 2007, 2354-2356


