Rep:Mod:IRONLENSE
Thomas Arrow - 1C
Molecular Mechanics
Cyclopentadiene Dimers
The energies of the endo and exo conformations for a cyclopentadiene dimer were analysed by molecular mechanics simulations using the MMFF94s[1] force-field using Avogadro Version 1.1.1 [2][3].
| Isomer | Exo (1) | Endo (2) |
|---|---|---|
| Structure | 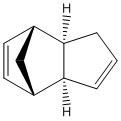
|
|
| 3d |
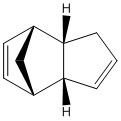
The molecules analysed are displayed in the table to the right. As shown the exo form has the cyclohexene ring bent towards the bridge while the endo form has it bent away.
The reported energies for these molecules from the MMFF94s force field are tabulated below. They are broken down by the parameter with which the energy is associated. A positive value is indicative of a higher energy conformation.
| 1 | 2 | |
|---|---|---|
| Bond Stretching | 3.54301 | 3.46731 |
| Angle Bending | 30.7729 | 33.19157 |
| Stretch Bending | -2.04139 | -2.08211 |
| Torsional | -2.73414 | -2.94776 |
| Out of Plane Bending | 0.0147 | 0.02172 |
| Van Der Waals | 12.80465 | 12.35789 |
| Electrostatic | 13.01375 | 14.18217 |
| Total | 55.37349 | 58.19078 |
It is trivial to see that the exo isomer is the more thermodynamically stable form however it is not the predominant isomer. Discrepancies in the contributions to the energy from different elements of the force-field can give us an insight into the reason for this. Particularly different are the contributions from Angle Bending and Electrostatic terms with the endo form being more strained in both cases. This is probably due to the approach of the cyclohexene ring to the bridged ring.
This suggests that the preference of endo over exo is a kinetic effect. It is often stated that this is due to better HOMO-LUMO overlap in the endo transiton state than the exo transition state[4]. Another suggested possibility is that the reaction is not concerted and the endo transition state is better at stabilising the charge build up than then exo one. [5]
Hydrogenation of Cyclopentadiene Dimers
| Isomer | (3) | (4) |
|---|---|---|
| Structure | 
|

|
A further analysis that was undertaken is the hydrogenation of the lower energy endo isomer. Calculations were attempted in order to determine that the hydrogenation of which C=C would result in the lowest energy product. This was also done using Avogadro and the MMFF94s force field and the results are tabulated below.
| 3 | 4 | |
|---|---|---|
| Bond Stretching | 3.30673 | 2.82302 |
| Angle Bending | 30.85321 | 24.68566 |
| Stretch Bending | -1.92617 | -1.65715 |
| Torsional | 0.07598 | -0.37815 |
| Out of Plane Bending | 0.01515 | 0.00028 |
| Van der Waals | 13.27693 | 10.63680 |
| Electrostatic | 5.12098 | 5.14702 |
| Total | 50.72282 | 41.25749 |
It is apparent that the isomer 4 is of much lower energy than 3. This appears to be predominantly due to the reduced Angle Bending. This is because hydrogenation alpha to the bridge head results in pulling the bridge apart and greatly increasing strain.
Atropisomerism in Taxol Precursors
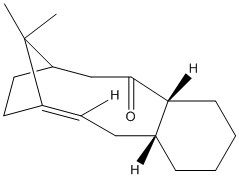
It is possible to investigate the stability of other types of isomer using molecular mechanics such as atropisomerism. This has been performed in a similar manner to that under taken above using Avogadro and the MMFF94s forcefield on the two atropisomers of a Taxol precursor. The structures are shown to the right. Tabulated below are the force field energetics for the molecule.
| Isomer | (9) | (10) |
|---|---|---|
| Structure | 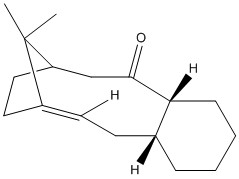
|
|
| 3d |
| 9 | 10 | |
|---|---|---|
| Bond Stretching | 14.89204 | 7.14091 |
| Angle Bending | 48.49693 | 22.75468 |
| Stretch Bending | -0.59339 | -0.22705 |
| Torsional | 7.99095 | -2.05224 |
| Out of Plane Bending | 2.55739 | 0.65304 |
| Van Der Waals | 51.13121 | 31.98513 |
| Electrostatic | 1.88198 | 0.84285 |
| Total | 126.35710 | 61.09732 |
Again, one isomer is clearly far more stable than the other. The second isomer with the carbonyl group pointing away from the bridge and methyl group is far more stable. We can see from the breakdown that this is mostly due to the Bond Stretching, Angle Bending and Van der Waals energies. This is probably due to the repulsive effects for placing the carbonyl so close to the bridge and methyl group. It is very hard to hydrogenate these because they are hyperstable alkenes. They are "less strained than the parent hydrocarbon"[6]
NMR Prediction of Taxol Isomer Precursor
The molecule shown to the right (18) is also a taxol precursor and is able to exhibit atropisomerism in the same manner as molecules 9 and 10 above.
A structure for this was designed in Avogadro [2] and optimized using the MMFF94s forcefield.
The molecule was optimised and then the decoupled hydrogen and carbon NMR spectra calculated using the B3LYP level of theory and a 6-31G(d,p) basis set.[7]
The optimised molecule is shown to the right along with the NMR specta.
| Structure | 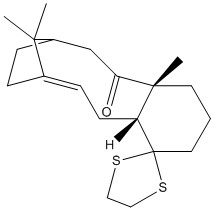 |
|---|---|
| H NMR | 
|
| C NMR | 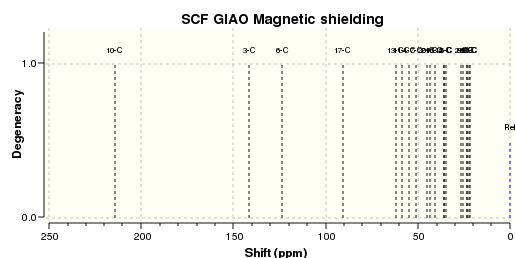
|
We can see that this is broadly in line with the literature[8] which lists the shifts observed as follows:
| δ 5.21 (M, 1H), 3.00-2.70 (m, 6H), 2.70-2.35 (m,4H), 2.20-1.70 (m, 6H), 1.58 (t, J=5.4Hz, 1H) 1.50-1.20(m, 3H), 1.10 (s, 3H), 1.07 (s, 3H), 1.03 (s, 3H) |
| 211.49 148.72 120.90 74.61 60.53 51.30 50.94, 45.53, 43.28, 40.82, 38.73, 36.78, 35.47, 30.84, 30.00, 25.567, 25.35, 22.21, 21.39, 19.83 |
Obviously the calculated proton NMR does not exhibit any coupling and has a number of shifts which are incorrectly located. This is also due to the fact that shifts that would normally be averaged by the thermal rotation of bonds is not present resulting in more signals than expected.
The Carbon NMR on the other hand seems to match the experimental data quite closely in both value and trend. This is helped by the fact that one does not normally observe coupling in Carbon-13 NMR because it is often proton decoupled and not abundant enough to observe coupling with an adjacent carbon.
Asymmetric Epoxidation
In the 1S lab experiment it is required to epoxidise two different alkenes using two catalysts developed by Jacobsen and Shi. In this section an analysis is performed on the structures of these catalysts as well and that of the epoxides.
Structures of Asymmetric Epoxidation Catalysts
The structures of these catalysts are available in the Cambridge Crystallographic Database[10][11] which was interrogated using ConQuest[12] and then the found structures viewed using Mercury[13].
Shi Catalyst
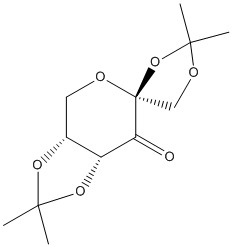
The structure of this molecule is shown to the right Thechnical it is a precatalyst that is oxidised to the active species that is an oxirane. It was developed by Shi et al.[14]. The crystal structure of the molecule is accessible below.
An interesting thing to note is the lengths of the anomeric carbon bonds in this molecule which are depicted below.
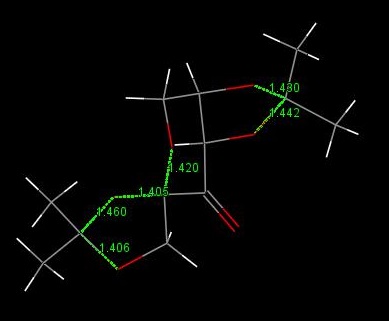
Clearly some are far longer than others. This is due to the anomeric effect. I.E. in the longest bond the lone pair on the two adjacent oxygen atoms are both well able to partially donate their lone pairs into the C-O σ* orbital. The alignment for this is better in the longest bond and gradually gets worse as the bonds shorted because the lone pairs are twisted away from the σ* orbital.
Jacobsen Catalyst

The structure of this molecule is shown to the right and the crystal structure is displayed below
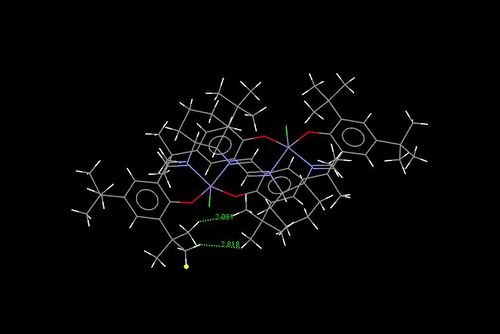
It is interesting to note the very close approach of the tBu groups on the benzene rings as shown in the image below. This restricts the side from which the center of the molecule can be accessed by the alkene. The shorter distance ca. 2Å is less than the sum of the Van der Waals radii of hydrogen[15] and thus totally shields this side of the molecule.
NMR Spectra of Selected Epoxides
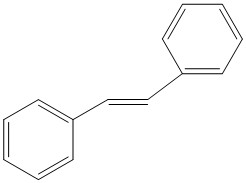
The two alkenes to be epoxidised are transβ-Methylstyrene and Stilbene. The structures of these are shown to the right.
| Alkene | transβ-Methylstyrene | Stilbene |
|---|---|---|
| Structure | 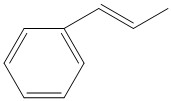
|
|
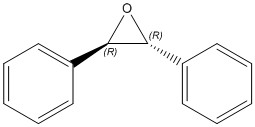
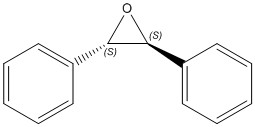
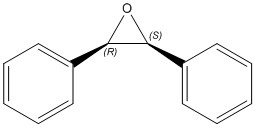
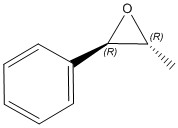
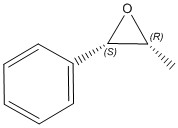
These can be epoxidised to the products tabulated below.
| trans(R,R)-Stilbene Oxide | trans(S,S)-Stilbene Oxide | cis-β-Stilbene Oxide |
|---|---|---|
|
|
|
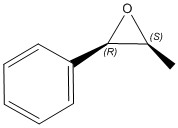
| trans(R,R)-β-Methylstyrene Oxide | trans(S,S)-β-Methylstyrene Oxide | cis(S,R)-β-Methylstyrene Oxide | cis(R,S)-β-Methylstyrene Oxide |
|---|---|---|---|
|

|
|
|
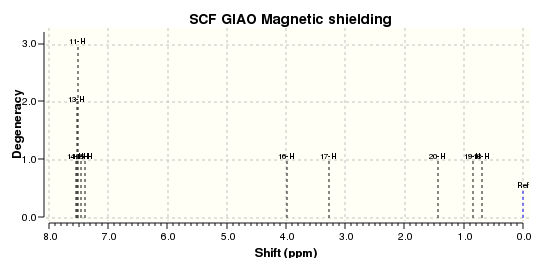
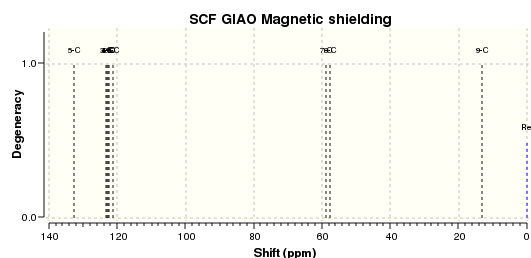
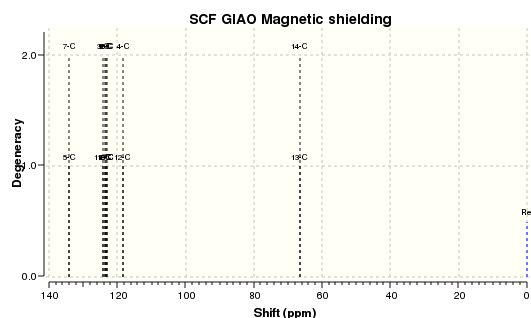
The NMR spectra of the enantiomers will be the same thus it is only necessary to calculate the spectra from one of each. This was undertaken at the B3LYP level of theory and with the 6-31G(d,p) basis set. The calculated spectra are shown below.
Stilbene Oxide
| Trans-Stilbene Oxide Proton NMR | Trans-Stilbene Oxide Carbon NMR |

|

|
| Cis-Stilbene Oxide Proton NMR | Cis-Stilbene Oxide Carbon NMR |
|
|
Clearly it is possible to differentiate between the two diastereomers of Stilbene oxide by NMR. For example we can observe a general increase in shielding of in the cis isomer versus the trans isomer. By comparison of these spectra with future experimental spectra it will be possible to identify which isomers are formed or if there is a mixture.
It is also beneficial to make a comparison to the literature values of these shifts to confirm the results of the calculations.
| (400 MHz; CDCl3) = 7.42–7.52 (10H, m), 3.98 (2H, s) |
| (100 MHz; CDCl3) = 137.7, 129.1, 128.8, 126.1, 63.3 |
| (400 MHz; CDCl3) = 7.21(M, 10H) 4.39(S 2H) |
| (100 MHz; CDCl3) = 134.8, 128.7, 127.6, 127.3, 60.2 |
The marked deviation of the calculations from the literature is the presence of a number of highly shielded peaks. This suggests that perhaps the calculation should be rerun. All peaks in this molecule should (by common sense) be quite deshielded as they are either aromatic or part of the epoxide group.
β-Methystyrene Oxide
| Trans-β-Methystyrene Oxide Proton NMR | Trans-β-Methystyrene Oxide Carbon NMR |

|
|
| Cis-β-Methystyrene Oxide Proton NMR | Cis-β-Methystyrene Oxide Carbon NMR |
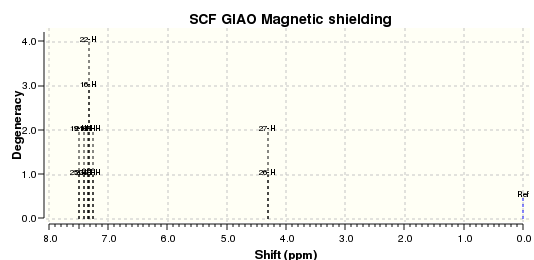
|
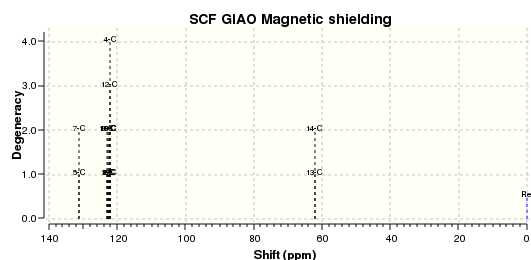
|
The literature values for comparison are given below:
| (100 MHz; CDCl3) = 7.36-7.24 (m, 5H),
3.57 (d, J=2.0 Hz, 1H), 3.04 (dq, J =2.0, 5.4 Hz, 1H), 1.45 (d, J =5.4 Hz, 3H) |
| (100 MHz; CDCl3) = 137.7, 128.4, 128.0, 125.5, 59.5, 59.0, 17.9 |
| (400 MHz; CDCl3) = 7.37-7.27 (m, 5H),
4.06 (d, J=4.4 Hz, 1H), 3.34 (dq, J=4.4, 5.4 Hz, 1H), 1.09 (d, J=5.4Hz, 3H) |
| (100 MHz; CDCl3) = δ 135.5, 128.0, 127.5, 126.6, 57.5, 55.1, 12.5 |
Determining the Chirality of Epoxides
Determining the optical rotation of a given molecule can be performed entirely computationally and thus by taking an experimental reading of optical rotation it is possible to assign the absolute chirality of a sample.
Calculations were performed on one of each of the enantiomeric pairs of chiral molecules (but not on the cis-Stilbene Oxide which is an achiral meso compound) using Gaussian at the CAM-B3LYP[18] level with the 6-311++g(2df,p) basis set. It was assumed that for speed the other enantiomer of each pair will rotate the same angle in the other direction however with more time it may be interesting to check this.
Stilbene Oxide
| Isomer | RR | SS |
|---|---|---|
| Literature | 250.8°[19],239.2°[20] | -205.2°[21] |
| Calculated | 298.21°[22] | Not Calculated |
In this case the literature is in general accordance with the calculated data but not precisely the same. It is at least of the correct sign.
cis-β-Methylstyrene Oxide
| Isomer | SR | RS |
|---|---|---|
| Literature | 38.6°[17] | 37.8°[21] |
| Calculated | 37.42°[23] | Not Calculated |
Clearly there is a very close correlation between the literature data and the calculated data in this case.
trans-β-Methylstyrene Oxide
| Isomer | RR | SS |
|---|---|---|
| Literature | 45.7°[24] | -43.6°[24] |
| Calculated | Not Calculated | -46.77° [25] |
Again, the literature is in good accordance suggesting a successful calculation.
In general this means that calculating optical rotation at the B3LYP-CAM level seems to be a good way of predicting the rotation in reality. It is an easy and efficient way to determine the absolute stereochemistry of a molecule with optical rotation data available.
Analysis of Transition States
It is also possible to predict the result of an epoxidation of a given alkene with a given catalyst entirely in sillico by modelling the various possible transition states and then looking for the lowest energy path way. In this project this has not been done exhaustively because it would require determining all likely transition states and then comparing the energy surfaces. However an example of methods that could be used to undertake this are shown using transition states that have been precomputed by H Rzepa.
Relative Energies of β-Methylstyrene Transition States
The table below shows the relative energies of the transitions states of a Shi catalyst epoxidation calculated by H Rzepa.
| RR | SS |
|---|---|
| -1343.022970(Ha)[26] | -1343.017942(Ha)[27] |
| -1343.019233(Ha)[28] | -1343.015603(Ha)[29] |
| -1343.029272(Ha)[30] | -1343.023766(Ha)[31] |
| -1343.032443(Ha)[32] | -1343.024742(Ha)[33] |
These can all then be converted into kJ/mol using 1Ha=2.63*106Jmol-1[34] From this it is possible to find the relative rates of population of each transition state at 300K using ΔG=-RTlnK. We can then find the ratio of the transition states that lead to each isomer and finally convert to enantiomeric excess.
| RR | SS |
|---|---|
| -3532150411 | -3532137187 |
| -3532140583 | -3532131036 |
| -3532166985 | -3532152505 |
| -3532175325 | -3532155071 |
| RR | SS |
|---|---|
| 24913.99 | 38137.63 |
| 34742.3 | 44289.2 |
| 8339.73 | 22820.51 |
| 0 | 20253.63 |
| RR | SS |
|---|---|
| 2.19E+04 | 4.40E+06 |
| 1.13E+06 | 5.19E+07 |
| 2.84E+01 | 9.45E+03 |
| 1.00E+00 | 3.38E+03 |
| Enantiomeric Excess | ||
| RR | SS | |
|---|---|---|
| Sum of Ks | 1.15E+06 | 5.63E+07 |
| Mol Fraction | 2.00E-02 | 9.80E-01 |
| Enantiomeric excess | 96% |
Weak interactions in the Shi transition state
Below is a QTAIM analysis of an SS transition state of β-Methylstyrene with the Shi catalyst[33]. This shows as yellow spheres the bond critical points which are the points where the turning points of electron density with respect to all spacial dimensions lie. This allows a visualization of the length of possible weak interactions.

Also performed on the same transition state[33] is a Non-Covalent interaction analysis. This shows areas of positive electronic interactions in green and repulsive interactions in red. You can see the large number of green interactions guiding in the alkene.
View NCI |
Other Alkenes
A search using Reaxys was conducted to find alternative small size alkenes with a small optical rotation that could potentially be used in future labs.
A possible alkene to use would be hex-1-ene which would result in (1,2)epoxy hexane. This has an optical rotation of ca. 11°[35]
References
- ↑ Merck molecular force field. I. Basis, form, scope, parameterization, and performance of MMFF94, Thomas A. Halgren, J. Comp. Chem.; 1996; 490-519, DOI:<490::AID-JCC1>3.0.CO;2-P 10.1002/(SICI)1096-987X(199604)17:5/6<490::AID-JCC1>3.0.CO;2-P
- ↑ 2.0 2.1 http://avogadro.openmolecules.net/
- ↑ Marcus D Hanwell, Donald E Curtis, David C Lonie, Tim Vandermeersch, Eva Zurek and Geoffrey R Hutchison; "Avogadro: An advanced semantic chemical editor, visualization, and analysis platform", Journal of Cheminformatics 2012, 4:17 DOI:10.1186/1758-2946-4-17
- ↑ Hoffmann, Roald, and Robert B. Woodward. "Conservation of orbital symmetry." Accounts of Chemical Research 1.1 1968: 17-22.
- ↑ Sauer, J. and Sustmann, R. 1980, Angew. Chem. Int. Ed. Engl., 19: 779–807DOI:10.1002/anie.198007791
- ↑ Wilhelm F. Maier and Paul Von Rague Schleyer Journal of the American Chemical Society 1981 103 (8), 1891-1900DOI:10.1021/ja00398a003
- ↑ DOI:10042/27290
- ↑ Spectroscopic data: L. Paquette, N. A. Pegg, D. Toops, G. D. Maynard, R. D. Rogers, J. Am. Chem. Soc.,, 1990, 112, 277-283. DOI:10.1021/ja00157a043
- ↑ 9.0 9.1 9.2 9.3 9.4 Mathew W.C. Robinson, Kathryn S. Pillinger, Ian Mabbett, David A. Timms, Andrew E. Graham Tetrahedron, Volume 66, Issue 43, 23 October 2010, Pages 8377-8382,DOI:10.1016/j.tet.2010.08.078
- ↑ "The United Kingdom Chemical Database Service", Fletcher, D.A., McMeeking, R.F., Parkin, D., J. Chem. Inf. Comput. Sci. 1996, 36, 746-749.
- ↑ The Cambridge Structural Database: a quarter of a million crystal structures and rising F. H. Allen, Acta Crystallogr., B58, 380-388, 2002
- ↑ New software for searching the Cambridge Structural Database and visualising crystal structures I. J. Bruno, J. C. Cole, P. R. Edgington, M. Kessler, C. F. Macrae, P. McCabe, J. Pearson and R. Taylor, Acta Crystallogr., B58, 389-397, 2002
- ↑ Mercury: visualization and analysis of crystal structures C. F. Macrae, P. R. Edgington, P. McCabe, E. Pidcock, G. P. Shields, R. Taylor, M. Towler and J. van de Streek, J. Appl. Cryst., 39, 453-457, 2006
- ↑ O. A. Wong , B. Wang , M-X Zhao and Y. Shi J. Org. Chem., 2009, 74, 335–6338;DOI:10.1021/jo900739q
- ↑ R. Scott Rowland* and and Robin Taylor* The Journal of Physical Chemistry 1996 100 (18), 7384-7391 DOI:10.1021/jp953141+
- ↑ Bruyneel, F., Letondor, C., Bastürk, B., Gualandi, A., Pordea, A., Stoeckli-Evans, H. and Neier, R. (2012), Catalytic Epoxidation of Alkenes by the Manganese Complex of a Reduced Porphyrinogen Macrocycle. Adv. Synth. Catal., 354: 428–440.DOI:10.1002/adsc.201100433
- ↑ 17.0 17.1 17.2 17.3 17.4 Koya, S., Nishioka, Y., Mizoguchi, H., Uchida, T. and Katsuki, T. (2012), . Angew. Chem. Int. Ed., 51: 8243–8246. DOI:10.1002/anie.201201848
- ↑ Takeshi Yanai, David P Tew, Nicholas C Handy, Chemical Physics Letters, Volume 393, Issues 1–3, 21 July 2004, Pages 51-57, ISSN 0009-2614 DOI:10.1016/j.cplett.2004.06.011.
- ↑ Fox, David J.; Pedersen, Daniel Sejer; Petersen, Asger B.; Warren, Stuart Organic and Biomolecular Chemistry, 2006 , vol. 4, # 16 p. 3117 - 3119 DOI:10.1039/B606881B
- ↑ Denmark, Scott E.; Matsuhashi, Hayao Journal of Organic Chemistry, 2002 , vol. 67, # 10 p. 3479 - 3486 DOI:10.1021/jo020050h
- ↑ 21.0 21.1 Takashi Niwa and Masahisa Nakada Journal of the American Chemical Society 2012 134 (33), 13538-13541DOI:10.1021/ja304219s
- ↑ DOI:10042/27370
- ↑ DOI:10042/27371
- ↑ 24.0 24.1 S Pedragosa-Moreau, A Archelas, R Furstoss, Tetrahedron, Volume 52, Issue 13, 25 March 1996, Pages 4593-4606, ISSN 0040-4020DOI:10.1016/0040-4020(96)00135-4 10.1016/0040-4020(96)00135-4
- ↑ DOI:10042/27369
- ↑ DOI:10.6084/m9.figshare.738028
- ↑ DOI:10.6084/m9.figshare.738038
- ↑ DOI:10.6084/m9.figshare.749615
- ↑ DOI:10.6084/m9.figshare.739115
- ↑ DOI:10.6084/m9.figshare.738036
- ↑ DOI:10.6084/m9.figshare.739116
- ↑ DOI:10.6084/m9.figshare.738037
- ↑ 33.0 33.1 33.2 DOI:10.6084/m9.figshare.739117
- ↑ IUPAC. Compendium of Chemical Terminology, 2nd ed. (the "Gold Book"). Compiled by A. D. McNaught and A. Wilkinson. Blackwell Scientific Publications, Oxford (1997). XML on-line corrected version: http://goldbook.iupac.org (2006-) created by M. Nic, J. Jirat, B. Kosata; updates compiled by A. Jenkins. ISBN 0-9678550-9-8DOI:10.1351/goldbook
- ↑ Berkessel, A. and Ertürk, E. (2006), Adv. Synth. Catal., 348: 2619–2625.DOI:10.1002/adsc.200606181
