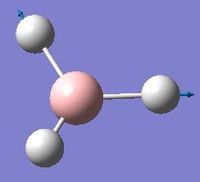
Rep:Mod:IFTdw2fe3
Part 1: Optimisation of BH3
Optimisation using 3-21G basis set
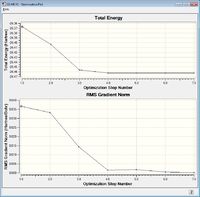
- File Name = TFI_BH3_OPT
- File Type = .log
- Calculation Type = FOPT
- Calculation Method = RB3LYP
- Basis Set = 3-21G
- Charge = 0
- Spin = Singlet
- E (RB3LYP) = -26.46226429 a.u. ← Total energy for optimised structure.
- RMS Gradient Norm = 0.00008851 a.u.
- Imaginary Freq = N/A
- Dipole Moment = 0.0003 Debye
- Point Group = CS
- Job cpu time: 7 minutes 23.0 seconds.
Optimised bond distances (in Angstroms, Å):
- 1.19480 (B-H1)
- 1.19445 (B-H2)
- 1.19467 (B-H3)
However, the bond distances are only accurate to 0.01 Å and so from now on, values will be given to the appropriate degree of accuracy. The optimised B-H bond distance is therefore 1.19 Å.
Optimised angles:
- 119.986o (H2-B-H1)
- 119.998o (H3-B-H2)
- 120.016o (H1-B-H3)
As with bond distance, there is an error associated with the calculated results. Bond angles are accurate to 0.1o. The optimised H-B-H bond angle is therefore 120.0o.
Final set of forces and displacements:
Item               Value     Threshold  Converged?
 Maximum Force            0.000220     0.000450     YES
 RMS     Force            0.000106     0.000300     YES
 Maximum Displacement     0.000709     0.001800     YES
 RMS     Displacement     0.000447     0.001200     YES
 Predicted change in Energy=-1.672479D-07
 Optimization completed.
    -- Stationary point found.
The same optimisation was again carried out, using instead a D3h symmetry constraint (as opposed to giving each bond distance a different value). The results were extremely similar to those above, the final energy obtained was:
- -26.46226433 a.u.
This represents a difference of 0.0000004 a.u., a very small value.
Optimisation using 6-31G(d,p) basis set
- File Name = TFI_BH3_OPT_631GDP
- File Type = .log
- Calculation Type = FOPT
- Calculation Method = RB3LYP
- Basis Set = 6-31G(d,p)
- Charge = 0
- Spin = Singlet
- E (Final energy for RB3LYP) = -26.61531648 a.u. ← Total energy for optimised structure.
- RMS Gradient Norm = 0.00055333 a.u.
- Imaginary Freq = N/A
- Dipole Moment = 0.0004 Debye
- Point Group = CS
- Job cpu time: 12.0 seconds.
Optimised bond distance = 1.19 Å
Optimised bond angle = 120.0o
Final set of forces and displacements:
Item               Value     Threshold  Converged?
 Maximum Force            0.000012     0.000450     YES
 RMS     Force            0.000008     0.000300     YES
 Maximum Displacement     0.000061     0.001800     YES
 RMS     Displacement     0.000038     0.001200     YES
 Predicted change in Energy=-1.069288D-09
 Optimization completed.
    -- Stationary point found.
Part 2: More complex optimisations and pseudo-potentials
Optimisation of GaBr3 using LanL2DZ basis set
- File Name = TFI_GaBr3_OPT_LanL2DZ_OUTPUT
- File Type = .log
- Calculation Type = FOPT
- Calculation Method = RB3LYP
- Basis Set = LANL2DZ
- Charge = 0
- Spin = Singlet
- E(Final energy for RB3LYP) = -41.70082783 a.u. ← Total energy for optimised structure.
- RMS Gradient Norm = 0.00000016 a.u.
- Imaginary Freq = N/A
- Dipole Moment = 0.0000 Debye
- Point Group = D3H
- Job cpu time: 13.8 seconds.
Optimised bond distance = 2.35018 Å
Optimised angle = 120.0o
Item               Value     Threshold  Converged?
 Maximum Force            0.000000     0.000450     YES
 RMS     Force            0.000000     0.000300     YES
 Maximum Displacement     0.000003     0.001800     YES
 RMS     Displacement     0.000002     0.001200     YES
 Predicted change in Energy=-1.282690D-12
 Optimization completed.
    -- Stationary point found.
Optimisation of BBr3 using a mixture of basis sets and pseudo-potentials
- File Name = TFI_BBr3_OPT_GEN_OUTPUT
- File Type = .log
- Calculation Type = FOPT
- Calculation Method = RB3LYP
- Basis Set = Gen
- Charge = 0
- Spin = Singlet
- E(RB3LYP) = -64.43645013 a.u. ← Total energy for optimised structure.
- RMS Gradient Norm = 0.00000965 a.u.
- Imaginary Freq = N/A
- Dipole Moment = 0.0004 Debye
- Point Group = CS
- Job cpu time: 20.7 seconds.
Optimised bond distance = 1.93Å
Optimised angle 120.0o
         Item               Value     Threshold  Converged?
 Maximum Force            0.000015     0.000450     YES
 RMS     Force            0.000009     0.000300     YES
 Maximum Displacement     0.000069     0.001800     YES
 RMS     Displacement     0.000041     0.001200     YES
 Predicted change in Energy=-1.505647D-09
 Optimization completed.
    -- Stationary point found.
Bond Distance Analysis
| Molecule | Average Bond Distance (Å) | Literature Value for BD (Å) |
| B-H | 1.19 | 1.19 [1] |
| B-Br | 1.93 | 1.88[2] |
| Ga-Br | 2.35 | [2.30]*[3] |
*2.30 refers to the average bond distance for a Ge-Br bond.
As may be expected, increasing the atomic radius of the atoms involved leads to an increase in bond distance between central atom and ligand. From the results we see that increasing the size of the ligand (from H to Br) leads to around 60% increase in bond distance. In the same way, increasing the size of the central bond (B to Ga) leads to around 20% increase in bond distance.
In a general sense, increasing the radius of an atom increases the electron density surrounding the nucleus. This means that the valence electrons (the electrons most involved in interatomic interactions) are held less tightly to the nucleus, resulting in weaker bonding interactions between atoms.
Chemically, there are many different types of favourable interactions that can be considered ‘bonds’. Examples of the strongest of these interactions include ion-ion, ion-dipole and dipole-dipole interactions. Each of these relies on the highly attractive forces between electron deficient species and electron rich species. Another way in which chemists rationalise favourable bonding interactions is organising atoms so that as many atoms as possible have a full valence shell of electrons in a given molecule. This involves drawing hypothetical lines in between atoms to denote the sharing of a pair of electrons, where each individual electron has come from each separate atom involved in the bond. The resulting representation is most commonly used in describing covalently bound structures. It is worth mentioning that there are several diagrammatic representations commonly employed by chemists to indicate different types of bonding interactions, drawing lines between atoms is one of these.
Part 3: Frequency and MO Analysis
Frequency Analysis for BH3
File:TFI BH3 OPT D3H 631GDP FREQ.txt
By convention, frequency is reported in wavenumbers, and with no decimal places. The exception is when copying the low frequencies from output data files into the wiki (these are kept in their raw format). Low frequencies:
Low frequencies ---   -0.9432   -0.8611   -0.0054    5.7455   11.7246   11.7625
 Low frequencies --- 1162.9963 1213.1826 1213.1853
Frequency analysis was first carried out on a molecule of BH3 optimised by changing each of the bond distances to different values. This however, resulted in low frequencies of above 15cm-1. The molecule was instead optimised using a tight D3h point group constraint, which yielded the acceptable results above.

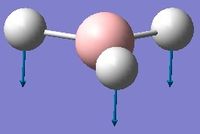
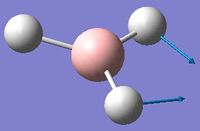
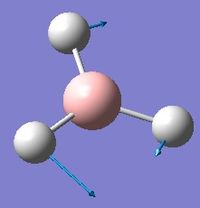
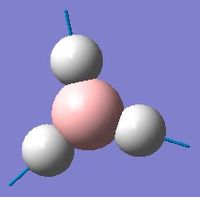
With reference to the above table, frequencies for modes 2 and 3 have an almost identical value and will therefore merge into the same peak. The same can be said for modes 5 and 6. Mode 4 has 0 intensity, possibly because more energy is required to excite this mode, and will not produce a peak in the IR spectrum. Therefore, only 3 out of 6 real frequencies appear on the calculated IR.
Frequency Analysis for GaBr3
Link to frequency analysis of GaBr3

Low frequencies ---   -0.5252   -0.5247   -0.0024   -0.0010    0.0235    1.2010
 Low frequencies ---   76.3744   76.3753   99.6982
| Motion | Frequency | Intensity | Symmetry of D3h Point Group | Description |
| 1.IMAGE | 76 | 3.3447 | E' | 2 rocking ligands, 1 ligand scissoring with the other 2. Vectors each of the same length, moving in plane of molecule. |
| 2.IMAGE | 76 | 3.3447 | E' | C2 Symmetric scissoring. 2 ligands vibrate along the plane. The 3rd ligand does not vibrate with respect to central ligand. |
| 3.IMAGE | 100 | 9.2161 | A2 | Central atom has a large vector orthogonal to the plane. C3</3> symmetrical wagging. |
| 4.IMAGE | 197 | 0.0000 | A1' | C3 symmetrical stretching. 3 vectors of equal intensities for each of the 3 ligands, pointing out from the central atom, along the plane. |
| 5.IMAGE | 316 | 57.0704 | E' | 2 ligands undergoing asymmetrical stretching. 3rd ligand does not move. Central atom has a large vector, moving back and forth between 2 stretching ligands. |
| 6.IMAGE | 316 | 57.0746 | E' | 2 ligands undergoing symmetrical stretching. 3rd ligand undergoing asymmetrical stretching with other 2, and has a larger vector component. |
The lowest 'real' bond mode for GaBr3 is 76.
Vibrational Frequency Analysis
| Mode | Vibrational frequency BH3 | Vibrational frequency GaBr3 |
| 1 | 1163 | 76 |
| 2 | 1213 | 76 |
| 3 | 1213 | 100 |
| 4 | 2582 | 197 |
| 5 | 2715 | 316 |
| 6 | 2715 | 316 |
Generally speaking, the vibrating frequencies in GaBr3 are much lower than for BH3. Using simple harmonic motion, the frequency of oscillation is inversely proportional to the square root of mass. For each molecule, the ‘mass’ indicated in simple harmonic motion will refer to the reduced mass between central atom and ligand in this case. It follows that the reduced mass for GaBr is much greater than for BH.
The ordering of the first three modes (A2’’, E’ and another E’) differs between these two molecules. But in both cases, there are two sets of E’ symmetric modes, each set having near-identical values for frequency and intensity. With reference to BH3, modes 2 and 3 are similar, both of which may be thought of as bond ‘wobbling’ modes. Modes 5 and 6 are both based on stretching and contracting bonds. In order for frequencies of two modes to be similar, the total energy of the vectors must be near equivalent. The latter modes are higher in energy due to the increased repulsive forces experienced upon contracting bond distances to below equilibrium length.
The accompanying IR spectra have clear similarities. Both have three distinct peaks, one of which is significantly higher in frequency than the other two, and is of a higher intensity. This similarity is to be expected from molecules of identical symmetry.
The same method and basis sets are used for frequency analysis as for optimisation because optimisations need to be checked before proceeding to analysis. Carrying out frequency analysis using the same criterion means there will be no change in the optimisation of the molecule during analysis. Using another method or basis set could lead to problems or unrealistic data, if the criteria turn out to be unsuitable for the job.
The low frequencies represent the ‘-6’ frequencies from 3N-6 vibrational modes in non-linear molecules. These are the total number of vibrational and rotational degrees of freedom (3 for translation and 3 for rotation. Gaussian can calculate symmetric modes that would not be found experimentally. This is because IR spectroscopy relies on a change in dipole moment, a trait that none of the above vibrations have.
One of the reasons why frequency analysis is useful is in assessing how well a computer model has been optimised. This can be done by observing the ‘low frequencies’ (included above) and ensuring they are very small in comparison to the ‘real’ frequencies of the molecule.
The A2’’ mode is at a higher frequency for GaBr3 than BH3 due to the inertia of each of three Br atoms causing large displacement of the central Ga atom.
MO Analysis of BH3
Link to optimised BH3
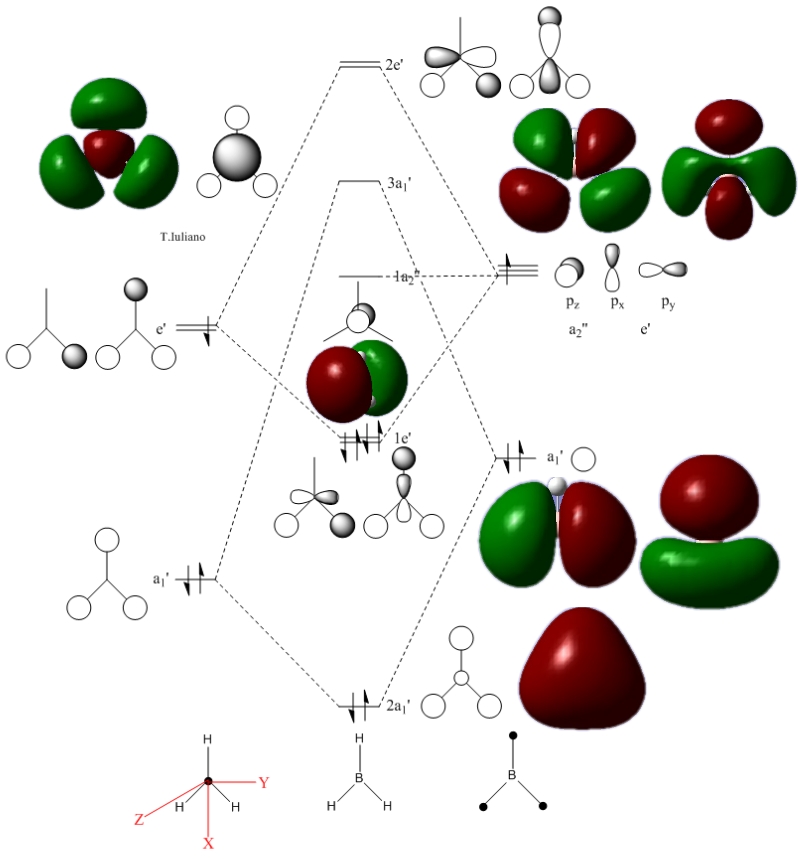
The main noticeable discrepancy between the calculated and theoretical model, is the relative size of the contributing orbitals. In theory, frontier orbitals which contribute more to the overall molecular oribital are given a larger size. This is common for atoms of differing electronegativities (B is more electropositive than H). The calculated NBOs have not depicted this, or at least not noticably. On the other hand, the shape of the NBOs translates very well onto the theoretical orbital combinations. This consistency supports MO theory and it becomes useful in predicting molecular characteristics such as spatial geometries of molecules. NBO number 6 would not be considered an accurate NBO due to the shape of the central orbital lobe. It’s shape is not consistent with the theoretical s-type shape (spherical).
NH3
NH3 Optimisation using 6-31G(d,p) basis set and opt=tight int=ultrafine.
File:TFI NH3 NOSYMM TIGHT.txt
- File Name = TFI_NH3_NOSYMM_TIGHT
- File Type = .log
- Calculation Type = FOPT
- Calculation Method = RB3LYP
- Basis Set = 6-31G(d,p)
- Charge = 0
- Spin = Singlet
- E(RB3LYP) = -56.55776872 a.u.
- RMS Gradient Norm = 0.00000095 a.u.
- Imaginary Freq = N/A
- Dipole Moment = 1.8465 Debye
- Point Group = C1
- Job cpu time: 21.0 seconds.
Item               Value     Threshold  Converged?
 Maximum Force            0.000002     0.000015     YES
 RMS     Force            0.000001     0.000010     YES
 Maximum Displacement     0.000005     0.000060     YES
 RMS     Displacement     0.000003     0.000040     YES
 Predicted change in Energy=-9.677657D-12
 Optimization completed.
    -- Stationary point found.
Frequency analysis of NH3
Low frequencies ---   -6.6377   -4.9418   -0.0013   -0.0013   -0.0009    0.9806
 Low frequencies --- 1089.3492 1693.9254 1693.9297
Population analysis of NH3
File:TFI NH3 NOSYMM TIGHT MO.chk
Charge Distribution (scale from -1.132 to +1.132) shows that the central N atom is very electronegatively charged in comparison to the H ligands. The specific NBO charges are as follows:
- N = -1.132
- H = 0.377
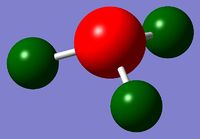
Natural Population Analysis
                Natural  -----------------------------------------------
    Atom  No    Charge         Core      Valence    Rydberg      Total
 -----------------------------------------------------------------------
      N    1   -1.13220      1.99981     6.11805    0.01434     8.13220
      H    2    0.37740      0.00000     0.62045    0.00214     0.62260
      H    3    0.37740      0.00000     0.62045    0.00214     0.62260
      H    4    0.37740      0.00000     0.62045    0.00214     0.62260
 =======================================================================
   * Total *    0.00000      1.99981     7.97941    0.02078    10.00000
Ammonia Borane
Optimisation of BH3NH3 using a 6-31G(d,p) basis set.
File:TFI BH3 NH3 TIGHT.txt
- File Name = TFI_BH3NH3_OPT_TIGHT
- File Type = .log
- Calculation Type = FOPT
- Calculation Method = RB3LYP
- Basis Set = 6-31G(d,p)
- Charge = 0
- Spin = Singlet
- E(RB3LYP) = -83.22468908 a.u.
- RMS Gradient Norm = 0.00000062 a.u.
- Imaginary Freq = N/A
- Dipole Moment = 5.5646 Debye
- Point Group = C1
- Job cpu time: 3 minutes 29.0 seconds.
Item               Value     Threshold  Converged?
 Maximum Force            0.000001     0.000015     YES
 RMS     Force            0.000000     0.000010     YES
 Maximum Displacement     0.000013     0.000060     YES
 RMS     Displacement     0.000006     0.000040     YES
 Predicted change in Energy=-1.671374D-11
 Optimization completed.
    -- Stationary point found.
Frequency analysis of Ammonia Borane
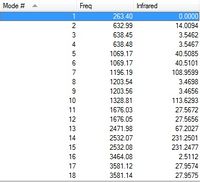
Low frequencies ---   -4.5142   -0.9975   -0.0004    0.0007    0.0012    2.6160
 Low frequencies ---  263.3999  632.9878  638.4503
Association energy of Ammonia Borane
- E(BH3) = -26.46226429 a.u.
- E(NH3) = -56.55776872 a.u.
- E(BH3NH3) = -83.22468908 a.u.
- ΔE = -0.20465607 a.u. = -537.32 kJ Mol-1 (unit conversion factor = 2625.50)
In theory, the bond dissociation energy must therefore be 537.32 kJ Mol-1.
All atomic unit values have a relative error of 0.003809 a.u. (approximately 10 kJ Mol-1)
Part 4: Lewis Acids and Bases
Optimisation of dimers required the following basis sets:
- Al uses a 6-31G(d,p) basis set.
- Cl uses a 6-31G(d,p) basis set.
- Br uses a pseudo-potential (heavy atom).
| Isomer 1 | Isomer 2 |
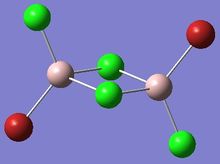 Isomer 1: C2h |
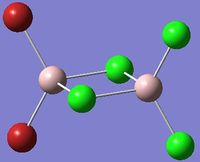 Isomer 2: C2v |
| Isomer 3 | Isomer 4 |
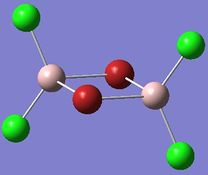 Isomer 3: D2h |
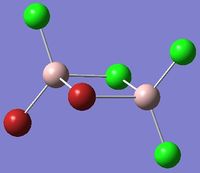 Isomer 4: C1 |
Determining Lowest Energy Conformer
Isomer 1
Link to Isomer 1 optimisation on DSpace
- File Name = TFI_DIMER_ISOMER1_GEN_OUTPUT
- File Type = .log
- Calculation Type = FOPT
- Calculation Method = RB3LYP
- Basis Set = Gen
- Charge = 0
- Spin = Singlet
- E(RB3LYP) = -2352.41629858 a.u.
- RMS Gradient Norm = 0.00000986 a.u.
- Imaginary Freq = N/A
- Dipole Moment = 0.0005 Debye
- Point Group = C1
- Job cpu time: 5 minutes 11.8 seconds.
Item               Value     Threshold  Converged?
 Maximum Force            0.000023     0.000450     YES
 RMS     Force            0.000009     0.000300     YES
 Maximum Displacement     0.000496     0.001800     YES
 RMS     Displacement     0.000158     0.001200     YES
 Predicted change in Energy=-1.174651D-08
 Optimization completed.
    -- Stationary point found.
Isomer 2
Link to Isomer 2 optimisation on DSpace
- File Name = TFI_DIMER_ISOMER2_GEN_OUTPUT
- File Type = .log
- Calculation Type = FOPT
- Calculation Method = RB3LYP
- Basis Set = Gen
- Charge = 0
- Spin = Singlet
- E(RB3LYP) = -2352.41632878 a.u.
- RMS Gradient Norm = 0.00002472 a.u.
- Imaginary Freq = N/A
- Dipole Moment = 0.1948 Debye
- Point Group = C1
- Job cpu time: 5 minutes 7.8 seconds.
Item               Value     Threshold  Converged?
 Maximum Force            0.000046     0.000450     YES
 RMS     Force            0.000023     0.000300     YES
 Maximum Displacement     0.001685     0.001800     YES
 RMS     Displacement     0.000558     0.001200     YES
 Predicted change in Energy=-9.849344D-08
 Optimization completed.
    -- Stationary point found.
Isomer 3
Link to Isomer 3 optimisation on DSpace
- File Name = TFI_DIMER_ISOMER3_GEN_OUTPUT
- File Type = .log
- Calculation Type = FOPT
- Calculation Method = RB3LYP
- Basis Set = Gen
- Charge = 0
- Spin = Singlet
- E(RB3LYP) = -2352.40630795 a.u.
- RMS Gradient Norm = 0.00001325 a.u.
- Imaginary Freq = N/A
- Dipole Moment = 0.0018 Debye
- Point Group = C1
- Job cpu time: 4 minutes 49.8 seconds.
Item               Value     Threshold  Converged?
 Maximum Force            0.000023     0.000450     YES
 RMS     Force            0.000009     0.000300     YES
 Maximum Displacement     0.000705     0.001800     YES
 RMS     Displacement     0.000262     0.001200     YES
 Predicted change in Energy=-1.586974D-08
 Optimization completed.
    -- Stationary point found.
Isomer 4
Link to Isomer 4 optimisation on DSpace
- File Name = TFI_DIMER_ISOMER4_GEN_OUTPUT
- File Type = .log
- Calculation Type = FOPT
- Calculation Method = RB3LYP
- Basis Set = Gen
- Charge = 0
- Spin = Singlet
- E(RB3LYP) = -2352.41109928 a.u.
- RMS Gradient Norm = 0.00003342 a.u.
- Imaginary Freq = N/A
- Dipole Moment = 0.1390 Debye
- Point Group = C1
- Job cpu time: 4 minutes 50.4 seconds.
Item               Value     Threshold  Converged?
 Maximum Force            0.000050     0.000450     YES
 RMS     Force            0.000025     0.000300     YES
 Maximum Displacement     0.001402     0.001800     YES
 RMS     Displacement     0.000560     0.001200     YES
 Predicted change in Energy=-1.233170D-07
 Optimization completed.
    -- Stationary point found.
Analysis
- E(Isomer 1) = -2352.416299 a.u.
- E(Isomer 2) = -2352.416329 a.u.
- E(Isomer 3) = -2352.406308 a.u.
- E(Isomer 4) = -2352.411099 a.u.
Lowest energy isomer = Isomer 2
Energy relative to Isomer 2:
- E(Isomer 1) = 0.0000302 a.u.
- E(Isomer 2) = 0 a.u.
- E(Isomer 3) = 0.0100208 a.u.
- E(Isomer 4) = 0.0052295 a.u.
Relative error in energy = 0.003809 a.u.
Optimisations show that bridging Bromide ligands are less stable than Chloride ligands. The two most stable structures (Isomers 1 and 2) both have two bridging Chloride ligands. Chlorine is the more electron dense of the two elements and will form stronger bonds with Aluminium. Bromine will have a higher energy HOMO, less willing to donate into an Al acceptor orbital than a lower energy Cl HOMO.
Dissociation energy for the lowest energy conformer:
Optimisation of AlCl2Br using a 6-31G(d,p) basis set for Al and Cl and LanL2DZ for Br:
Link to Monomer optimisation on DSpace
- File Name = TFI_MONOMER_GEN_OUTPUT
- File Type = .log
- Calculation Type = FOPT
- Calculation Method = RB3LYP
- Basis Set = Gen
- Charge = 0
- Spin = Singlet
- E(RB3LYP) = -1176.19013679 a.u.
- RMS Gradient Norm = 0.00004196 a.u.
- Imaginary Freq = N/A
- Dipole Moment = 0.1075 Debye
- Point Group = C2V
- Job cpu time: 39.9 seconds.
Item               Value     Threshold  Converged?
 Maximum Force            0.000136     0.000450     YES
 RMS     Force            0.000073     0.000300     YES
 Maximum Displacement     0.000681     0.001800     YES
 RMS     Displacement     0.000497     0.001200     YES
 Predicted change in Energy=-7.984435D-08
 Optimization completed.
    -- Stationary point found.
- E(Isomer 2) = -2352.416329 a.u.
- E(Monomer) = -1176.190137 a.u.
ΔE = (Isomer 2) - 2(Monomer) = -0.0360552 a.u.
Bond dissociation energy is therefore 0.0360552 a.u. = 94.66 kJ Mol-1
The dimer is more stable in this situation, 94.66 kJ Mol-1 would be required as an energy input to separate the dimer.
Frequency Analysis
Isomer 1
Link to Isomer 1 Frequency analysis on DSpace
Low frequencies ---   -5.2881   -0.0031    0.0011    0.0015    1.3788    1.9441
 Low frequencies ---   18.1286   49.0980   73.0126
Isomer 2
Link to Isomer 2 Frequency analysis on DSpace
Low frequencies ---   -4.3501   -2.4045   -1.2301   -0.0010    0.0013    0.0030
 Low frequencies ---   17.6902   50.8742   72.1841
Isomer 3
Link to Isomer 3 Frequency analysis on DSpace
Low frequencies ---   -5.1999   -5.0990   -3.2531   -0.0032   -0.0028   -0.0023
 Low frequencies ---   14.8142   63.2719   86.0762
Isomer 4
Link to Isomer 4 Frequency analysis on DSpace
Low frequencies ---   -2.7908   -0.0028   -0.0020   -0.0016    0.5433    3.0898
 Low frequencies ---   17.0958   55.9071   80.0454
Discussion
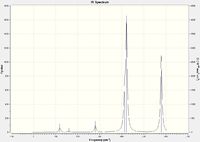
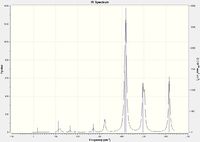
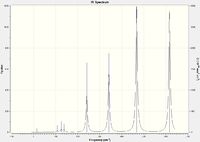
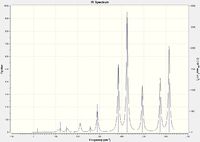
Isomers 2 and 4 have a significantly greater number of peaks in their IR spectra than 1 and 3. Whilst all isomers have the same number of calculated modes, isomers 1 and 3 have significantly more modes with an intensity value of 0 (zero). There are several considerations to take note of, including symmetry, reduced mass and vibrational energy. Isomer 1 has a high degree of symmetry, accounting for the reduced number of peaks. Isomer 2 displayed intensities for many of the modes that were non-active in isomer 1. This may be due to the lower energy requirements to cause the vibration (the higher the intensity, the lower the energy required to excite the mode). Observing the positions of the Br atoms in isomers 1 and 3, it can be seen that the reduced mass of several bonds is larger than the corresponding geometrical bond in isomers 2 and 4. A greater reduced mass means a higher energy would be required to excite the vibrational mode of the corresponding bond. It is therefore evident that a greater number of modes for isomers 1 and 3 would not be excited as compared to 2 and 4.
 |
 |
 |
 |
Population Analysis for Isomer 2
Link to Isomer 2 population analysis on DSpace
| MO 54 | 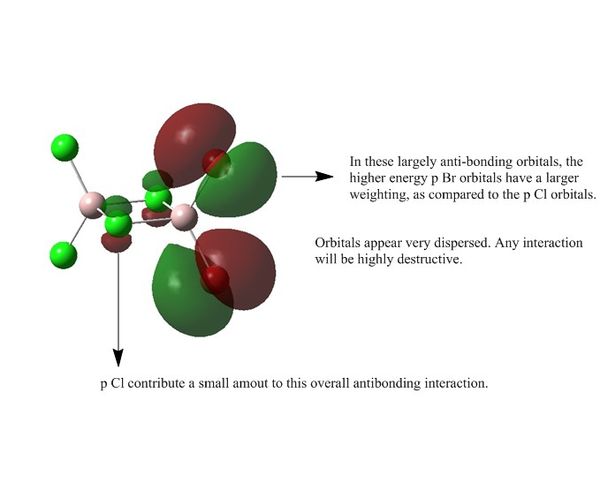
|
| MO 50 | 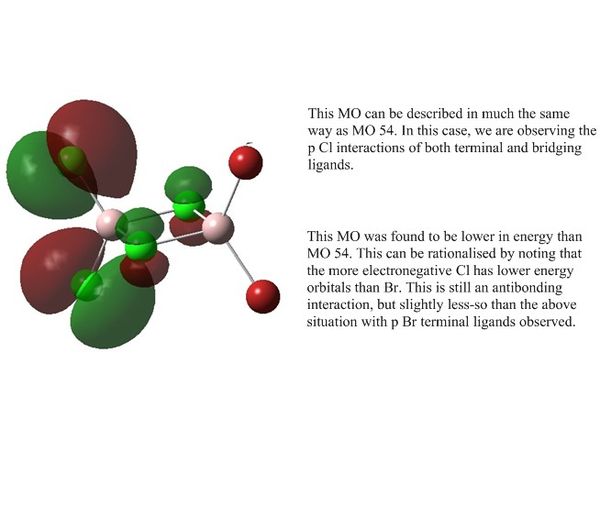
|
| MO 41 | 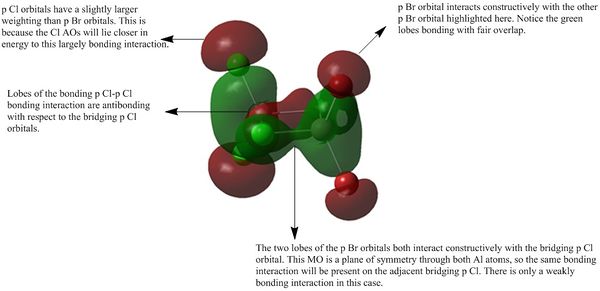
|
| MO 40 | 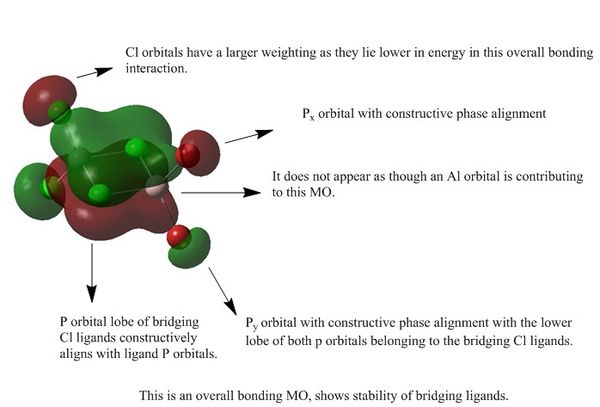
|
| MO 38 | 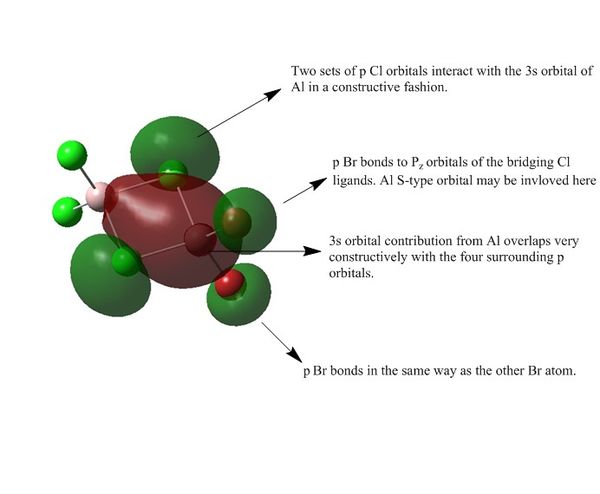
|
References
- ↑ Cooper, C. B., III; Shriver, D. F.; Onaka, S., "Vibrational spectroscopy of hydride-bridged transition metal compounds", Adv. Chem. Ser. 1978, 167, 232.
- ↑ Charles T. Lynch, Handbook of Materials Science, 1974, (3), pg. 91-102.
- ↑ Huheey, pps. A-21 to A-34; T.L. Cottrell, "The Strengths of Chemical Bonds," 2nd ed., Butterworths, London, 1958; B. deB. Darwent, "National Standard Reference Data Series," National Bureau of Standards, No. 31, Washington, DC, 1970; S.W. Benson, J. Chem. Educ., 42, 502 (1965).

