Rep:Mod:ICLRWL4015
EX3 Section
BH3
Optimisation and Frequency Analysis of BH3
A BH3 molecule was optimised using the following method and basis set:
| Calculation Type | FOPT |
|---|---|
| Calculation Method | B3LYP |
| Basis Set | 6-31G(d,p) |
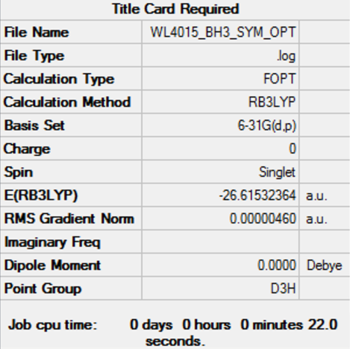
The summary table for the optimised BH3 molecule appeared as follows:
The convergence of all the forces and placements as indicated by the item table below and an RMS gradient smaller than 0.001 AU suggests that optimisation has been successful.
   Item               Value     Threshold  Converged?
 Maximum Force            0.000009     0.000450     YES
 RMS     Force            0.000006     0.000300     YES
 Maximum Displacement     0.000036     0.001800     YES
 RMS     Displacement     0.000024     0.001200     YES
Frequency analysis of the optimised BH3 molecule shows the zero frequencies to be within ± 15 cm-1 and much smaller than the smallest vibration frequency. A minimum structure has therefore been obtained.
 Low frequencies ---   -6.3531   -1.3519   -0.0055    0.7786    8.0942    8.2063
 Low frequencies --- 1162.9733 1213.1671 1213.1698
A rotatable jmol image of the optimised BH3 structure is shown below:
Optimised BH3 molecule |
Vibrational Analysis of BH3
Information about the vibrations of the optimised BH3 are listed in the following table:
| Wavenumber / cm-1 | Intensity (arbitrary units) | Symmetry | IR active? | Vibrational Mode |
|---|---|---|---|---|
| 1163 | 93 | A2" | Yes | Out of plane bending (wagging) |
| 1214 | 14 | E' | Very slight | In plane bending (scissoring) |
| 1214 | 14 | E' | Very slight | In plane bending (rocking) |
| 2582 | 0 | A1' | No | Symmetric stretch |
| 2716 | 126 | E' | Yes | Asymmetric stretch |
| 2716 | 126 | E' | Yes | Asymmetric stretch |
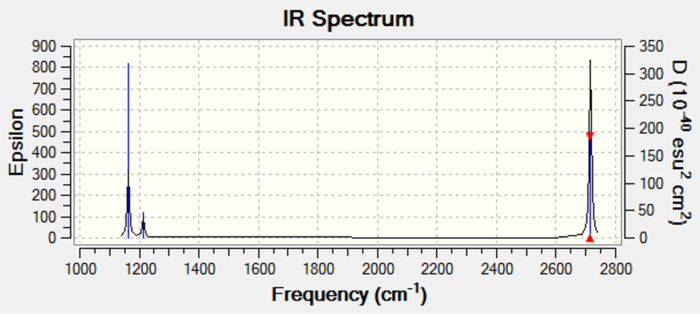
The IR spectrum for the optimised BH3 structure is displayed below:
Only three peaks are visible on the IR spectrum for the optimised BH3 molecule and not the expected 6 as determined by the 3N-6 rule for non-linear molecules.[1] This is due to the symmetric stretch of A1' symmetry being IR inactive and two pairs of vibrational modes (scissoring and rocking, and the two asymmetric stretches) being degenerate. As a result, their absorptions occur at the same wavenumber and so superimposition occurs such that only one peak is observed.[1]
MO diagram for BH3
The MO diagram for BH3 is shown below, with the MOs generated from the optimised structure shown beside their corresponding LCAO.
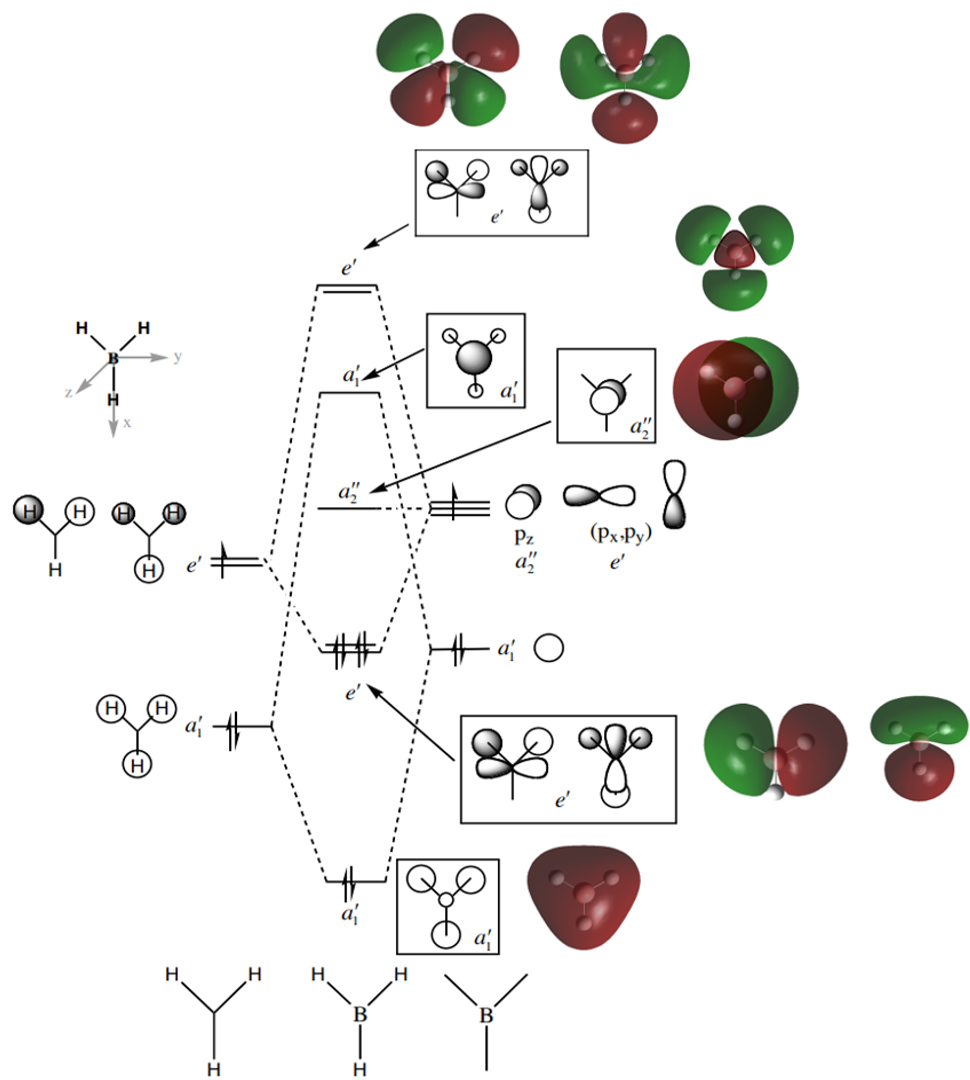
The LCAOs closely resemble the 'real' MOs, with the correct symmetry and geometry consistently reflected by qualitative MO theory. One exception is the LCAO for the antibonding orbital of a1' symmetry. The LCAO shows a much larger antibonding contribution than indicated by the 'real' MO, as the electron density centred around the central boron atom is much less diffuse than it appears in the 'real' MO. However, since the LCAOs and the corresponding 'real' MOs are in agreement for the other orbitals, qualitative MO theory is extremely useful in predicting the shapes of molecular orbitals.
Smf115 (talk) 22:40, 15 May 2018 (BST)Excellent answer with a thorough comparison of the LCAOs compared to the real MOs.
NH3
Optimisation and Frequency Analysis of NH3
The method and basis set used for the calculations were as follows:
| Calculation Type | FOPT |
|---|---|
| Calculation Method | B3LYP |
| Basis Set | 6-31G(d,p) |
An RMS gradient smaller than 0.001 AU, the convergence of forces and placements, and small zero frequencies relative to the vibrational frequencies is indicative of a successful optimisation.
     Item               Value     Threshold  Converged?
 Maximum Force            0.000006     0.000450     YES
 RMS     Force            0.000004     0.000300     YES
 Maximum Displacement     0.000012     0.001800     YES
 RMS     Displacement     0.000008     0.001200     YES
 Low frequencies ---   -8.5646   -8.5588   -0.0041    0.0455    0.1784   26.4183
 Low frequencies --- 1089.7603 1694.1865 1694.1865
Optimised NH3 molecule |
NH3BH3
Optimisation and Frequency Analysis of NH3BH3
The method and basis set used for the optimisation were as follows:
| Calculation Type | FOPT |
|---|---|
| Calculation Method | B3LYP |
| Basis Set | 6-31G(d,p) |
Again, an RMS gradient smaller than 0.001 AU, the convergence of forces and placements, and small zero frequencies relative to the vibrational frequencies indicate successful optimisation.
     Item               Value     Threshold  Converged?
 Maximum Force            0.000123     0.000450     YES
 RMS     Force            0.000058     0.000300     YES
 Maximum Displacement     0.000536     0.001800     YES
 RMS     Displacement     0.000297     0.001200     YES
  Low frequencies ---   -0.0018   -0.0016   -0.0009    3.1997   18.4930   40.6763
  Low frequencies ---  266.2826  632.1461  638.5238
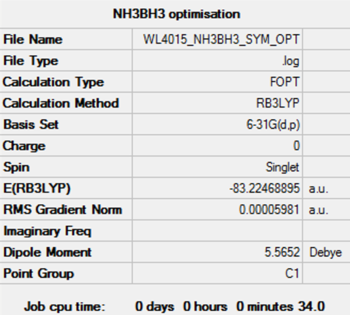
A rotatable jmol image of the optimised molecule is shown:
Optimised NH3BH3 molecule |
Determining the Dissociation Energy of the B-N Bond in NH3BH3
The energies of the molecular fragments are given in the following table:
| Energy, E(RB3LYP) (au) | |
|---|---|
| E(BH3) | -26.61532 |
| E(NH3) | -56.55777 |
| E(NH3BH3) | -83.22469 |
These energies can then be used to calculate the dissociation energy of the B-N bond in ammonia-borane using the equation: ΔE(RB3LYP) = E(NH3BH3) - [E(NH3) + E(BH3)].[3]
| AU | kJ mol-1 | |
|---|---|---|
| Association Energy, ΔE(RB3LYP) | -0.05160 | -135 |
| Dissociation Energy, ΔE(RB3LYP) | +0.0516 | +135 |
Note that the association energy is the calculated value using the above equation, as NH3 + BH3 → NH3BH3. The dissociation energy for the B-N bond is therefore the positive value of the same magnitude, i.e. ΔE(RB3LYP) for the reverse process: +135 kJ mol-1. Comparison with the bond dissociation enthalpy of the isoelectronic C-C bond in ethane as reported in literature, + 349.36 kJ mol-1 (+ 83.5 kcal), suggests that the dative B-N bond is weak, likely due to the electronegatvity of the N atom making it a poor electron donor.[4]
BBr3
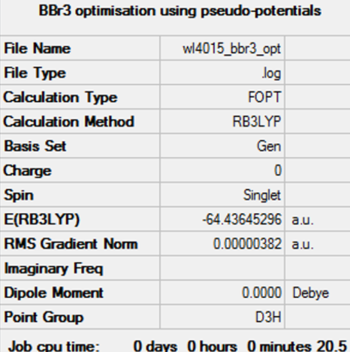
The method, basis set and pseudo-potential used for the optimisation were as follows:
| Calculation Type | FOPT |
|---|---|
| Calculation Method | B3LYP |
| Basis Set | 6-31G(d,p) |
| Pseudo-potential | LANL2DZ |
Successful optimisation is evidenced by an RMS gradient smaller than 0.001 AU, the convergence of forces and placements, and very small zero frequencies relative to the vibraitonal frequencies, within ± 15 cm-1.
     Item               Value     Threshold  Converged?
 Maximum Force            0.000008     0.000450     YES
 RMS     Force            0.000005     0.000300     YES
 Maximum Displacement     0.000036     0.001800     YES
 RMS     Displacement     0.000023     0.001200     YES
 Low frequencies ---   -0.0137   -0.0064   -0.0046    2.4315    2.4315    4.8421
 Low frequencies ---  155.9631  155.9651  267.7052
The frequency file of the successful analysis was published on Dspace: DOI:10042/202299
A rotatable jmol image for the optimised molecule is shown below:
Optimised BBR3 molecule |
Project Section: Investigating the Gauche Effect
What is the Gauche Effect?
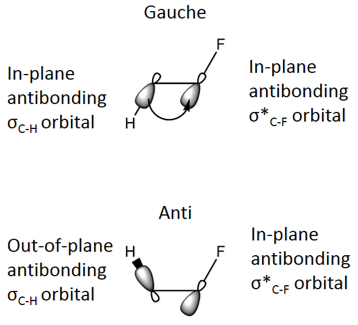
Free rotation about the C-C bond allows alkanes to adopt a variety of conformers. For 1,2-disubstituted haloalkanes, a dihedral angle of 180°, and hence an anti conformer, is favourable to ensure maximum separation of the larger, electron rich Cl atoms and minimise electronic repulsions.[5] However, it has been observed that 1,2-difluoroethane counterintuitively favours a gauche conformation instead.[5] Hyperconjugation can be used to explain this effect, with the donation of electron density from a filled, electron-rich donor bonding orbital, σC-H, into a vacant, electron deficient, acceptor orbital, σ*C-F. Maximisation of this stabilising interaction occurs when the donor and acceptor orbitals are in the same plane (anti) and thus a dihedral angle between the two vicinal heteroatoms of 60° to give the gauche conformation.[6]
Project Aims
This project aimed provide an explanation for the gauche effect using MO computational methods and examine the effectiveness of MO theory in comparison to hybridisation. This was achieved by analysis of the energies and dihedral angles (torsion angles) of the anti and gauche conformers of the compounds 1,2-difluoroethane, CFH2CFH2, and 1,2-dichloroethane, CClH2CClH2. The two conformers were constructed using ethyl fragments and substituting a hydrogen atom on each carbon atom such that the molecule roughly resembled the desired conformer. Optimisation was carried out to determine the geometry at the local (or in some cases, global) minima and a frequency analysis was run to confirm the process had been successful. The MOs for CFH2CFH2 were visualised and a selection of these 'real' MOs compared to their corresponding LCAOs to determine their bonding/antibonding interactions and overall character.
Phunt (talk) 05:26, 17 May 2018 (BST) good work to add an introduction and aims, the second part of the aims should really come under the heading "methodology" or "computational details" or be included in the following section, as it is about the details of carrying out the calculations
CFH2CFH2
Optimisation and frequency analysis of the anti conformer
Phunt (talk) 05:29, 17 May 2018 (BST)this section contains all the information required, well formatted and clearly presented, well done.
The method, basis set and pseudo-potential used for the optimisation were as follows:
| Calculation Type | FOPT |
|---|---|
| Calculation Method | B3LYP |
| Basis Set | 6-31G(d,p) |
The optimisation was determined to be successful due to an RMS gradient smaller than 0.001 AU, the convergence of forces and placements, and very small zero frequencies relative to the vibration frequencies.
      Item               Value     Threshold  Converged?
 Maximum Force            0.000134     0.000450     YES
 RMS     Force            0.000032     0.000300     YES
 Maximum Displacement     0.000279     0.001800     YES
 RMS     Displacement     0.000124     0.001200     YES
 Low frequencies ---  -12.1625    0.0016    0.0016    0.0020    6.6685   32.7523
 Low frequencies ---  131.3822  274.4441  459.1603
A rotatable jmol image for the optimised molecule is shown below:
Optimised anti CFH2CFH2 molecule |
Optimisation and frequency analysis of the gauche conformer
The method, basis set and pseudo-potential used for the optimisation were as follows:
| Calculation Type | FOPT |
|---|---|
| Calculation Method | B3LYP |
| Basis Set | 6-31G(d,p) |
Successful optimisation is evidenced by an RMS gradient smaller than 0.001 AU, the convergence of forces and placements, and very small zero frequencies relative to the vibration frequencies, within ± 15 cm-1.
      Item               Value     Threshold  Converged?
 Maximum Force            0.000056     0.000450     YES
 RMS     Force            0.000024     0.000300     YES
 Maximum Displacement     0.000527     0.001800     YES
 RMS     Displacement     0.000220     0.001200     YES
 Low frequencies ---  -14.5277  -13.5964    0.0003    0.0014    0.0016   14.0330
 Low frequencies ---  148.0170  322.2886  493.5291
A rotatable jmol image for the optimised molecule is shown below:
Optimised gauche CFH2CFH2 molecule |
CClH2CClH2
Optimisation and frequency analysis of the anti conformer
The method, basis set and pseudo-potential used for the optimisation were as follows:
| Calculation Type | FOPT |
|---|---|
| Calculation Method | B3LYP |
| Basis Set | 6-31G(d,p) |
The optimisation is successful as the RMS gradient smaller than 0.001 AU, the forces and placements have converged, and the zero frequencies are very small relative to the vibration frequencies, being within ± 15 cm-1.
      Item               Value     Threshold  Converged?
 Maximum Force            0.000258     0.000450     YES
 RMS     Force            0.000055     0.000300     YES
 Maximum Displacement     0.000462     0.001800     YES
 RMS     Displacement     0.000197     0.001200     YES
 Low frequencies ---   -0.0072   -0.0064   -0.0064    5.3981    8.5342   24.6053
 Low frequencies ---  118.4860  214.7343  297.0601
A rotatable jmol image for the optimised molecule is shown below:
Optimised anti CClH2CClH2 molecule |
Optimisation and frequency analysis of the gauche conformer
The method, basis set and pseudo-potential used for the optimisation were as follows:
| Calculation Type | FOPT |
|---|---|
| Calculation Method | B3LYP |
| Basis Set | 6-31G(d,p) |
Successful optimisation is evidenced by an RMS gradient smaller than 0.001 AU, the convergence of forces and placements, and very small zero frequencies relative to the vibration frequencies, almost within ± 15 cm-1.
     Item               Value     Threshold  Converged?
 Maximum Force            0.000039     0.000450     YES
 RMS     Force            0.000017     0.000300     YES
 Maximum Displacement     0.000504     0.001800     YES
 RMS     Displacement     0.000283     0.001200     YES
 Low frequencies ---   -4.0480   -0.0068   -0.0062   -0.0042    6.1978   17.4667
 Low frequencies ---  113.0682  260.0976  408.7754
A rotatable jmol image for the optimised molecule is shown below:
Optimised gauche CClH2CClH2 molecule |
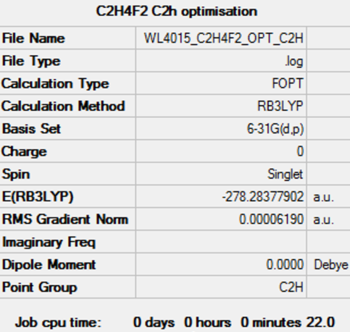
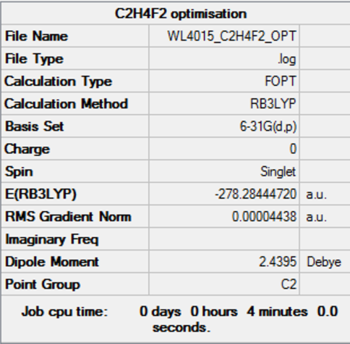
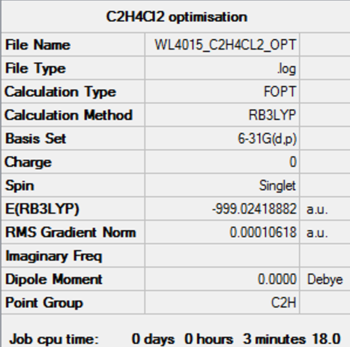
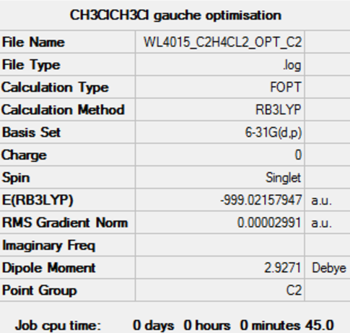
Energies and Torsion Angles
| Compound | Conformer | Point Group | Energy, E(RB3LYP) | Torsion Angle / ° | |
|---|---|---|---|---|---|
| AU | kJ mol-1 | ||||
| CFH2CFH2 | anti | C2h | - 278.28378 | - 730634 | 180.0 |
| gauche | C2 | - 278.28445 | - 730636 | 69.9 | |
| CClH2CClH2 | anti | C2h | - 999.02419 | - 2622938 | 180.0 |
| gauche | C2 | - 999.02159 | - 2622931 | 69.7 | |
It can be seen that the energy for the anti conformation of CClH2CClH2 is 7 kJ mol-1 lower than its gauche conformation, indicating that the anti conformation is marginally more stable in concordance with steric arguments.
However, the opposite is true for CFH2CFH2, where the gauche conformer is more stable by 2 kJ mol-1. It should also be noted that the CFH2CFH2 is also generally much less stable than CClH2CClH2.
Phunt (talk) 05:34, 17 May 2018 (BST)we don't report total energies in kJ/mol, this was noted on the a better basis set and on the accuracy page. You should have reported the energy difference of the conformers in kJ/mol. Never compare total energies for different molecules. The question you should ask yourself is "Are these differences in energy significant?" the answer is no, for CFH2CFH2 and just barely for CClH2CClH2 since the energy difference is very close to the limit of 5kJ/mol! However the method we are using is quite low level, a more accurate basis set and dft or method like MP2 might give a different story with energies just large enough to be significant.
MO Energies
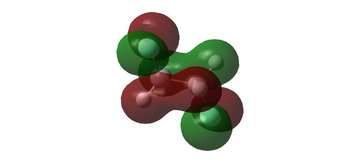
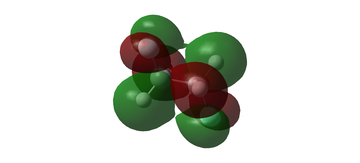
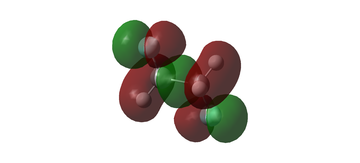
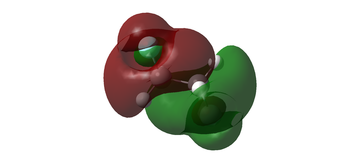
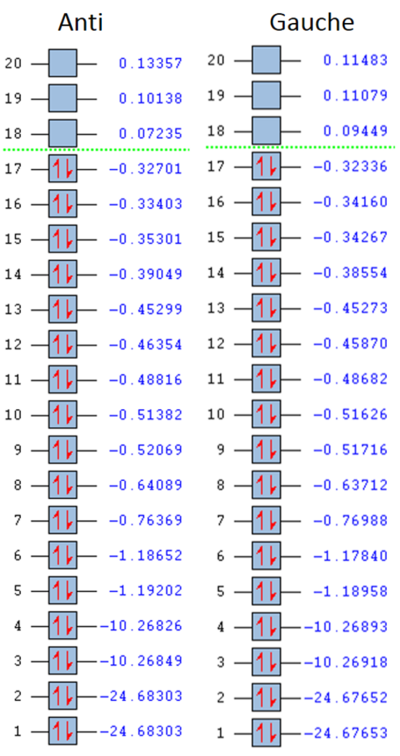
The molecular orbital energies of anti CH2FCH2F are shown below:
Visualising the MOs
Phunt (talk) 05:42, 17 May 2018 (BST) a vertical rather than horizontal table would have been easier to read. Also aligning the MOs so that at least one of the heavy atoms in each structure are in the same "place" would have helped in understanding the orbital comparison. A good range of orbitals selected and a nice attempt at discussion. For MO 15 the suggested stronger antibonding interaction is not really evident. Good to identify through space interactions between the different ends of the molecule, well done. A nice description of MOs 17 & 18.
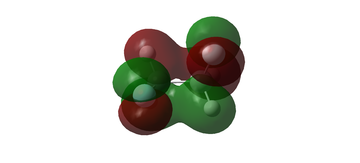
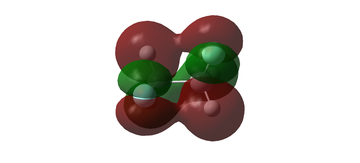
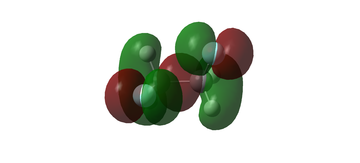
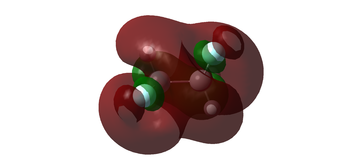
The shapes of CH2FCH2F molecular orbitals of interest for the anti conformer and for the gauche conformer are illustrated below:
LCAO Diagrams
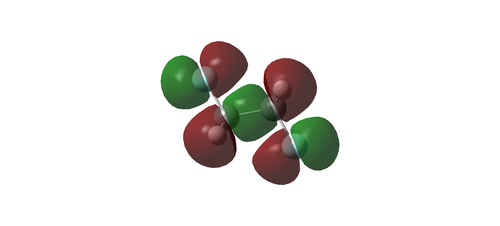
Phunt (talk) 05:52, 17 May 2018 (BST) Very good to include some direct analysis of a MO, the analysis looks good. Don't forget to identify if an interaction is polarised. In visualising the MOs you can change the density isosurface choose a less dense contour and you may actually see the weaker through space interactions occurring, you could try 0.001.
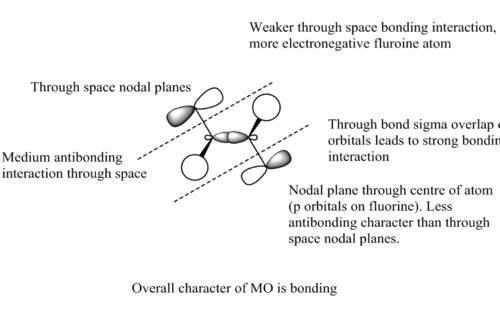
Analysis of the bonding and antibonding interactions was carried out for the LCAOs relevant to the HOMO (MO 17) for the anti conformer of CH2FCH2F to assess its overall character.
Real MO:
LCAO analysis:
Conclusions
Computational methods are largely successful in determining the most stable conformer of a molecule. While hyperconjugation does provide reasoning for the gauche effect, analysis of the 'real' MOs suggest that an MO deeper in energy than the HOMO and LUMO with secondary orbital interactions may be the actual driving force for the gauche effect.
Phunt (talk) 05:55, 17 May 2018 (BST) your analysis did not show a clear distinction as you anticipated and you were honest enough with yourself to state that clearly, you are exhibiting the characteristics that make a good researcher, well done! Overall an excellent report, a couple of conceptual points raised that I hope a much clearer for you now.
References
<references> [1] [2] [3] [4] [5] [6]
- ↑ 1.0 1.1 1.2 C. E. Housecroft and A. G. Sharpe, Inorganic Chemistry, Pearson, Harlow, 4th edn., 2012.
- ↑ 2.0 2.1 Hunt Research group, http://www.huntresearchgroup.org.uk/teaching/teaching_comp_lab_year2a/Tut_MO_diagram_BH3.pdf, (accessed May 2018).
- ↑ 3.0 3.1 Hunt Research group, http://www.huntresearchgroup.org.uk/teaching/teaching_comp_lab_year2a/9a_bh3nh3_energy.html, (accessed May 2018).
- ↑ 4.0 4.1 G. Glockler, Discuss. Faraday Soc., 1951, 10, 26-35.
- ↑ 5.0 5.1 5.2 D. O'Hagan, Chem. Soc. Rev., 2008, 37, 308-319.
- ↑ 6.0 6.1 L. Goodman, H. Gu and V. Pophristic, J. Phys. Chem. A, 2005, 109, 1223-1229.

