Rep:Mod:HS4018
NH3 Molecule
| Molecule | NH3 |
|---|---|
| Calculation Method | RB3LYP |
| Basis Set | 6-31G(d.p) |
| Final E(RB3LYP) Energy (AU) | -56.55777 |
| RMS Gradient Norm (AU) | 4.85 x 10⁻⁶ |
| Point Group | C3v |
The table above represents the optimisation settings and values extracted from optimisation for the NH3 molecule.
NH3 Molecule Data
NH3 Bond Length: 1.02Å
NH3 Bond Angle: 106°
NH3 Forces and Displacements
Item                      Value     Threshold  Converged?
Maximum Force            0.000004     0.000450     YES
RMS     Force            0.000004     0.000300     YES
Maximum Displacement     0.000072     0.001800     YES
RMS     Displacement     0.000035     0.001200     YES
Predicted change in Energy=-5.986263D-10
Optimization completed.
 -- Stationary point found.
The table above displays values for Maximum and RMS Forces and displacements for NH3. There is also a threshold column in which the values are compared to the threshold and if the value extracted is lower then the threshold value then the molecule is optimised; the converged column displays a yes.
NH3 Interactive Image
NH JMol |
NH3 Vibration Analysis
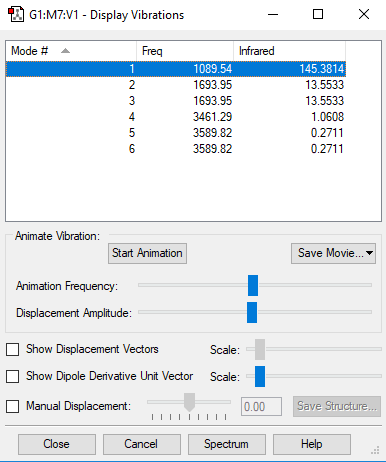
The image above displays the different vibrational modes of an NH3 molecule.
| Vibration | 1 | 2 | 3 | 4 | 5 | 6 |
|---|---|---|---|---|---|---|
| Wavenumber (cm-1) | 1090 | 1694 | 1694 | 3461 | 3590 | 3590 |
| Infrared Intensity (AU) | 145 | 14 | 14 | 1 | 0 | 0 |
| Symmetry | A1 | E | E | A1 | E | E |
| Snapshot | 
|

|

|

|

|

|
The table above shows the frequency, infrared intensity, symmetry and a snapshot associated with each vibration of NH3 where each value is to the nearest integer.
- Using the 3N-6 rule you would expect 6 vibration modes to be present in a molecule of NH3. This is because there are 4 atoms in NH3 so N = 4 therefore 3N-6 = 6. There are two sets of two degenerate vibrations, one of these sets are the 1694cm-1 stretches and the other set are the 3590cm-1 stretches.
- The vibrations at frequencies 1090cm-1 and 1694cm-1 are the bending stretches and the vibrations are frequencies 3461cm-1 and 3590cm-1 are bond stretches.
- The vibration at frequency 3461cm-1 is the most symmetric stretch of them all.
- The vibration at frequency 1090cm-1 (furthest left in the above table) is known as the 'umbrella' vibration.
- You would expect to see 2 bands in the spectrum of gaseous Ammonia. These bands would be at frequencies 1090cm-1 and at 1694cm-1 .
NH3 Charge Analysis
The charge on the Nitrogen atom is -1.125 and each of the Hydrogen +0.375. This is similar to what you would expect as relatively you expect the Nitrogen to be more negatively charged as it has a higher electronegativity than the 3 Hydrogen's. So the Nitrogen atom pulls electron density towards itself and hence becomes more negatively charged.
N2 Molecule
| Molecule | N2 |
|---|---|
| Calculation Method | RB3LYP |
| Basis Set | 6-31G(d.p) |
| Final E(RB3LYP) Energy (AU) | -109.52412 |
| RMS Gradient Norm (AU) | 0.00220 |
| Point Group | D*H |
The table above represents the optimisation settings and values extracted from optimisation for the N2 molecule.
N2 Molecule Data
N2 Bond Length: 1.12Å
N2 Forces and Displacements
 Item                      Value     Threshold  Converged?
 Maximum Force            0.000001     0.000450     YES
 RMS     Force            0.000001     0.000300     YES
 Maximum Displacement     0.000000     0.001800     YES
 RMS     Displacement     0.000000     0.001200     YES
 Predicted change in Energy=-3.401031D-13
 Optimization completed.
    -- Stationary point found.
The table above displays values for Maximum and RMS Forces and displacements for N2. There is also a threshold column in which the values are compared to the threshold and if the value extracted is lower then the threshold value then the molecule is optimised; the converged column displays a yes.
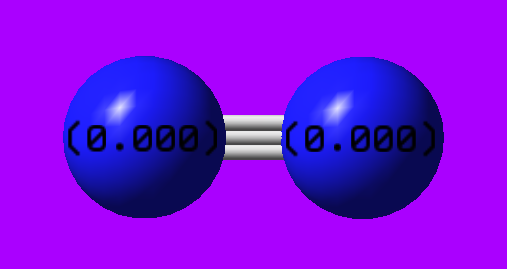
N2 Interactive Image
N JMol |
N2 Vibration Analysis
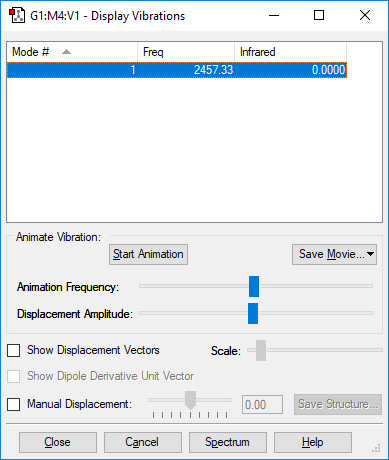
The image above displays the different vibrational modes of an N2 molecule.
| Vibration | 1 |
|---|---|
| Wavenumber (cm-1) | 2457 |
| Intensity (au) | 0 |
| Snapshot | 
|
The table above shows the frequency, infrared intensity, symmetry and a snapshot associated with each vibration of NH3 where each value is to the nearest integer.
- Using the 3N-5 rule you would expect 1 vibration mode to be present in a molecule of N2. As N = 2 due to 2 atoms in the molecule and hence 3N-5 = 1.
- The only vibration at frequency 2457 cm-1 represents a bond stretching frequency.
N2 Charge Analysis
The charge on both Nitrogen atoms is 0. This is expected as the electronegativity of each atom is equal so they both have an equal and opposite pull on the electron density which means no overall charge.
H2 Molecule
| Molecule | H2 |
|---|---|
| Calculation Method | RB3LYP |
| Basis Set | 6-31G(d.p) |
| Final E(RB3LYP) Energy (AU) | -1.17854 |
| RMS Gradient Norm (AU) | 1.1 x 10⁻⁷ |
| Point Group | D*H |
The table above represents the optimisation settings and values extracted from optimisation for the H2 molecule.
H2 Molecule Data
H2 Bond Length: 0.74Å
H2 Forces and Displacements
 Item                      Value     Threshold  Converged?
 Maximum Force            0.000000     0.000450     YES
 RMS     Force            0.000000     0.000300     YES
 Maximum Displacement     0.000000     0.001800     YES
 RMS     Displacement     0.000001     0.001200     YES
 Predicted change in Energy=-1.164080D-13
 Optimization completed.
    -- Stationary point found.
The table above displays values for Maximum and RMS Forces and displacements for H2. There is also a threshold column in which the values are compared to the threshold and if the value extracted is lower then the threshold value then the molecule is optimised; the converged column displays a yes.
H2 Interactive Image
H JMol |
H2 Vibrational Analysis
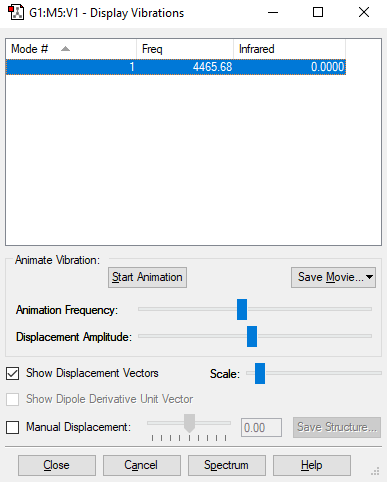
The image above displays the different vibrational modes of an H2 molecule.
| Vibration | 1 |
|---|---|
| Wavenumber (cm-1) | 4466 |
| Intensity (AU) | 0 |
| Snapshot | 
|
The table above shows the frequency, infrared intensity, symmetry and a snapshot associated with each vibration of H2 where each value is to the nearest integer.
- Using the 3N-5 rule you would expect 1 vibration mode to be present in a molecule of H2. As N = 2 due to 2 atoms in the molecule and hence 3N-5 = 1.
- The only vibration at frequency 4466cm-1 represents a bond stretching frequency.
H2 Charge Analysis
The charge on both Hydrogen atoms is 0. This is expected as the electronegativity of each atom is equal so they both have an equal and opposite pull on the electron density which means no overall charge.
H2 Transition Metal Complex
Unique identifier code: BIDQUB
Link to Transition Metal Complex:[[1]]
H2 Bond length in Complex= 0.912Å [1]
H2 Bond Length in Diatomic: 0.74Å
Why is there a difference in bond lengths?
There is a difference in bond lengths as in diatomic Hydrogen the electron density of both atoms is shared between only the Hydrogen atoms. When a Ruthenium atom bonds with the Hydrogen it pulls the electron density towards itself and thus reduces the bond density. This effect is even larger since the Ruthenium atom bonds to both Hydrogen atoms.
Why is there a difference between experimental and computational distances.
There is a difference as a RB3LYP calculation method was used and this only uses a few parameters so a calculation method with more parameters that can be changed and set would provide distances to a higher degree of accuracy. On the other hand if the best equipment known is not used then it produces less accurate distances.
Haber Bosch Process
| Energy (au) | |
|---|---|
| E(NH3) | -56.55777 |
| 2*E(NH3) | -113.11554 |
| E(N2) | -109.52412 |
| E(H2) | -1.17854 |
| 3*E(H2) | -3.53562 |
| ΔE=2*E(NH3)-[E(N2)+3*E(2)] | -0.05579 |
ΔE = -146.5kJmol-1.
The above table displays values computed through optimisation in Gaussian software. The values are used to predict the energy of the Haber-Bosch process. The ammonia product is more stable as it is lower in energy compared to the gaseous reactants.
Carbon Monoxide
| Molecule | Carbon Monoxide |
|---|---|
| Calculation Type | RB3LYP |
| Basis Set | -6-31G(d.p) |
| Final E(RB3LYP) Energy (au) | -113.30945 |
| RMS Gradient Norm | 2.02 x 10⁻⁶ |
| Point Group | C*V |
The table above represents the optimisation settings and values extracted from optimisation for the CO molecule.
CO Molecule Data
CO Bond Length: 1.14Å
CO Forces and Displacements
Item               Value     Threshold  Converged?
 Maximum Force            0.000004     0.000450     YES
 RMS     Force            0.000004     0.000300     YES
 Maximum Displacement     0.000001     0.001800     YES
 RMS     Displacement     0.000002     0.001200     YES
 Predicted change in Energy=-4.844651D-12
 Optimization completed.
    -- Stationary point found.
The table above displays values for Maximum and RMS Forces and displacements for CO. There is also a threshold column in which the values are compared to the threshold and if the value extracted is lower then the threshold value then the molecule is optimised; the converged column displays a yes.
CO Interactive Image
N JMol |
CO Vibration Analysis
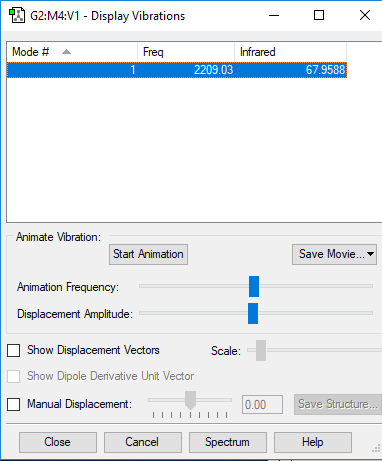
The image above displays the different vibrational modes of a CO molecule.
| Vibration | 1 |
|---|---|
| Wavenumber (cm-1) | 2209 |
| Intensity (AU) | 68 |
| Snapshot | 
|
The table above shows the frequency, infrared intensity, symmetry and a snapshot associated with each vibration of CO where each value is to the nearest integer.
- Using the 3N-5 rule you would expect 1 vibration mode to be present in a molecule of H2. As N = 2 due to 2 atoms in the molecule and hence 3N-5 = 1.
- The only vibration at frequency 2209cm-1 represents a bond stretching frequency.
CO Vibration Analysis
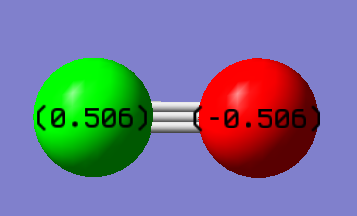
The charge on Oxygen is -0.506 and the charge on Carbon is +0.506 . This is expected as the electronegativity of Oxygen is much greater than Carbon so the has have a much stronger pull on the electron density hence, Oxygen is more negative.
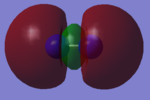
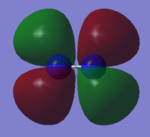
CO Molecular Orbitals
H2S- Independence Mark
| Molecule | H2S |
|---|---|
| Calculation Method | RB3LYP |
| Basis Set | 6-31G(d.p) |
| Final E(RB3LYP) Energy (au) | --399.39162 |
| RMS Gradient Norm (au) | 1.2068 x 10⁻⁴ |
| Point Group | C2V |
The table above represents the optimisation settings and values extracted from optimisation for the H2S molecule.
H2S Molecule Data
H2S Bond Length: 1.35Å
H2S Bond Angle: 93°
H2S Forces and Displacements
 Item                      Value     Threshold  Converged?
 Maximum Force            0.000175     0.000450     YES
 RMS     Force            0.000145     0.000300     YES
 Maximum Displacement     0.000472     0.001800     YES
 RMS     Displacement     0.000386     0.001200     YES
 Predicted change in Energy=-1.208488D-07
 Optimization completed.
    -- Stationary point found.
The table above displays values for Maximum and RMS Forces and displacements for H2S. There is also a threshold column in which the values are compared to the threshold and if the value extracted is lower then the threshold value then the molecule is optimised; the converged column displays a yes.
H2S Interactive Image
N JMol |
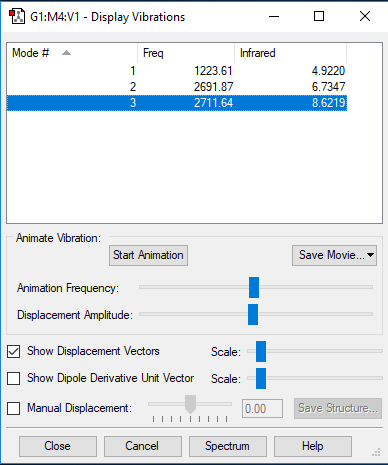
H2S Vibration Analysis
The image above displays the different vibrational modes of an H2S molecule.
| Vibration | 1 | 2 | 3 |
|---|---|---|---|
| Wavenumber (cm-1) | 1224 | 2692 | 2712 |
| Infrared Intensity (au) | 5 | 7 | 9 |
| Symmetry | A1 | A1 | B2 |
| Snapshot | 
|

|

|
The table above shows the frequency, infrared intensity, symmetry and a snapshot associated with each vibration of H2S where each value is to the nearest integer.
- Using the 3N-6 rule you would expect 3 vibration modes to be present in a molecule of H2S. This is because there are 4 atoms in H2S so N = 3 therefore 3N-6 = 3.
- The vibration at frequency 1224cm-1 is a bending stretch and the vibrations at frequencies 2692cm-1 and 2712cm-1 are bond stretches.
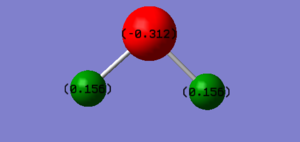
H2S Charge Analysis
The charge on the Sulfur atom is -0.312 and each of the Hydrogen +0.156. This is as expected as the Sulfur is more electronegative than the hydrogen atoms and so pulls the electron density towards itself making Sulfur more negative.
References
- ↑ (1)D.Sellmann, A.Hille, F.W.Heinemann, M.Moll, M.Reiher, B.A.Hess, W.Bauer CCDC 229678: Experimental Crystal Structure Determination, 2005, DOI: 10.5517/cc7pzzv
Marking
Note: All grades and comments are provisional and subject to change until your grades are officially returned via blackboard. Please do not contact anyone about anything to do with the marking of this lab until you have received your grade from blackboard.
Comment: You wiki shows you have a good level of understanding but you analysed the wrong MOs in the section worth most of the marks.
Wiki structure and presentation 0.5/1
Is your wiki page clear and easy to follow, with consistent formatting?
YES
Do you effectively use tables, figures and subheadings to communicate your work?
YES - however, all your mols are just labelled 'mol' which is not informative at all.
NH3 1/1
Have you completed the calculation and given a link to the file?
YES
Have you included summary and item tables in your wiki?
YES
Have you included a 3d jmol file or an image of the finished structure?
YES
Have you included the bond lengths and angles asked for?
YES
Have you included the “display vibrations” table?
YES
Have you added a table to your wiki listing the wavenumber and intensity of each vibration?
YES
Did you do the optional extra of adding images of the vibrations?
YES
Have you included answers to the questions about vibrations and charges in the lab script?
YES
N2 and H2 0.5/0.5
Have you completed the calculations and included all relevant information? (summary, item table, structural information, jmol image, vibrations and charges)
YES
Crystal structure comparison 0.5/0.5
Have you included a link to a structure from the CCDC that includes a coordinated N2 or H2 molecule?
YES
Have you compared your optimised bond distance to the crystal structure bond distance?
YES
Haber-Bosch reaction energy calculation 1/1
Have you correctly calculated the energies asked for? ΔE=2*E(NH3)-[E(N2)+3*E(H2)]
YES
Have you reported your answers to the correct number of decimal places?
YES
Do your energies have the correct +/- sign?
YES
Have you answered the question, Identify which is more stable the gaseous reactants or the ammonia product?
YES
Your choice of small molecule 1/5
Have you completed the calculation and included all relevant information?
YES
Have you added information about MOs and charges on atoms?
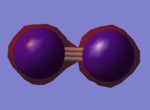
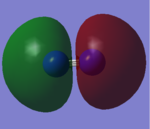
Most of the marks are rewarded for the MO analysis. In this section you claimed to analyse CO but the displayed MOs are the ones of N2!
Independence 1/1
If you have finished everything else and have spare time in the lab you could:
Check one of your results against the literature, or
Do an extra calculation on another small molecule, or
YES
Do some deeper analysis on your results so far

