Rep:Mod:HJK114
Introduction
The value of computational chemistry lies in its ability to enable the calculation of reasonable approximations for fundamental issues such as:
- the geometrical arrangement of nuclei that corresponds to a stable molecule
- the relative energies of these geometries
- how different molecules interact with each other.
The Transition State and the Potential Energy Surface
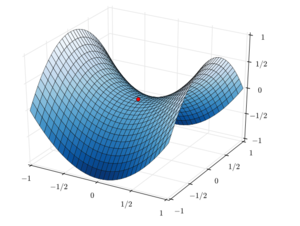
A Potential Energy Surface (PES) encompasses the energies of all the possible arrangements of the atoms within a molecule/interacting molecules in a chemical reaction. A chemical reaction will proceed via the lowest energy route between the reactants and products, themselves in the lowest energy geometries.
The first derivative of the energy with respect to the reaction coordinate (the path taken between reactants and products) is the gradient. The second derivative is known as the force constant,k, and defines the curvature of the PES.

The first derivative of the energy of the reactants, products and transition state will be 0. The second derivative will be positive for the minima of the reactants and products but negative for the transition state maximum.
A transition state (TS) is defined as the point along this lowest energy route that is at a relative energy maximum on the Potential Energy Surface (PES), as illustrated by the dot in the above figure. It is a maximum only on this lowest energy route/'crossing' axis and only this path has a negative curvature, k. In all other directions/along all other axial paths the PES rises up and has a positive curvature.
From the equations of Simple Harmonic Motion (SHM) the frequency is proportional to the square root of k. The square root of a negative value is imaginary, hence transition states are characterised by a single, unique negative frequency. A TS is also known as a saddle point- illustrated by figure 1.
Nf710 (talk) 21:13, 15 December 2016 (UTC) Good section describing TS
Optimisation Methods
In this lab 2 methods were used to refine and optimise the geometries involved in the studied reactions: PM6 and B3LYP. PM6 is a less accurate and consequently faster method than B3LYP because it uses empirical data instead of calculating all of the integrals in the Hessian matrix. It is known as a semi-empirical method because it uses not only experimental data, but also Hartree-Fock (HF), Density Functional Theory (DFT) and molecular mechanics methods.
On the other hand, B3LYP is a fitted hybrid method that combines Density Functional Theory (DFT) and Hartree Fock (HF) methods. In a DFT method the Hamiltonian is a function of charge density and in HF it is a function of r, the position. In exercises 1 and 3 only PM6 was used but in exercise 2 the geometries were initially optimised with PM6 and then B3LYP was used to further optimise them to yield more accurate results.
Nf710 (talk) 21:15, 15 December 2016 (UTC) Good basic understanding of the methods
[4+2] Cycloaddition of Butadiene & Ethene

Symmetry
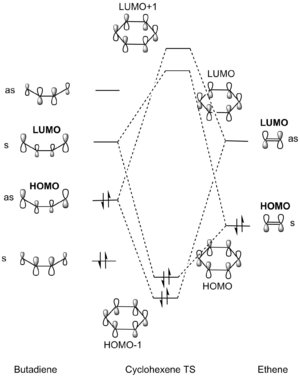
Butadiene and ethene react in a concerted, synchronous manner via a [4+2] cycloaddition to form cyclohexene. For this reaction the electrons must ‘flow’ between orbitals of the same symmetry; either both antisymmetric or both symmetric as Figure 2 indicates. Symmetry must be conserved. The orbitals in the product will also undergo the same symmetry operations as the reactants.

The 2 possible interactions that obey this conservation of orbital symmetry are shown below in Figure 3. A normal electron demand Diels-Alder reaction would be where the HOMO of the diene and the LUMO of the dienophile are the orbitals most similar in energy and so produce the largest splitting; the HOMO-1 and LUMO+1. This is often the case when the dienophile has electron-withdrawing substituents, which lower the energy of the LUMO and so lead to a smaller energy gap between the HOMO of the diene and LUMO of the electron-deficient dienophile; hence increasing the orbital overlap between them and leading to the largest splitting. However, if the dienophile is instead electron-rich, its orbitals are raised in energy and now the orbitals most similar in energy can be the HOMO of the dienophile and the LUMO of the diene; this leads to the largest splitting and an inverse electron-demand reaction as shown in Figure 3.

MO Analysis
| Ethene | Butadiene | Transition state | |||||||||
|---|---|---|---|---|---|---|---|---|---|---|---|
|
|
|
Figure 5 and the Jmols of the computed MOs indicate that the HOMO interaction is between the HOMO of ethene, the dienophile, and the LUMO of butadiene, the diene. Therefore it is seemingly a normal electron-demand Diels-Alder (DA) reaction as shown in Figure 4. However, the HOMO and HOMO-1 MOs are very close in energy. Similarly, the LUMO and LUMO+1 energies have very similar energies, which suggests that this could be in between a normal and inverse electron-demand reaction. This is perhaps not surprising since there are no electron-withdrawing substituents on the dienophile to lower its orbital energies and make its LUMO close in energy to the HOMO of the diene, which would lead to a small energy gap, optimal orbital overlap and hence the largest splitting- characteristic of a normal electron-demand DA reaction. From the Klopman-Salem equation the stabilisation/destabilisation energies of the bonding/antibonding MOs is directly proportional to the square of the overlap integral and inversely proportional to the energy gap between the interacting parent orbitals.
Bond Length Analysis
The Intrinsic Reaction Coordinate (IRC) of the reaction was used to plot a graph that highlights how all the implicated C-C bond lengths vary with the inverse of the reaction coordinate.

The Reaction Coordinate is going in the inverse direction; from product to reactants. Figure 6 shows bonds C1-C11 and C4-C12 (refer to reaction scheme) getting longer as butadiene moves away from ethene as the reactants form. At the transition state these bonds are 2.12 Å. The Van der Waals radius of a carbon atom is 1.7 Å and so 2.12 Å is less than double the Van der Waals radius, indicating that the molecules are close enough for bonding interaction. Figure 6 shows bonds C1-C2 and C3-C4 getting shorter as they become the double bonds of the diene and C1 and C4 go from sp3 to sp2 hybridised. At the transition state these bonds are 1.38 Å, shorter than both an sp3-sp2 single bond (1.50 Å) and a sp3-sp3 single bond (1.54 Å), indicating the forming sp2-sp2 double bond character. C2-C3 is initially the only double bond in the cyclohexene product and so it gets longer as you go back to the reactants and it becomes a single bond. C1-C2, C3-C4 and C11-C12 all go from single bonds in the product to shorter double bonds in the reactants.
Transition State Vibration
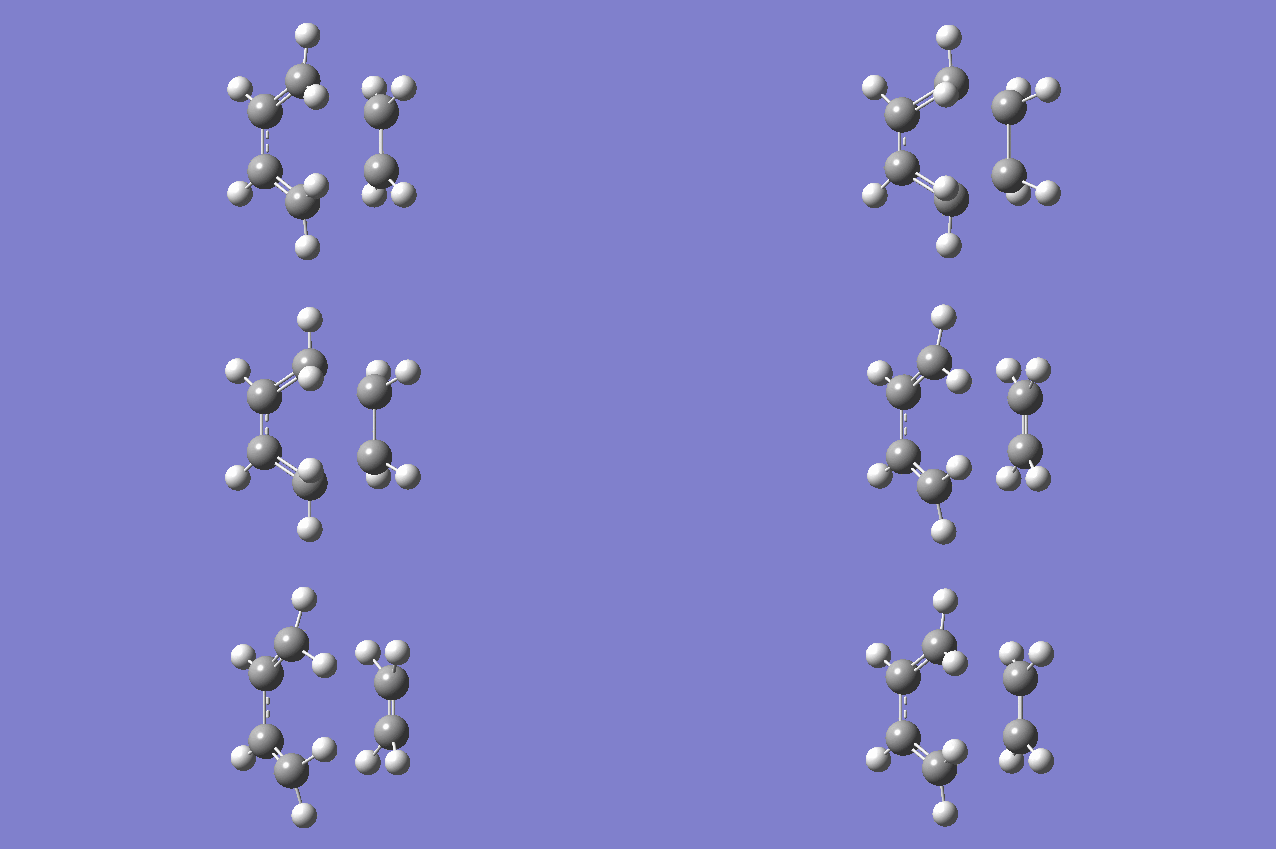
The vibration above illustrates the one unique negative and imaginary vibration frequency at the transition state (TS). As mentioned in the Introduction, the first derivative of the PES with respect to the reaction coordinate (r) is the gradient and the second derivative is the curvature, known as the force constant: k. From the equations of Simple Harmonic Motion (SHM) the frequency is proportional to the square root of k. The square root of a negative value is imaginary which is why the frequency (-948.72i cm-1) is negative and imaginary.
The vibration shows that the formation of the 2 new bonds between butadiene and ethene is synchronous.
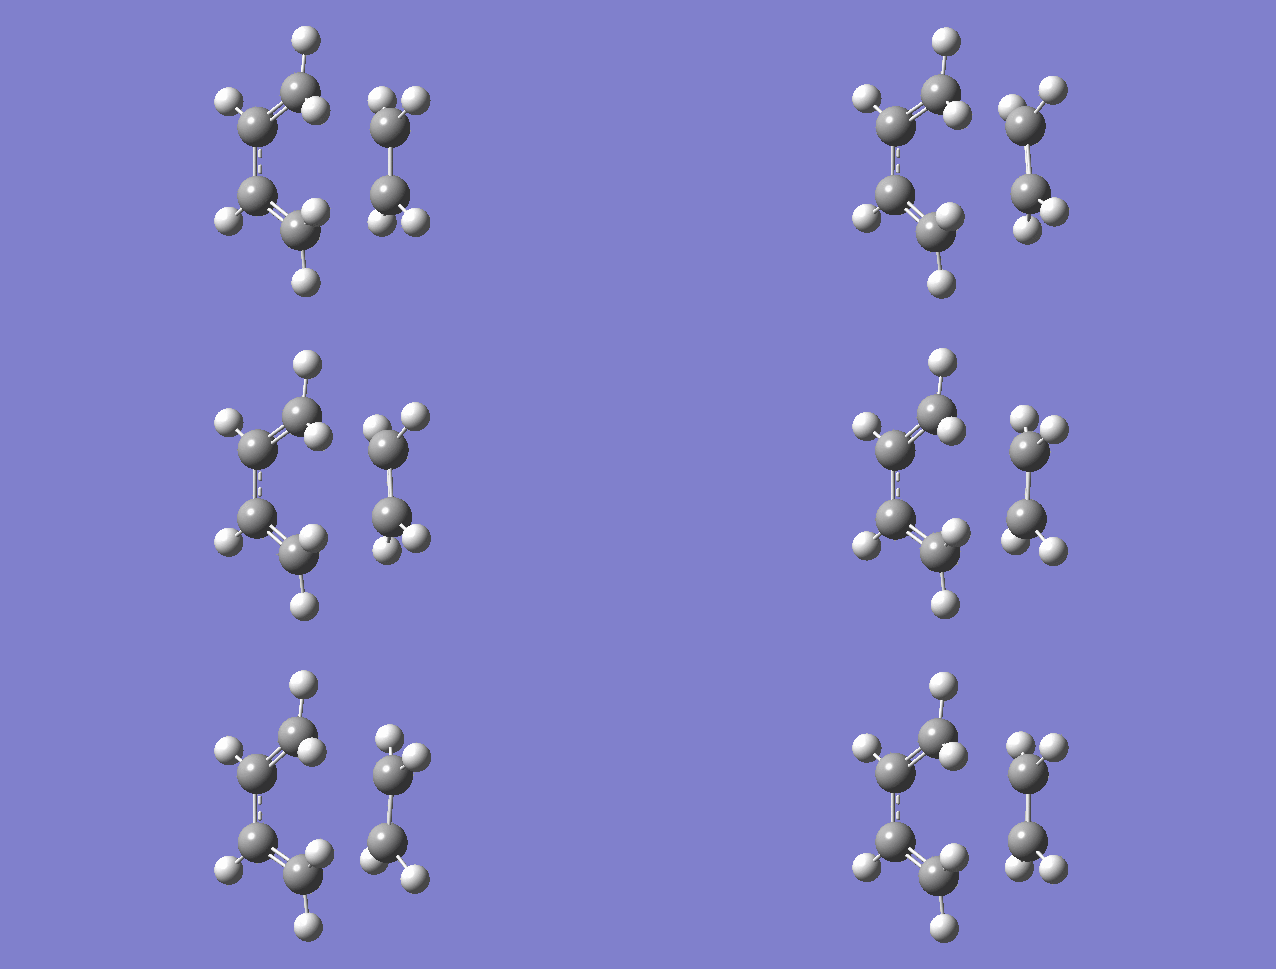
The vibration above shows the lowest positive frequency, which does not correspond to bond formation. (145.11 cm-1)
Nf710 (talk) 21:35, 15 December 2016 (UTC) Very good first section, good understanding of the demand of the reaction.
nding of the demand of the reaction.
Reaction of Cyclohexadiene and 1,3-Dioxole

MO Analysis
| Endo- HOMO (MO41) and LUMO (MO42) | Exo- HOMO (MO41) and LUMO (MO42) | ||||
|---|---|---|---|---|---|
The HOMO and LUMOs of the endo and exo transition states display symmetrical orbital overlapping which corresponds to normal electron demand. The MO diagram in fig 5 demonstrates this fact because normal electron demand is characterised by the HOMO of the diene and the LUMO of the dienophile (asymmetrical orbital overlaps as in fig 4) being closest in energy and so producing the largest splitting, leaving the symmetrical overlapping over the HOMO of the dienophile and the LUMO of the diene to produce the HOMO and LUMO of the transition state.
Favourable symmetrical secondary orbital overlap can be seen in the endo product above between the p orbitals of the oxygens in the dioxole and the p orbitals of the carbons in the diene that are not forming the new bonds to the dienophile. This explains why the activation energy for the formation of the endo product is lower than for the exo (see table)because this secondary interaction stabilises the transition state. The endo product is also lower in energy than the exo product, perhaps aided by the stabilising secondary orbital overlap and also less steric clash between the dioxole ring and the bridged carbons (refer to reaction scheme).
Nf710 (talk) 21:46, 15 December 2016 (UTC) Your energies are slightly out but you have come to the correct conclusion.
Activation Energy/Reaction Enthalpy
| B3LYP Optimisation | Reactants (kJ/mol) | TS (kJ/mol) | Product (kJ/mol) | |Ea| (kJ/mol) | |ΔGr| (kJ/mol) | |
|---|---|---|---|---|---|---|
| Geometry | Endo | 0 | 149.70 | -77.53 | 149.70 | 77.53 |
| Exo | 0 | 157.53 | -73.90 | 157.53 | 73.90 |
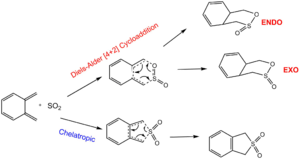
o-Xylylene and SO2 Cheletropic vs Diels-Alder Reaction
IRC Animations
| Endo | Exo | Cheletropic | |
|---|---|---|---|
| Animated IRC | 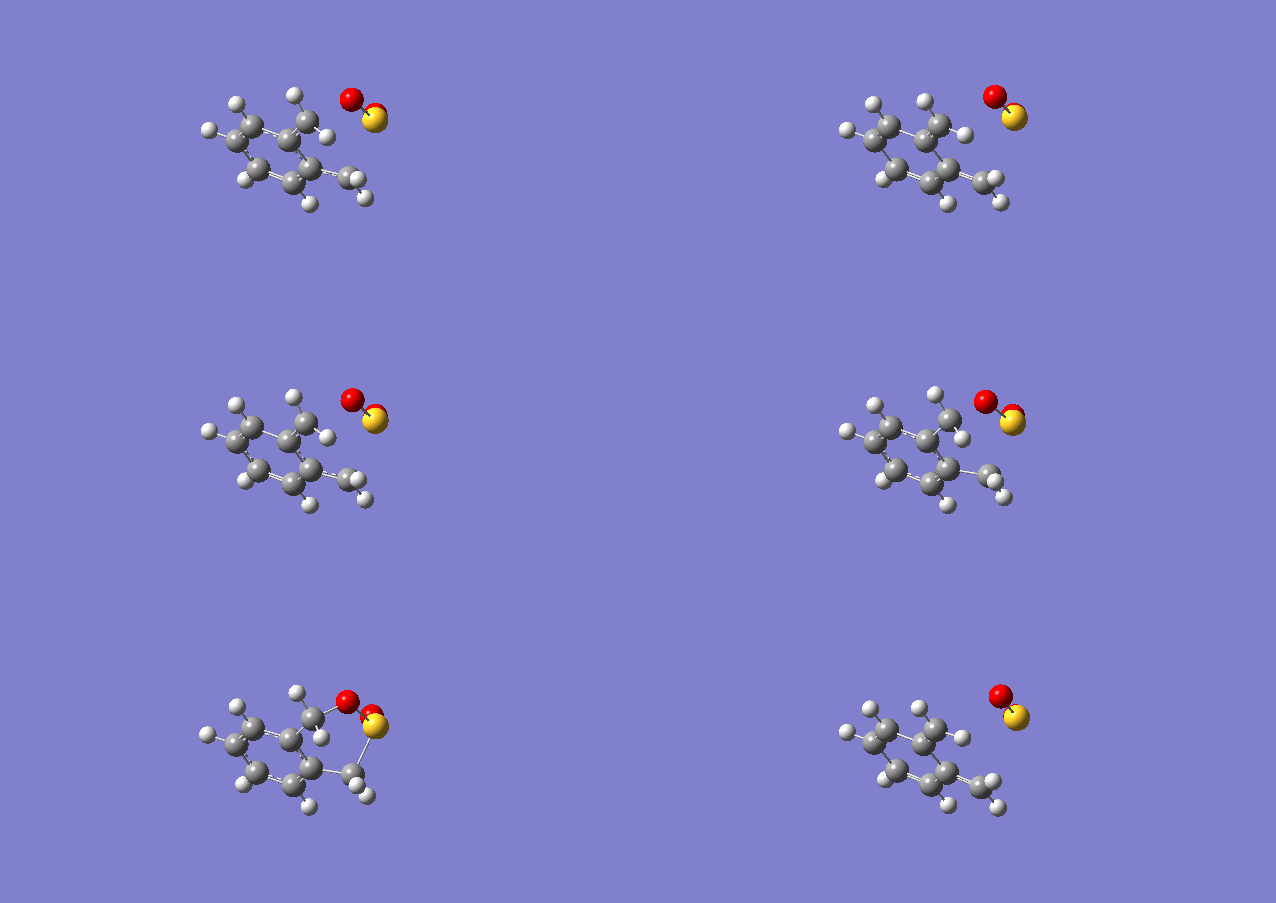 |
 |
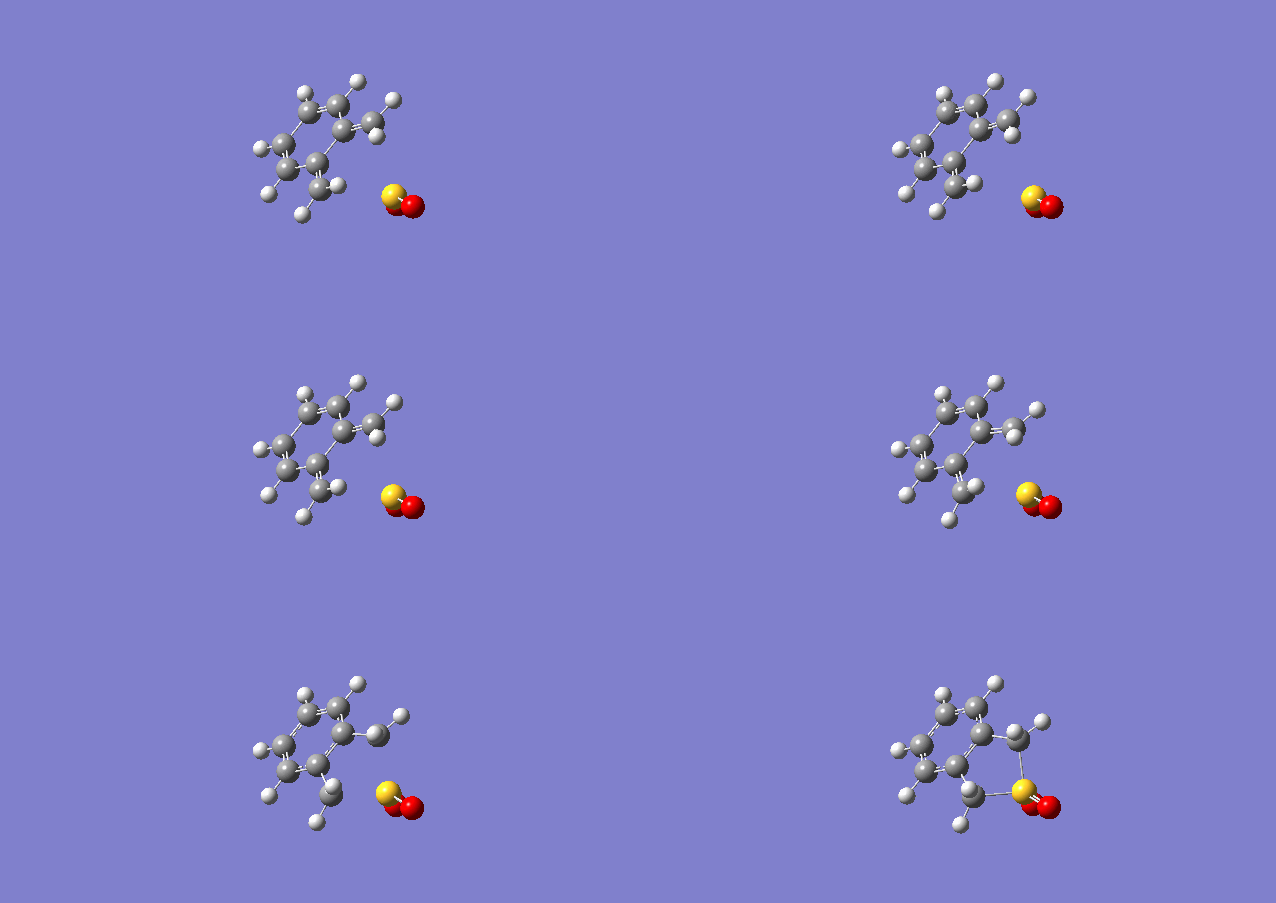 |
From these IRCs it can be seen that the double bonds in xylylene that are not interacting with SO2 seem to be breaking and rearranging around the 6-membered ring. This demonstrates the instability of xylylene which can decompose via numerous pathways.
Energy Profile
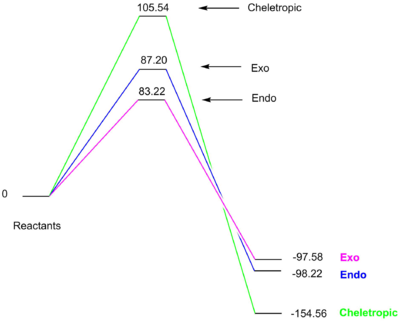
| PM6 Optimisation | Reactants (kJ/mol) | TS (kJ/mol) | Product (kJ/mol) | |Ea| (kJ/mol) | |ΔGr| (kJ/mol) | |
|---|---|---|---|---|---|---|
| Product | Endo | 0 | 83.22 | -97.58 | 83.22 | 97.58 |
| Exo | 0 | 87.20 | -98.22 | 87.20 | 98.22 | |
| Cheletropic | 0 | 105.54 | -154.56 | 105.54 | 154.56 |
LOG files
ENDO: File:EX-3-ENDO-PRODUCT-MIN.LOG File:EX3-ENDO-TS-PM6.LOG
EXO: File:TUTORIAL3-OP+FREQNAPHTHALENE.LOG File:TUTORIAL 3-EXO-TS-NEW.LOG
CHELETROPIC: File:EX3-CHELOREACTANTS-TS.LOG File:EX3-CHELOTROPICPRODUCT-OPTIMISEMIN.LOG
(Too light on discussion. What are the findings and how might they be rationalised? Tam10 (talk) 14:51, 6 December 2016 (UTC))
Conclusion
These exercises have demonstrated the value of using computational methods to visualise the symmetry of molecular orbital overlaps and rationalise the outcome of chemical reactions based on the relative energies of the possible transition states and products. They have also highlighted the limitations of using approximation optimisation methods where the results can often be inconclusive such as the in between normal and inverse electron demand in exercise 1 and the similar energies of the thermodynamic product in exercise 2.
References
- ↑ F. Jensen, Introduction to Computational Chemistry, Wiley, 2nd edn., 2007
- ↑ J. Clayden, N. Greeves and S. Warren, Organic Chemistry, 2nd edn., 2012.
- ↑ Atkins, Physical Chemistry, Oxford University Press, 10th edn.
- ↑ D. E. Wilk, C. D. Stanners, Y. R. Shen and G. A. Somorjai, Surf. Sci., 1993, 280, 298–312.
