Rep:Mod:HAS1501
Module 1
Modelling Using Molecular Mechanics
The Hydrogenation of the Cyclopentadiene Dimer
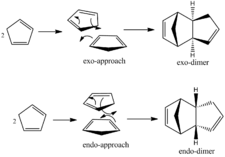
Cyclopentadiene readily dimerises via a Diels-Alder cycloaddition. Since there are two possible orientations of the molecules, there are hence two possible isomers that can be formed; the endo-isomer and the exo-isomer (see figure 1). It is however, known that the dimer formed from the reaction is predominantly of the endo-form. By using molecular modelling it is possible to calculate the relative energies of each of the aforementioned forms and determine whether this observed stereoselectivity is driven predominantly by thermodynamics or kinetics.
3D representations of the optimum geometries of the exo- and endo-dimers can be found via the respective links. Table 1 reports the calculated energy minima for both of these optimised structures.
| Form of Dimer | Energy of Molecule (Kcal/mol) |
|---|---|
| Exo-dimer | 31.877 |
| Endo-dimer | 33.998 |
It can be seen that from the perspective of modelling, the exo-dimer is the most thermodynamically stable compound and hence is predicted to be the favoured product in the dimerisation reaction. This is in contrast to experimental data which shows that infact the endo-form is almost exclusively formed in such a reaction. From this it can be deduced that the endo-form is the kinetic product of the reaction, and is the preferable form due to favourable interactions that arise in the transition state of the product1. Since the energy minima predicted by molecular modelling accounts only for attractive and repulsive energies within the product molecule, such interactions are unable to be considered in determining the most likely outcome of a reaction through this method.


Figures 2 and 3 show the two products of hydrogenation, (hereafter known as Molecule 3 and Molecule 4 respectively) formed from the kinetically favoured endo-dimer. As before, optimised 3D structures are shown via the links. For each of these molecules, the optimum geometry was calculated via the MM2 force field technique, and energy minima were calculated, including each of the seperate attractive and repulsive energies that contributed to this overall figure. These energy contributions consist of those resulting from bond stretching (str), bending (bend), torsional strain (tor), van der Waals forces arising from steric strain (1,4 vdw), hydrogen bonding (H-bond) and intermolecular van der Waals forces (non-1,4 vdw). Fsvourable interactions are indicated as negative. Results of these calculations are shown in Table 2.
| Product of Hydrogenation | Total Energy (Kcal/mol) | Str (Kcal/mol) | Bend (Kcal/mol) | Tor (Kcal/mol) | 1,4 vdw (Kcal/mol) | non-1,4 vdw (Kcal/mol) | H-bond (Kcal/mol) |
|---|---|---|---|---|---|---|---|
| 3 | 35.685 | 1.278 | 19.858 | 10.811 | 5.633 | -1.223 | 0.162 |
| 4 | 31.152 | 1.098 | 14.525 | 12.497 | 4.511 | -1.070 | 0.141 |
With regards to the products of hydrogenation, it can be seen that Molecule 4 is both the more stable of the two products. This molecule is subject to significantly less strain from bending and steric repulsion (1, 4 vdw), although does experience slightly more torsional strain than the alternate hydrogenation product (Molecule 3). Other energetic contributions can be seen to be comparable for both molecules.
From these results, it can be deduced that Molecule 4 is the thermodynamically favoured hydrogenation product and hence this double bond should be subject to hydrogenation more readily than the one in Molecule 3. Hydrogenation resulting in the formation of molecule 3 is hence controlled by kinetics.
Stereochemistry and Regioselectivity of an Intermediate in Taxol Synthesis
Figures 4 and 5 show two isomers of an intermediate formed in the synthesis of Taxol.
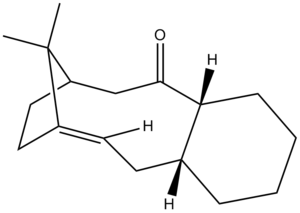
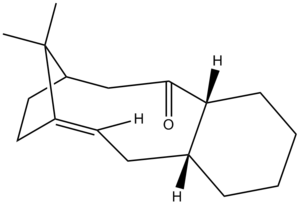
The possibility of two isomers arises due to the steric strain exhibited upon the single bonds adjacent to the carbonyl group, resulting in reduced rotation about these bonds , hence leading to a pair of atropisomers. The kinetically favoured isomer is formed initially which then isomerises upon standing to the alternate form. Molecular mechanics was used to determine which of the isomers is the most thermodynamically stable. Calculations were performed with both MM2 and MMFF94 force fields as to allow comparison between the two methods. Table 3 shows the results obtained for both isomers; links show 3D representations of the isomers.
| Isomer | MM2 Predicted Energy Minima (kcal/mol) | MMFF94 Predicted Energy Minima (kcal/mol) |
|---|---|---|
| A | 57.62 | 81.73 |
| B | 53.16 | 77.88 |
It can be seen from the results that both methods report isomer B to be the more thermodynamically stable of the two. From visual examination of the configurations of the molecules, this could be predicted since in isomer B, the six-membered ring is in the energetically preferable chair conformation, as opposed to A where the ring has adopted the twist-boat orientation2. Further analysis into each of the contributions to the overall energy (see table 4) confirms this, as it can be seen that all aspects are reasonably similar for both isomers disregarding the contributions from molecular bending and torsional strain; both of these are significantly greater for isomer A.
| Isomer | Total Energy (Kcal/mol) | Str (Kcal/mol) | Bend (Kcal/mol) | Tor (Kcal/mol) | 1,4 vdw (Kcal/mol) | non-1,4 vdw (Kcal/mol) | H-bond (Kcal/mol) |
|---|---|---|---|---|---|---|---|
| A | 57.62 | 2.898 | 19.226 | 22.087 | 14.865 | -0.639 | -0.012 |
| B | 53.16 | 2.844 | 16.239 | 20.118 | 14.009 | 0.687 | 0.128 |
Results determined using the MMFF94 force field gave higher energy values (in the region of 24 kcal/mol) than those obtained from the MM2 method. This is due to the different parameters measured within the force fields and confirms the statement that results from alternate modelling methods cannot be compared.
It should be noted that prior to manual manipulation, both molecules gave a false minimum at around 128 kcal/mol, possibly suggesting an intermediate at this higher energy.
It is reported that the alkene functional group within the molecule reacts abnormally slowly. Molecular mechanics allows justification of this phenomenon. The phenomenon of hyperstable alkenes has been reported by Sellers et al3 and concerns molecules in which the alkene functional group reacts uncharacteristically slowly in molecules with a large steric demand about the bond. The concept regards the issue that the fully saturated molecule would be of a higher energy than the unsaturated molecule due to extra steric hinderance caused from additional atoms4. For normal alkanes, this is not the case, but for molecules such as the one in question, hyperstability of the alkene does occur. The fully saturated molecule (with hydrogen added across the double bond) has an energy minima at 58.347 kcal/mol (MM2 force field) which is higher than both isomers of the intermediate. Hence, it is not energetically favourable for the molecule to react in this fashion.
Modelling Using Semi-Empirical Molecular Orbital Theory
Regioselective Addition of Dichlorocarbene
As well as allowing the prediction of preferred geometries of molecules, computational chemistry can also be used to calculate the molecular orbitals of compounds. This can then be applied to determine numerous properties about how such a molecule might react under certain conditions.
Part I
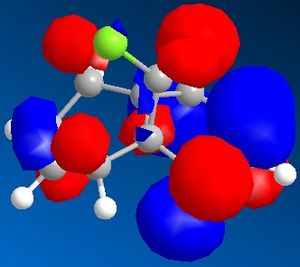
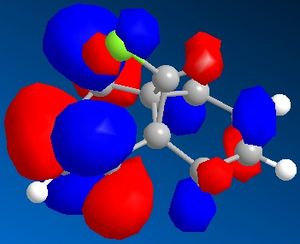
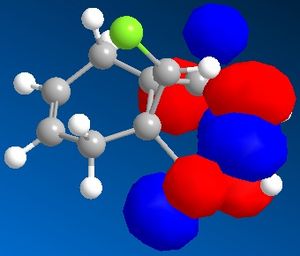
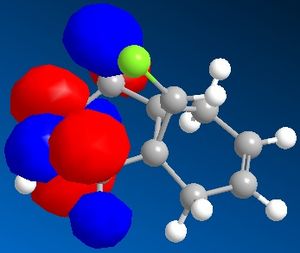
Figure 7 shows a molecule of dichlorocarbene. Initially the optimum geometry was calculated using the MM2 force field, before the MPOAC/PM6 method was employed to determine the molecular orbitals of the molecule. From study of the molecular orbitals, the reactivity of the double bonds can be rationalised; namely, if they can be distinguished from an MO perspective and if so which is the more likely to react. Molecular orbitals obtained from this procedure are shown in figures 8 to 12.
Initial analysis of the results suggests that the orbitals produced seem logical. It can be seen that the HOMO-1 and the HOMO are a pair of bonding pi-orbitals, the former with most interactions located on the double bond exo- to chlorine, and the latter with interactions focused on the endo-double bond. The LUMO and the LUMO+1 also form a second pair of orbitals; again, the former is located on the exo-double bond and the latter on the endo-. The final orbital, the LUMO+2, is an anti-bonding Cl-C sigma-orbital. Since the molecule is quite symmetrical (with the exception of the substituents on the cyclopropyl ring), these results seem to be in agreement with what would be expected.
It is reported that the more reactive double bond within the molecule is located endo- to the chlorine molecule on the cyclopropyl ring5. Furthermore it has been stated that addition reactions occur on the face of the molecule opposite the aforementioned ring. Visual analysis of the molecular orbitals produced will allow this data to be rationalised. It is known that reactions involving dichlorocarbene proceed in a similar manner to electrophilic addition. Hence, the most reactive double bond will be the most nucleophilic, i.e. the one where the greatest electron density is present in the HOMO. Figure 9, as mentioned previously, shows that bonding interactions are focused on the endo-double bond in the HOMO; this indicates that from an orbital perspective, this region of the molecule is much more available to electrophilic attack. Furthermore, it can be seen in figures 8 and 12 that the symmetries of the HOMO-1 and the LUMO+2 allow mixing interactions between these two orbitals, so long as their respective energy levels are similar enough to allow this. This interaction would stabilise the exo-double bond further, resulting in it being less reactive.
With regards to the preferential face of the molecule at which attack occurs, the molecular orbitals also justify the reported data. Negative areas of the orbitals (i.e. those where electron density is located) are shown in blue in the orbitals above; hence on the endo-double bond, the electron density is located on the bottom face of the molecule (with regards to the picture). This area of the molecule is hence the most nucleophilic. This stereospecificity can also be explained from a steric perspective; since the cyclopropyl ring is located on the top face of the molecule, less strain will be experienced if new substituents are placed on the less hindered bottom face.
Part II
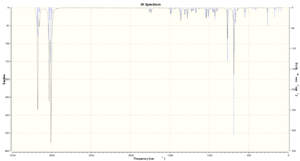
In addition to the previous techniques employed, computational chemistry can also be used to predict various spectra of molecular structures. In the following investigation, the aforementioned dichlorocarbene and the monohydrogenated system (containing only the endo-double bond) were subjected to PM6 energy minimisation to determine the optimum geometries. The vibrational spectra of both of these compounds was then predicted, allowing a comparison between the two. Spectral results are shown in figures 13 and 14, below. Assignment of each of the peaks is given in table 5. 3D representations of the molecules are located via the links, as previously.

| Molecular System | Symmetry | Energy of Molecule (Kcal/mol) | Functional Group | Peak (cm-1) |
|---|---|---|---|---|
| Di-alkene (Mol. 12) | Cs | 17.894 | C-Cl | 689.57(s) |
| C=C (endo) | 1757.44(w) | |||
| C=C (exo) | 1737.03(w) | |||
| Mono-alkene (Mol. 13) | Cs | 24.783 | C-Cl | 681.95(s) |
| C=C (endo) | 1753.76(m) |
The spectrum for molecule 13 can be seen to have a strong peak in the expected C-Cl vibration, as can molecule 12. The expected frequencies for alkene stretching within molecules is between 1500 and 2000cm-1 and these are reported to have only a weak to medium intensity6 due to the low polarizability of the C=C double bond. Whilst molecule 13 quite clearly shows one peak in this area, the spectrum for molecule 12 gives 2 weak peaks at these points. With regards to the overall spectra of both molecules, the obtained result for molecule 13 shows a lot more activity than the dichlorocarbene spectrum. This relates to the increased vibrational activity of the molecule, due to the reduction in rigidity imposed by the second double bond; aswell as this, the incorporation of two extra hydrogen atoms within the molecule allows for more vibrational activity.
With regards to the assignment of the double bond frequencies, it is known that the endo- double bond has a greater amount of electron density than the exo- (from results previously). From this, it can be deduced that this is in fact the stronger double bond, and hence requires greater amounts of energy for vibrations. Thus, the endo- double bond will vibrate at a higher frequency then the exo- double bond.
Monosaccharide Chemistry: Glycosidation
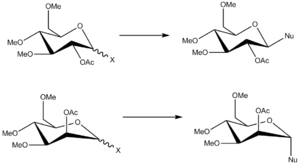
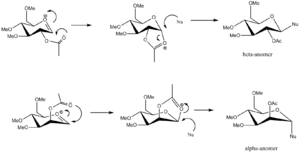
Figure 15. shows the process of glycosidation in which a nucleophile replaces a leaving group located on the carbon adjacent to the ring oxygen. As shown, this leads to the formation of two anomers, the production of which depends on the direction of the acetyl group, which can either be above or below the ring. Figure 16 shows the mechanism by which the reaction proceeds, allowing explanation as to why this effect occurs. Molecular modelling allows these conditions, including the oxonium cations and the subsequent intermediates formed, to be analysed in terms of energetic contributions to seek an explanation for the high level of diastereospecificity that reactions of this type show.
For the R-group substituent on each of the oxygen atoms, it was decided the methyl would be the most appropriate choice. This was due to the issue that if hydrogen were chosen, the resulting molecule would be a lot smaller than the true representation, and inter- as well as intra-molecular bonding arising from the polarity differences between oxygen and hydrogen would result in an unrealistic model of the system. Larger substituents would result in a more realistic view of the molecule, however these would also result in a far greater computational demand (and hence required time), thus it was felt that methyl was a sufficient group to use.
With regards to the type of force-field used for the modelling, both MM2 and MOPAC/PM6 were employed to model each of the molecules. From these, it is likely that the result obtained from MOPAC/PM6 will give a more suitable result, since the process involves modelling transition state molecules. It has already been demonstrated previously (see cyclopentadienyl dimerisation) that the MM2 force field is lacking with regards to this; the MOPAC/PM6 method takes into account electrons aswell, and hence is more suitable in modelling transition states.
Results of the molecular modelling using both methods are shown in Table 6. As previously, links show the PM6-geometry optimised 3D representations of the models being regarded.
| Molecule | MM2 Energy Minimum (kcal/mol) | PM6 Heat of Formation (kcal/mol) |
|---|---|---|
| A | 27.950 | -57.840 |
| B | 29.441 | -60.640 |
| C | 32.873 | -58.077 |
| D | 30.418 | -60.642 |
Both results are in agreement with regards to the energies of the complexes (i.e. those with the higher energy minima have a more negative heat of formation-more energy is required to form the molecule). It can be seen that the initial cation A (acyl group above the ring) has a lower energy than B (acyl group below the ring), although this is reversed for the intermediates (C represents attack from above the ring, D from below). Both intermediates are of higher energy than the respective oxonium ions, although the differences between the relevant ion and intermediate are minimal. Note that the energy differences calculated with the MM2 method are greater than those obtained from the PM6 calculation. Since it has already been deduced that the PM6 method is more likely to be reliable in modelling these circumstances, it is believed that these results are more notable. The similarity in energies between the ions and the intermediates explains why the reaction progresses in the manner that it does. It is likely that for rotation from one anomer to the other there is a considerable energy barrier which exceeds that required to form the respective intermediate. Hence, specific anomers are formed depending on the orientation of the acetyl group.
Individual energy contributions (calculated using the MM2 force field) are shown in table 7, as are calculated distances between the acetyl oxygen and the carbon under attack.
| Isomer | Distance x10-10m | Total Energy (Kcal/mol) | Str (Kcal/mol) | Bend (Kcal/mol) | Tor (Kcal/mol) | 1,4 vdw (Kcal/mol) | non-1,4 vdw (Kcal/mol) | H-bond (Kcal/mol) |
|---|---|---|---|---|---|---|---|---|
| A | 2.546 | 27.950 | 2.326 | 8.594 | 1.1944 | 18.543 | -1.865 | 5.952 |
| B | 2.451 | 29.441 | 2.299 | 9.118 | 2.057 | 18.885 | -1.657 | 6.161 |
| C | 1.407 | 32.873 | 1.937 | 11.368 | 8.979 | 18.721 | -4.386 | -0.400 |
| D | 1.405 | 30.418 | 1.919 | 12.935 | 8.303 | 17.707 | -3.610 | -2.378 |
It can be seen that the lower energy isomer A has a greater distance between the attacking oxygen and the anomeric carbon than the equivalent distance in isomer B. Similarly, the transition states also share this pattern. Increase in energy in both of these cases is mainly accounted for by strain induced by bending of the molecule. It can thus be seen from the results that with regards to the progression of the reaction, whilst the transition from A to C takes an energetically lower pathway, it involves a greater distance from the oxygen to the carbonyl, which is not preferred. The reaction can then either occur via a low energy pathway but with greater inter nuclear separation, or by a higher energy pathway with a closer range of attack. Clearly it is the influence of the neighbouring groups which affects this the most.
Mini Project: The Total Synthesis of (-)-Cubebol

Figure 16 shows part of the reaction scheme for the stereocontrolled synthesis of (-)-cubebol. The complete synthesis has been reported by Hodgson et 7, in which each of the intermediates were subjected to rigorous analysis to ensure that the desired enantiomer had been produced. In the following investigation, computational methods shall be used to model each of the intermediates shown in figure 16, allowing spectra for the respective molecules to be predicted. This data shall then be analysed and compared to that reported by the original authors, to investigate whether or not the results agree with those obtained experimentally. Any disagreements between the results shall be discussed, as will the computational methods employed, with regards as to how succesful they were at predicting molecular properties.
The first molecule to be subjected to analytic methods was .
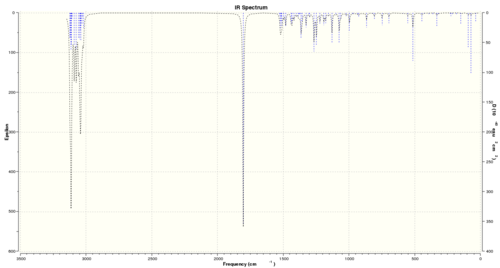
Initial geometry optimisation of the molecule gave an energy minima at 15.732 kcal/mol. Infra-red and 13C NMR data were predicted from computational methods, and the optical rotation of the molecule was also predicted. Figures 17 and 18 show these spectra respectively.
 |
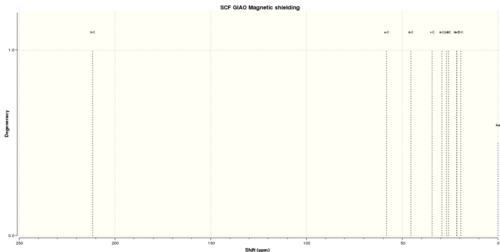 |
Table 8 shows frequencies of predicted peaks within the IR spectrum, and their relevant assignments. It is noted that predicted peaks are often systematically higher (by up to around 8%) than the true values. Corrected values for peaks (taking into account the maximum error) have thus been included.
| Peak frequency (cm-1) | Corrected frequency (cm-1) | Literature values | Functional group8 |
|---|---|---|---|
| 3113.73 (s) | 2864.63 | 2961 (s) | -C-H stretch |
| 3047.72 (s) | 2803.90 | 2931 (s), 2872 (m) | -C-H stretch (antisym and sym) |
| 1804.42 (s) | 1660.07 | 1712 (s) | C=O stretch |
| 1521.92 (w) | 1400.17 | 1455 (w) | CH3 antisym deformation |
| 1363.56 (w) | 1254.48 | 1315 (w) | --- |
| 866.47 (vw) | 797.15 | 750 (w) | CH2 rock |
The majority of the peaks located within the spectrum can be assigned to functional groups within the molecule. The ranges of peak frequencies predicted are in good agreement for those obtained experimentally. Table 9 shows chemical shifts for the predicted C-13 NMR spectrum of menthone, along with assignments of carbons and reported literature results. The method is known to be accurate to around 5ppm, and so this has been taken into account when comparing results to the literature. C1 is regarded at the carbon at the carbonyl group. Ring carbons are then labelled ascending clockwise.
| Chemical Shift (ppm) | Literature values (ppm) | Functional group9 |
|---|---|---|
| 221.67 | 212.3 | C1 |
| 58.29 | 55.8 | C2 (adj to carbonyl) |
| 45.40 | 50.8 | C6 (adj to carbonyl) |
| 34.52 | 35.4 | C5 |
| 29.21 | 33.9 | C4 |
| 26.92 | 27.8 | C3 |
| 25.85 | 25.8 | Ring-C-Me2 |
| 21.62 | 22.2 | Ring-C-H3 |
| 21.49 | 21.2 | Ring-C-MeMe |
| 19.52 | 18.7 | Ring-CMe-Me |
With the exception of the carbon at 221.67/ 212.3ppm, all predicted shifts are within 5ppm of those found experimentally, and so it can be stated with reasonable certainty that the molecular geometry obtained was of the correct form. Higher chemical shifts are experienced by the carbon closest to the oxygen (due to the electronegativity and hence shielding effect of O); this evidently decreases on moving further away from the oxygen, and so those carbons at lower chemical shifts are non-ring side chain atoms.
In addition to the IR and NMR spectra, the optical rotation of menthone was also calculated. The results of this gave an [alpha]D value of -69.34 degrees. This is quite substantially different to that cited in the literature which was -28.5 degrees. In spite of the large difference in angle, both computational and experimental data agree that the molecular polarises light in the same direction.
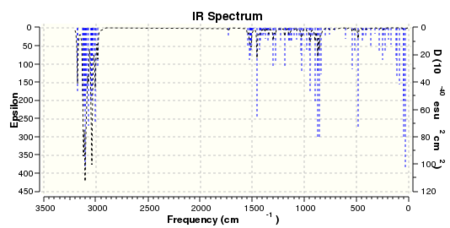
Intermediate 17 was also subjected to analytical predictions. Spectral results are shown in figures 19 and 20.
 |
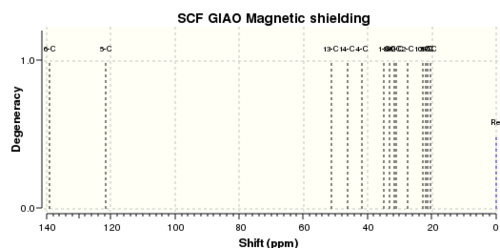 |
Table 10. reports the results of the IR spectra, along with assignment and literature comparison.
| Peak frequency (cm-1) | Lower corrected frequency (cm-1) | Literature values | Functional group8 |
|---|---|---|---|
| 3179.53 (m) | 2925.17 | 2955 (s) | CH stretch |
| 3104.67 (s) | 2856.30 | 2929 (s) | CH stretch |
| 3042.59 (m) | 2799.18 | 2851 (m) | CH3 attached to O, stretch |
| 1455.39 (m) | 1338.96 | 1463 (w) | CH3 antisym deformation |
| 899.50 (m) | 827.54 | 918 (w) | CH2 out of plane wag |
| 855.38 (m) | 786.95 | 836 (w) | CH out of plane deformation |
The predicted spectrum is in good agreement with that observed experimentally. All peaks can be assigned to a particular functional group within the molecule. Despite this, one would expect to observe a strong O-C-O stretch peak around 1250 to 1170 cm-1 which is present in neither spectrum. Table 11. gives chemical shifts for C-13 NMR results predicted by computational chemistry. Again, the peaks have been assigned and compared to literature values.
| Chemical Shift (ppm) | Literature values (ppm) | Functional group9 | |
|---|---|---|---|
| 139.06 | 141.0 | C1 (adj to O) | |
| 121.53 | 125.8 | CH=C | |
| 51.34 | 52.3 | CH-O | |
| 46.12 | 47.1 | CH2-C1 | |
| 41.73 | 42.1 | CH-epoxy ring | |
| 31.62 | 32.35, 32.3 | CHMe, CMe2 | |
| 31.07 | 32.2 | Alkyl chain CH2 adj to alkene | |
| 27.55 | 31.2, 31.1 | Alkyl chain CH2 | |
| 22.95 | 24.6 | Alkyl chain CH2 | |
| 21.96 | 19.7 | Ring-C-H3 | |
| 21.41 | 19.65 | Ring-CMe-Me | |
| 20.40 | 19.3 | Ring-CMeMe |
NMR predicted and experimental results are again in reasonable agreement with no inconsistent peaks at values greater than 5ppm of that expected. All groups can be assigned to functional aspects of the molecule. As for menthone, the optical rotation of the molecule was measured, producing a prediction of [alpha]D=+113.88 degrees. The literature cites the rotation as +26.8 degrees. As for menthone, the value of the angle grossly disagrees, yet the direction is consistent for both.
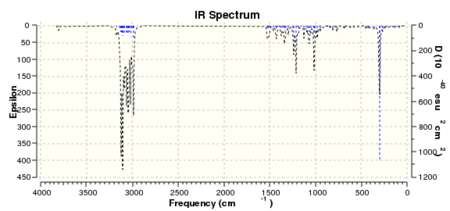
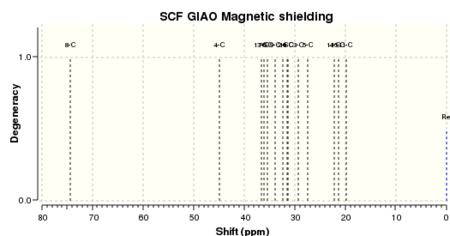
Results of spectral predictions for Intermediate 18 can be found in figures 21 and 22.
 |
 |
Assignment of infra-red peaks predicted and comparison to literature values is shown in Table 12.
| Peak frequency (cm-1) | Corrected frequency (cm-1) | Literature values | Functional group8 |
|---|---|---|---|
| 3807 (w) | 3502 | 3608 (w) | -OH stretch |
| -- | -- | 3447 (br) | --- |
| 3123.9 (m) | 2873.9 | 3018 (m) | CH antisym/ sym stretch |
| 3102.34 (s) | 2853 | 2958 (m) | CH antisym/ sym stretch |
| 3039.45 (m) | 2796 | 2928 (m) | CH antisym/ sym stretch |
| 2987.84 (m) | 2748 | 2870 (m) | CH antisym/ sym stretch |
| 1519.81 (m) | 1398 | 1385 (w) | CH3 sym deformation |
| 1426.65 (w) | 1312 | 1371 (w) | isopropyl CH3 deformation |
| 1235.14 (s) | 1136 | 1216 (s) | C-OH stretch |
Predicted results are in good agreement with those reported, with the exception of a broad peak at 3447 cm-1 which is not found in the predicted spectra. Apart from this, all other peaks can be assigned to respective functional groups within the molecule, and correspond to those found experimentally. Results of NMR modelling are reported in Table 13. Carbons are labelled with the top bridging atom as C1 in a clockwise fashion (the carbon attached to the alcohol group is C4)
| Chemical Shift (ppm) | Literature values (ppm) | Functional group9 | |
|---|---|---|---|
| 74.5 | 75.1 | C4 | |
| 44.9 | 44.1 | C7 | |
| 36.5 | 35.4 | C5 | |
| 36.1 | 34.5 | C1 | |
| 35.3 | 33.5 | C10 | |
| 33.9 | 31.6 | C3 | |
| 32.3 | 31.4 | C9 | |
| 31.5 | 29.9 | CHMe2 | |
| 31.4 | 28.6 | C2 | |
| 29.3 | 26.5 | C8 | |
| 27.5 | 24.6 | C6 | |
| 22.2 | 19.9 | CHMe | |
| 21.3 | 19.6 | CMeMe | |
| 19.8 | 19.1 | CMeMe |
All NMR peaks are in reasonable agreement (within 5ppm) of those reported experimentally, and can be assigned accordingly.
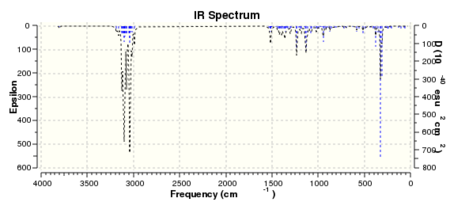
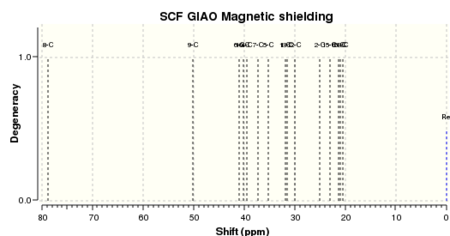
The results of the optical rotation gave an [alpha]D value of -34 degrees. The literature quotes the optical rotation as -10.7 degrees. As previously, the direction the light is polarised is consistent with the experimental data but the angle predicted is contradictory. Finally, computational modelling of cubebol returned the following results, shown in figures 23 and 24.
 |
 |
Results of the IR-spectrum prediction are reported in Table 14.
| Peak frequency (cm-1) | Corrected frequency (cm-1) | Literature values | Functional group8 |
|---|---|---|---|
| ---- | ---- | 3350 (br) | -OH stretch |
| 3019.4 (s) | 2777.5 | 2951 (m) | -C-H stretch (antisym and sym) |
| 3046.8 (s) | 2803.0 | 2860 (m) | -C-H stretch (antisym and sym) |
| 1520.2 (m) | 1398.4 | 1490 (w) | CH3 antisym deformation |
| 1234.1 (m) | 1135.3 | 1142 (m) | C-OH stretch |
| 945.8 (w) | 870.1 | 910 (w) | ring breathing |
Apart from the broad -OH peak which would be expected, all other experimental peaks were predicted reasonably well and can be assigned to functional groups in the molecule. NMR results are shown in Table 15. Numbering of carbons is as mentioned previously.
| Chemical Shift (ppm) | Literature values (ppm) | Functional group9 | |
|---|---|---|---|
| 78.8 | 80.3 | C4 | |
| 50.2 | 44.1 | C7 | |
| 41.1 | 39.0 | C5 | |
| 40.2 | 36.3 | C3 | |
| 39.6 | 33.6 | C11 | |
| 37.3 | 33.4 | C1 | |
| 35.3 | 31.7 | C9 | |
| 31.9 | 30.8 | C10 | |
| 31.4 | 29.2 | C2 | |
| 30.0 | 27.9 | C12 | |
| 25.0 | 26.4 | C8 | |
| 23.0 | 22.6 | C6 | |
| 21.3 | 20.1 | CMeMe | |
| 21.1 | 19.6 | CMeMe | |
| 20.5 | 18.7 | CHMe |
The NMR predicted is in reasonable agreement with that obtained from experimental data, and all but one of the carbons give shifts within 5ppm of that reported. All groups can thus be assigned accordingly. The optical rotation predicted for (-)-cubebol gave a result of -15.26 degrees; that reported in the literature was -48.3 degrees. Again, the correct direction is predicted but the overall angle differs significantly.
It can be seen that spectroscopically, reasonably accurate data can be predicted from molecular modelling. Issues arise with regards to broad peaks within IR spectra, but disregarding that, most results were quite accurate. NMR results do not normally differ by more than a few ppm although the occasional one has been found to give readings greater than 5ppm away from that reported. The main issue with regards to modelling molecules in this manner relates to the prediction of the optical rotation. Computational methods allow the correct direction of the polarised light to be determined, but the angles returned are often (in this case always) substantially different from those one obtains experimentally.
References
1. Clayden, Greeves, Warren and Wothers; Organic Chemistry, Oxford Press 2001, p. 916
2. S. W. Elmore and L. Paquette, Tetrahedron Letters, 1991, 319
3. S. F. Sellers et al, J. Am. Chem. Soc., 1982, 104
4. P. Camps et al, Tetrahedron Letters, 1997, 53
5. B. Halton, R. Boese and H. S. Rzepa, J. Chem. Soc., Perkin Trans 2, 1992, 447
6. Clayden, Greeves, Warren and Wothers; Organic Chemistry, Oxford Press 2001, p. 71
7. Hodgson et al, J. Org. Chem., 2010, 75
8. Lambert, Shurvell, Lightner and Cooks; Organic Structural Spectroscopy, Prentice Hall Inc 1998, pp. 189-199
9. Lambert, Shurvell, Lightner and Cooks; Organic Structural Spectroscopy, Prentice Hall Inc 1998, Inside back cover, 'Carbon Chemical Shift Ranges'

