Rep:Mod:Guess Who Batman
Module 3: The Transition State
Introduction
The intention of this exercise was to look into the transition state. This is a very theoretical discussion as in general and by definition transition states are very rarely isolated and so can rarely be looked at spectroscopically.
As such computational studies are a hugely valuable tool in linking well defined theories with actual chemical reactivity. By modelling and looking into aspects such as strain, orbital overlap and stability we can find the pathway by which a reaction proceeds and so understand why reactions occur as they do. This study uses common techniques and applies them to well known problems and hopes to find solutions to the difficult questions involved.
Tutorial
In order to become familiar with the techniques which were to be used and the outputs they generated a tutorial exercise was undertaken before the main body of the computational study was done.
This tutorial involved a study of 1,5-cyclohexadiene. 1,5-cyclohexadiene can exist principly in two different forms, the anti and the gauche conformers. These two differ in the dihedral angle around the central four carbons with the anti having a bond angle of 180° with the groups anti-periplanar to one another while the gauche has a bond angle of 0° with the groups completely eclipsed. As such we would not be unreasonable to suggest that the anti form would be lower in energy
To begin with the anti form was drawn in GaussView and optimised. This was done using the Hartree Fock approximation and a 3-21G basis set. The Hartree Fock approximation models LCAO, this is the linear combination of atomic orbitals and so the molecular orbitals are built up of simple sums of the atomic orbitals. This is a widely used approximation and so is a useful place to start. The 3-21G basis set is also a widely used basis set. This is a basic example of a split valence basis set. In this the different numbers describe the number of functions which are summed to make up the approximation for a particular type of orbital, e.g. the 3 is the number of functions used to make up the approximation for the inner orbitals.
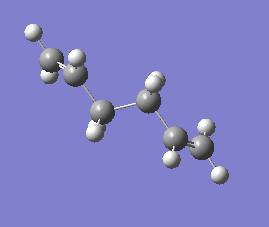
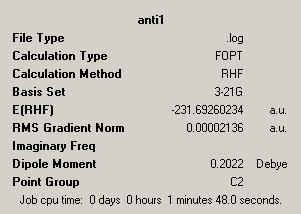
The optimisation was set up in GaussView and then run in Gaussian. This resulted in the below results:
| Anti Form | |||
| |||
| |||
| Point Group = C2 | |||
| Energy = -231.69260234 | |||
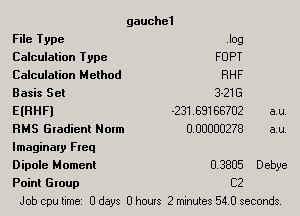
In a similar fashion the same was done for the Gauche conformer. Again results are tabulated:
| Gauche Form | |||

| |||
| |||
| Point Group = C2 | |||
| Energy = -231.69166702 | |||
We can compare the results of these two conformers. We initially see the two are quite similar, they both have a point group of C2. The main, and most important difference is the energy of the two conformers. We see that the anti isomer is in fact the lower in energy this is by a value of 2.46kJ mol-1, which is comparable to RT. This means that we will see some conversion between forms at room temperature.
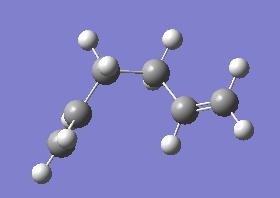
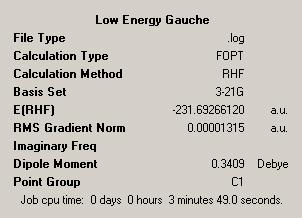
What we do notice from this is that the most stable conformer is where the two C=C bonds are as far away from each other as possible. We can envisage a further more stable conformer where the two groups are even further apart. It is important that we find the lowest energy conformer as this is the ground state with respect to which we quote relevent energies such as the activation energy and the enthalpies. This is tabulated below:
| Lowest Energy Gauche Form | |||
| |||
| |||
| Point Group = C1 | |||
| Energy = -231.69266120 | |||
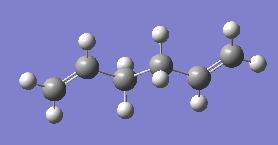
We see a major difference between this optimisation and the previous two in the point group as this is C1 compared with the C2 point group of the earlier optimisations. It is possible to compare these structures generated with reference structures given[1]. In doing so we see that the anti structure generated corresponds to "anti1" while the gauche structure corresponds to "gauche2". Finally the lowest energy structure generated is given as "gauche3". We can also compare the energies we have obtained with reference values, these are pleasing results as the two agree, indicating that the computation done has been successful. The final observation we make is that we have indeed identified the lowest energy structure.
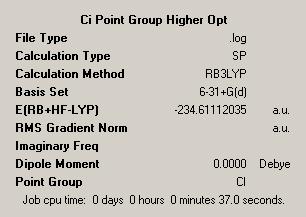
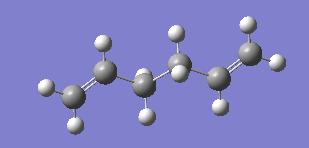
Moving forward we can look into conformers with different point groups. As such we can model and optimise the Ci structure. In this we optimised firstly to with a 3-21G basis set and then with a more accurate 6-31G basis set, this basis set uses more functions with which to build up the orbitals being approximated and so can be seen to be more accurate. We have also changed the method used and have now moved to using DFT, density functional theory, with the B3LYP method. This is again more advanced than Hartree Fock used before. This resulted in the following output:
| Ci Point Group Optimisation | |||
| |||
| Energy = -231.68029061 | |||
| |||
| |||
| Point Group = Ci | |||
| Energy = -234.61112035 | |||
What we notice immediately is the much lower energy of the result at this level of theory. This is a big reduction in energy and so is a significant factor. Overall we see this reduction in energy but no real noticeable change in the geometry or structure. We see identical bond lengths, angles and other parameters. This implies that the higher level optimisation has enabled us to better calculate the energy of the structure.
A further advancement to the calculations we have performed is to take into account the frequency and vibrations of the molecule. This is done by selecting 'Frequency' as the job type in GaussView. In doing this for the Ci point group we generate the below IR Spectrum:
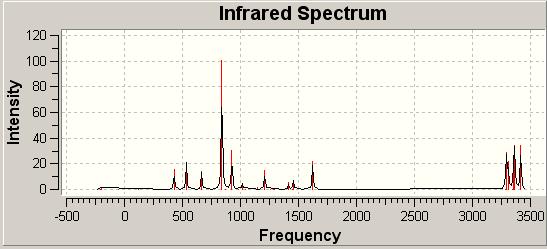
The crucial observation we make here is that we see no imaginary vibrations only real ones. The significance of this is that we can now infer that we have found a minimum energy structure, if we had found imaginary vibrations we would have been at a transition state structure.
Further to this we could look further into the file and do some analysis of the structure and its relative energy. In doing so we see the following lines:

We can tabulate these results and compare them to reference[2] data. This is done below:
| Comparison Of Thermochemistry Data | |||
| Quantity | Energy | Physical Meaning | |
| Sum of Electronic and Zero-Point Energies | -234.469339 | E = Eelec + ZPE | |
| Sum of Electronic and Thermal Energies | -234.463595 | E = E + Evib + Erot + Etrans | |
| Sum of Electronic and Thermal Enthalpies | -234.462651 | H = E + RT | |
| Sum of Electronic and Thermal Free Energies | -234.498545 | G = H - TS | |
We can compare these with the reference data and we find a both a good correlation and a good fit of the computational results with the literature, this leads us to have confidence in the value of the computational modelling we have done thus far.
From this we are now ready to begin to move forward and begin to model some transition state structures.
Optimising the Chair and Boat Structures
The techniques established from the tutorial section were then used to model the chair and boat transition state structures of the Cope Rearrangement. This was done by first drawing the allyl fragment CH2CHCH2 and optimising this with a HF approximation and a 3-21G basis set. This was the basis for the fragments which were then modelled as combining through both a chair and boat combination.
Chair Modelling
Firstly the chair transition state was guessed, this required the chair conformer to be drawn in GaussView. This was then optimised to the transition state by selecting this from the GaussView calculation menu. The initial optimisation failed, this was due to a poor guess of the structure and so the input structure was then redrawn more carefully to look as close as possible to the predicted transition state. We also gave an additional command in the keywords box by adding Opt=NoEigen. This was to circumvent the calculation crashing if we found more than one imaginary frequency during the optimisation.
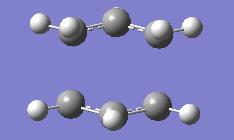
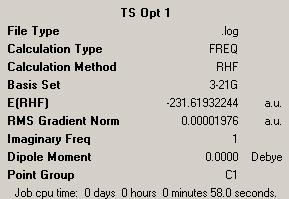
The results of all of this was the below structure with the given vibrations.
| Optimisation Of Transition State | |||
| |||
| |||
| Energy = -231.61932244 | |||
| Key Vibration = -817.995 | |||

| |||
The bond lengths for the bonds being made and broken can be found in looking at this optimised structure, in both cases they correspond to 2.02Å.
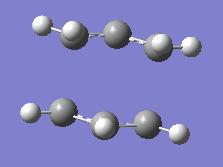
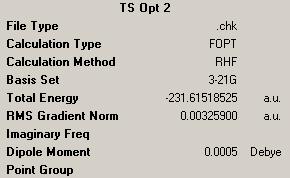
The chair transition structure was then optimised using a different technique which involved the freezing of the reactive bonds and atoms, known as the reaction coordinates, while minimising the rest of the molecule. This means the rest of the molecule will in theory be at its energy minima and will hopefully reduce the complexity of the calculation which needs to be performed which can save on both time and required computational power.
The minimised structure can then be optimised to a transition state structure as before however in this case we do not need to compute the force constants as we did in the original case.
For the minimisation we use a distance of 2.2Å. This is a value which is prevalent in literature as it brings the two carbon atoms together at a distance which allows maximum overlap of the orbitals and hence the most facile reaction.
| Minimisation of Frozen Structure | |||
| |||
| |||
| Energy = -231.61518525 | |||
We can then use GaussView to generate the required Gaussian input to minimise the structure to a transition state.
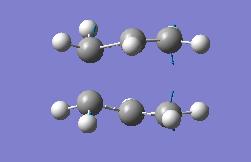
| Optimisation Of Transition State | |||

| |||

| |||
| Energy = -231.61932239 | |||
| Key Vibration = -817.759 | |||
| |||
We can again look at the transistion state interactively, this is the imaginary vibration. We find the motion to be very similar to the original model and with identical lengths of the bonds made and broken at 2.02Å.
Both of the optimisations give key vibrations at -818cm-1 which is in keeping with reference data for the transition which gives such a value.
Boat Optimisation
The boat transition structure was then tackled. This was done with a further method which was the QST2 study. In this the reactants and products are supplied to Gaussian and this optimises to generate the transition state between the two.
In this modelling it soon became very apparent that the numbering and geometry of the two structures needed to be accurate. In the first attempt at optimisation we were met with failure as the two structures were too far apart to generate an imaginary transition between the two.
As such we changed the bond angles in the starting material to be much closer to the product and also looked at the numbering of the two files by changing this in GaussView. When it was apparent that the two structures were numbered identically we were then able to move forward and begin the optimisation.
We proceeded with the optimisation by generating the required structures in GaussView and then selecting Job Type as Opt+Freq and choosing to optimise to a transition state. This gave us two options from which TS(QST2) was the chosen option and so we submitted the desired calculation.
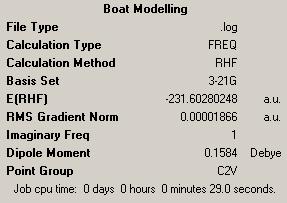
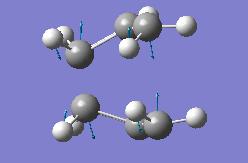
When the job finished we opened the results file and found the following data:
| Optimisation Of Transition State | |||

| |||
| |||
| Energy = -231.602820248 | |||
| Key Vibration = -839.91 | |||
| |||
Here we see the results for the boat optimisation. The imaginary value we generate for the key vibration is more negative than the previous value though is comparable in magnitude. We also notice that this structure is noticeably higher in energy. This is not wholly unexpected due to the widespread lack of stability in a boat structure.
Following The Reaction Path
Now we had seen the two relevent transition state it made sense to follow the path of the reaction. This is something which is possible in Gaussian where the Intrinsic Reaction Coordinate (IRC) allows us to see the pathway between a transition structure and product with minimum energy. This is done by moving between the two structures along a defined pathway of a series of points.
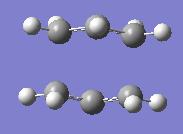
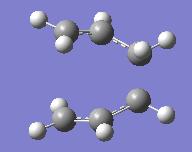
The number of points is a very important factor, if we have too many we waste time and efficieny as well as using excessive computational power. Worse still if we use too few points we never reach a minimum energy point which is a requirement to allow us to derive anything from the study. This was first done with 50 steps, with the results given below:
| Following the Reaction Path | |||
|
| ||
| Input Structure | Output Structure | ||

| |||
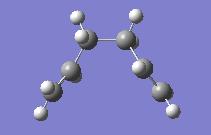
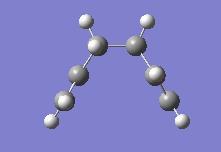
In looking at the output file we can see this has failed to reach a minimum. We have a number of options here. Firstly we can take the final point and optimise from here. This option was explored and resulted in the below details:
| Optimisation Of Transition State 2 | |||
| |||

| |||
| Energy = -230.17405957 | |||
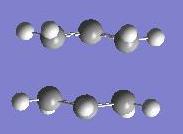
We find we do reach a minimum with this approach and so this is a valid option. A further and more accurate option would be to restart the calculation but with more points. This was also done with the number of points doubled to take into account 100 points.
Again results are tabulated:
| Following the Reaction Path 2 | |||
|
| ||
| Input Structure | Output Structure | ||

| |||
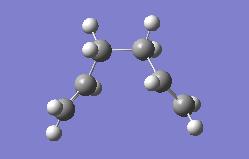
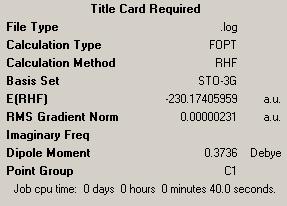
Immediately we see a much more likely minimised structure and so we are more happy with this result. We can now take this structure and optimise this to ensure that we have indeed culminated at the lowest energy structure:
| Optimising the IRC Minimum Energy Output | |||
| |||
| |||
| Energy = -230.17405959 | |||
In looking at this we see similar energies for both approaches to getting to the minimum with both having similar energies and crucially resulting in the desired structure.
Finding the Activation Energy
The final exercise was one of the most important, that of finding the actual activation energies and comparing them with references. This was key on two fronts, most basically to see whether, as we had thought we could, if we had shown the boat TS to be higher in energy. Additionally by comparison with experimental values we could see how well our modelled data matched actual experimental study. We again tabulate results to allow rapid and simple comparison to be made.
| Comparison of Activation Energies | ||||
| HF/3-21G
at 298.15 K |
B3LYP/6-31G*
at 298.15 K |
B3LYP/6-31G*
at 0 K |
Expt.
at 0 K | |
| ΔE (Chair) (kcal mol-1) | 45.31 | 33.27 | 31.94 | 33.5 ± 0.5 |
| ΔE (Boat)(kcal mol-1) | 55.67 | 41.58 | 42.01 | 44.7 ± 2.0 |
We see a very good fit between the reference data and the calculated data and so we are happy with the accuracy of the data as it has proven reproducible. This again gives support to our observations and explanations.
Additionally we now see hard evidence of the initial theory that the boat structure is higher in energy than the chair. This is due to the high energy steric interactions which occur in the boat conformer and the fact that these are reflected in the computational calculations indicates just how useful a tool computational studies can be.
Interestingly we see different values at 0K with an increase in the energy of the boat conformer at 0K while the chair energy decreases in energy. We see as such a larger energy difference between the two. This makes sense as at 0K we have no molecular motion and no averaging of any effects and so we see the two extremes of the structures and so the effects which give them different values are more prominant.
Diels-Alder Cycloaddition
The most basic Diels-Alder reaction imaginable is the [4s + 2s] cycloaddition of cis butadiene and ethylene. The basic mechanism is given below:

This study is designed to investigate a number of aspects about Diels Alder reactions. Namely we will begin to investigate the orbital interactions; these are proposed to be two pairs of HOMO and LUMO orbitals overlapping. We will then continue and model the transition state of the molecule and then MOs of the transition state. Finally we will look into the regioselectivity of the reaction and see which of the endo or exo isomers of a particular reaction are favoured.
Looking at the Orbital Interactions
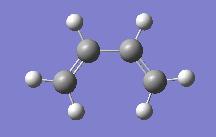
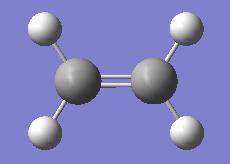
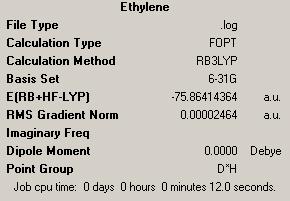
It is the intention to model this computationally to study the orbital interactions in more detail. The initial step in this was to optimise both of the reactant molecules, the summary of this is tabulated below. In each and every case in investigating the Diels Alder reaction we began with an AM1 method, this was very useful as it gave fairly accurate results very quickly. We also then moved on to using B3LYP methods with a 6-31G basis set to get more accurate optimisations:
| Optimising the Cycloaddition Reactants | |||
| cis-Butadiene | |||
|

| ||
| Ethylene | |||
|
| ||
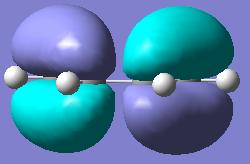
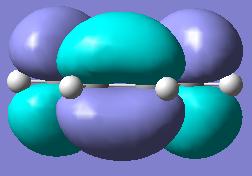
We could then look at the molecular orbitals of the two molecules involved to gain insight into the key interactions and overlaps which allow reaction to proceed.
| cis-Butadiene Molecular Orbitals | |||
|
| ||
| HOMO | LUMO | ||
| Plane Reflection: Antisymmetric | Plane Reflection: Symmetric | ||
| Axis Rotation: Symmetric | Axis Rotation: Antisymmetric | ||
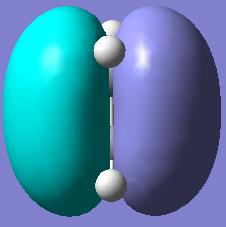
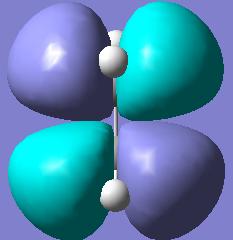
Likewise we could use Gaussview to plot the Molecular orbitals of ethylene pictorially.
| Ethylene Molecular Orbitals | |||
|
| ||
| HOMO | LUMO | ||
| Plane Reflection: Antisymmetric | Plane Reflection: Antisymmetric | ||
| Axis Rotation: Antisymmetric | Axis Rotation: Antisymmetric | ||
It is well defined that the principal orbital interactions are those of the HOMO-LUMO pairs which overlap with each other to form the new bonds in the product.
Previous studies have shown results for the orbitals which agree with those which we observe for our computational study and so we can link the results obtained with previous experimental results to support the conclusions we draw. As we see the HOMO and LUMO pairs will overlap favourably we can see how they will react.
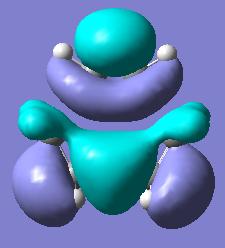
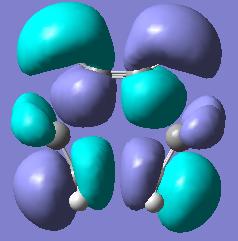
We can furthermore look into the HOMO and LUMO of the transition state.
| Transition State Molecular Orbitals | |||
|
| ||
| HOMO | LUMO | ||
In this we see that the HOMO seems to resemble the overlap of the ethylene HOMO with the cis-butadiene LUMO while the LUMO transition state MO resembles the overlap of the LUMO of ethylene with the HOMO of cis butadiene.
Modelling the Transition State
It was also possible to take this further and model the transition state of the Diels Alder reaction. In the previous exercies we had used 3 different methods of optimisation to model a transition state. As such we needed to make a decision as to which one to use for this purpose. QST2 modelling had been very accurate and so would be a good technique to use for this modelling however in view of the fact that these calculations took a long time to carry out and required a large amount of accuracy in the numbering of atoms and the proximity of the starting structure to the product it was decided not to proceed with this. Instead of this we used the earlier method of the redundant atom coordinates to freeze the reaction centre and optimise the rest of the molecule first. This was chosen due to its reputation of being able to generate better transition state structures.
In order to employ this technique we again began with an AM1 method to quickly optimise the structures. We then followed the same process as before to first freeze the bonds formed and then optimise to a minimum. These optimised structures were then used as the input for the formation of the transition state structure made by forming bond derivatives.
The guess structure again involved a chosen distance between reactant parts of the molecule as 2.2Å due to its widespread use in other studies.
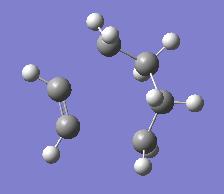
| Optimising Diels Alder to a Minimum | |||
| |||
| Energy = -231.48586105 | |||
These minimised structure looks similar to the transition state expected with the ethylene molecule lining up with the cis butadiene. As we had previously we now took the minimised structure and optimised the reaction centre to the transition state.
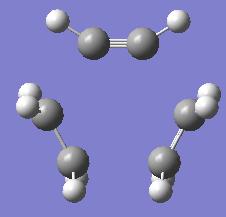
| Optimising the Diels Alder Transition State | |||
| |||
| |||
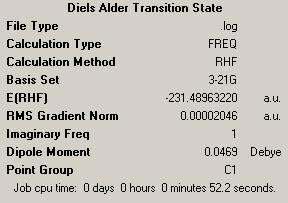
| Energy = -231.48963220 | |||
| Key Vibration = -1067.23 | |||

| |||
The first thing we notice is the imaginary frequency which is good news as we see this means we have indeed modelled a transition state structure.
We can investigate further as we have done before into the specific molecular orbitals of the molecule. This is done as has been done before by adding pop=full to the additional keywords in the calculation. We generate the below molecular orbitals for the molecule:
| Transition State Molecular Orbitals | |||

|

| ||
| HOMO | LUMO | ||
| Plane Reflection: Symmetric | Plane Reflection: Antisymmetric | ||
We can look further into the structure and see the variety of C-C bond lengths displayed by the molecule as we move between the different hybridisations of the carbon atoms through the reaction. We see partly formed C-C bonds in the transition state with a value of 2.14Å as well as the C=C bonds which are 1.36Å in length. The geometry and these relevent bond lengths are given pictorially below:
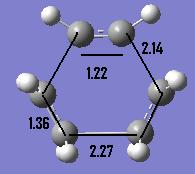
We can compare these bonds lengths with literature[3] values to suggest what types of bonds we have in our transition state. A typical C=C is approximately 1.34Å while a single bond is generally around 1.53Å. Hence the partly formed bonds are a fair way from the single bond we see in the product. The van der Waals radius of Carbon is 1.7Å[4] and so we can see that the two atomic radii have good overlap in the transition state and this orbital interaction is why we see a smaller distance between the two than expected.
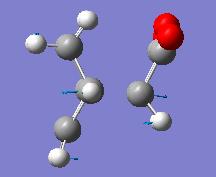
We can further look at the imaginary vibration which corresponds to the reaction pathway. This has a completely synchronous formation of the two bonds and all parts of the molecule move at exactly the same time and same rate in the same direction. This is in contrast to the lowest positive frequency in which the moecules wags with the two sides of the molecule moving in directly opposite fashions.
In looking again at the HOMO we can see this corresponds to the interaction of the ethylene HOMO with the butadiene LUMO both of which are symmetric with repect to the plane. As the symmetries are complementary this means that overlap is allowed and so the reaction can proceed. A direct effect of this is that the resultant orbital formed has the same symmetry as the two orbitals which were used to make it up from and so the HOMO is symmetric in the plane in question.
Selection rules relating to the pericyclic reactions can be used to explain why reaction proceeds in this sense and so favourably. The reaction involved 6 electrons, which is equivalent to 4n + 2 where n = 1 and so follows a Huckel Transition state under thermal conditions. As the orbital overlap involved is complementary we see only suprafacial components and no antarafacial components, this is again consistent with the complementary overlap of the two HOMO-LUMO pairs of orbitals. We can see these suprafacial components by inspection of the MOs which are used as they have identical phases and so can overlap well.
Investigating the Regioselectivity
In order to model the regioselectivity of the Diels Alder reaction a specific reaction was chosen, this was the reaction betweeen Cyclohexa-1,3-diene and maleic anhydride which is again a [4n + 2] cycloaddition. This is well regarded to follow kinetic control and so give primarily the endo adduct as the kinetic product. This should be reflected in the energy of the transition states of the two pathways where the endo transition state should be lower in energy.
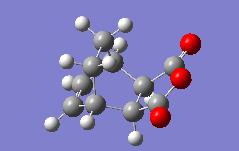
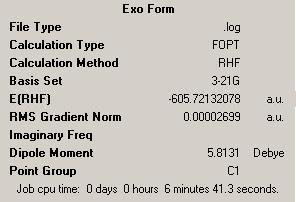
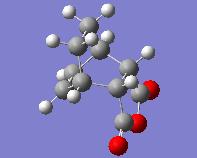
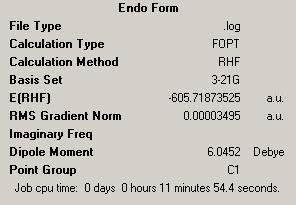
To begin with we modelled the two different isomers to gain an appreciation of the two different isomers and their relative energies:
| Comparing the Exo and Endo Forms | |||
| Exo | |||
|
| ||
| Energy = -605.72132078 | |||
| Endo | |||
|
| ||
| Energy = -605.71873525 | |||
These results give a observation which from first principles would be unexpected. It is widely accepted that this reaction gives the endo product however when we look at the relative energies of the two forms we see the exo form is in fact almost 7kJ mol-1 more stable than the endo form. From this we must conclude that this reaction is under kinetic control. This has direct effects on our study of transition state structures as the kinetic product is that which is formed by the lowest energy. From this we would expect that the endo transition state will be more stable than that for the endo structure.
We can look into the transition states of the two conformers to see which is in fact lower energy. This is done in a similar way to that done before by using the frozen coordinate method. As before we created the two different isomers and first froze the bonds while optimising. The checkpoint files were then opened and the Redundant Coodinate Editor was used to create coordinates at the two bonds made in the reaction to form bond derivatives. We as before began with a 2.2Å distance between the two fragments in the transition state as this had proved sucessful in previous C-C bond forming transition states.
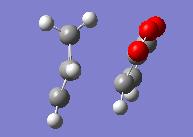
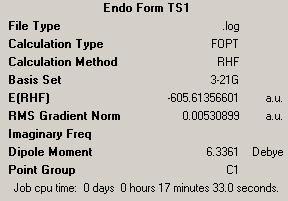
We then ran an optimisation to the transition state with frequency analysis. The results for this process are given below:
| Freezing Bonds Formed | |||
| Endo | Exo | ||

|
| ||
|

| ||
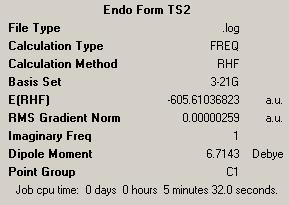
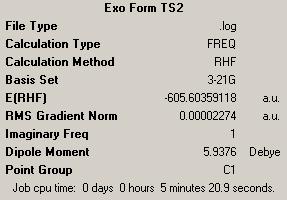
| Energy = -605.61356601 | Energy = -605.60738669 | ||
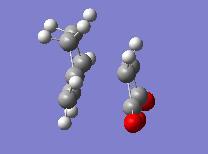
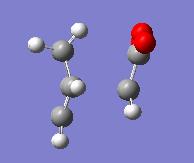
We see here after the initial optimisation a lower energy for the endo transition state. As we had in previous optmisations we now took the minimised molecule and modelled the transition state of the reaction by forming bond derivatives.
| Forming Bond Derivatives | |||
| Endo | Exo | ||
|
| ||
|
| ||
| Energy = -605.61036823 | Energy = -605.60359118 | ||
| Key Vibration = -643.451 | Key Vibration = -647.765 | ||

|
| ||
Here we see that the endo form has a lower energy transition state and so we can now rationalise why we see the endo product instead of the lower energy exo product.
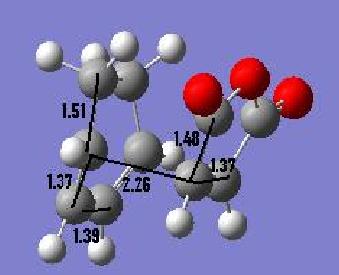
We can look at the output files and measure the various C-C bond lengths including the partly formed C-C bonds. These are shown below:
| Endo | Exo |

|
|
Here we can examine the two various sets of bonds lengths to establish some theory regarding the hybridisations observed as well as the relative distribution of electron density. When we look at the different bond lengths of the two isomers the only length which differs is in fact the length of the partially formed C-C bonds, these are closer in the endo form, which we know is preferentially formed.
A shorter bond length does imply more overlap of orbitals and so this suggests we see more overlap in the endo form. As the better the overlap is, the more facile the reaction we see. Crucially both of the partially formed bond lengths fall into the values required for overlap of the two van der Waals radii.
Looking in more detail at the bond lengths themselves we can see details of the relative hybridisations. As before we know a double bond is around 1.34Å while a single bond is approximately 1.53Å. As we see all of the reactive bonds at 1.37Å these are slightly weaker than a normal double bond, this is reflective of the fact that the orbitals are not entirely sp2 hybridised in this final structure as we see donation of the electron density into the newly formed bonds.
Additionally we see some slight reduction in the single bonds, this implies a small amount of sp2 character in these bonds in the transition state. The final bond of interest is the bond which becomes the double bond in the product. This is also close to double bond character but does have some sp3 character remaining.
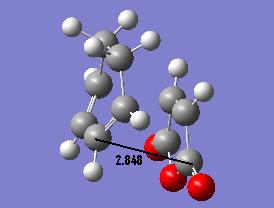
We could also look at the relative orientation of the two transition states to see the steric interactions which are of concern. The transition state is formulated of a compromise between the reduction of such steric interactions and the favourable interactions of orbitals. To do this we can consider the main steric clash that of the central fragment of the maleic anhydride (the C=O-CO-C=O linkage) and the CH groups opposite (CH2-CH2 in exo and CH=CH in endo). The secondary orbital interaction which is key is the favourable interaction of the π system in CH=CH system and the maleic anhydride group.
| Endo | Exo |
|

|
Here we see a shorter distance in the endo group than in the exo group. This is due to the secondary orbital interaction between the maleic anhydride group and the C=C bonds which is a stabilising effect. This brings the two reacting groups closer together which gives better overlap and so a better reaction. The exo isomer has a longer through space interaction, this is due to the steric repulsion of the maleic anhydride group and the CH2-CH2 group, this is not countered by any orbital interactions such as the secondary orbital interactions seen in the endo form so this has an overall repulsive effect bringing the groups further apart.
As such we can suugest why we see a shorter distance for the endo form is due to the presence of a attractive interaction between the secondary orbitals which brings the reactive centres closer and so increases the rate of reaction by decreasing the energy of the transition state structure.
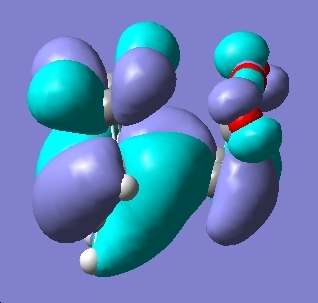
The logical next step was to look at the molecular orbitals of the transition states to investigate if these could give us any useful information rationalising the reactivity we see.
| Endo | Exo |

|
|
Here we see the orbitals are in fact very similar and at first glance we see very little difference which could explain this reactivity. However with a small amount of manipulation we can see some secondary orbital interactions as well as a reduction in the number of nodes in the file. The secondary orbital interaction is between the maleic anhydride group and the pi orbitals in the endo form. We can see these below:
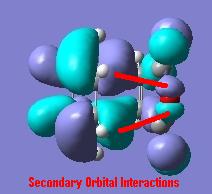
All in all we can see this very favourable orbital overlap exists in the endo system and this can go some way to explaining the favourability of its formation. A further avenue we can explore is that of the actual structures and the strains involved in each.
We can look at the relative energies of the systems and see that the exo transition structure is 0.0067 Hartree higher in energy, this is equivalent to nearly 18kJ mol-1 and so we can see now why this is formed preferentially.
The strain in the exo group centred around the carbon atoms is an interesting factor to consider. This is a major factor when we consider the hybridisation of the groups as the strain of the sp3 centres will be much higher than the strain in the sp2 centres which are found in the endo form. This simple difference in hybridisation can go some way to explaining why we see higher strain for the exo.
Summary of Reasons for Endo Formation
To summarise the study we can see from our computational study that endo formation prevails in this reaction. This is a kinetically controlled process and so the endo form has a lower energy transition state. This has been shown as to be due to a number of factors, including a decreased amount of strain, better orbital overlap and secondary orbital interactions.
Conclusions
From the computational study we have seen that it is possible to model transition states and from these models to find the key orbital interactions and overlaps as well as finding the important effects which give the shown reactivity.
As such this is a valuable tool in finding and rationalising reactivity in a huge range of chemical systems!
References
Mja06 15:15, 27 February 2009 (UTC)
