Rep:Mod:Ginger2
BH3
Optimisation

A molecule of BH3 was made in GaussView 5. This formed a planar molecule with H-B-H bond angles of 120o and a B-H bond length of 1.18Å, this was adjusted to 1.5Å. This was then optimised using Gaussian with the B3LYP method and the 3-21G basis set where the method is the type of approximation used to solve the Schrodinger equation and the basis set determining the accuracy.
After the optimisation the results are as follows:

| B-H Bond Length | 1.19Å |
| H-B-H Bond Angle | 120o |
| Calculation Type | FOPT |
| Calculation Method | RB3LYP |
| Basis Set | 3-21G |
| Charge | 0 |
| Spin | Singlet |
| E(RB3LYP) | -26.462 a.u. |
| RMS Gradient Norm | 0.00030672 a.u. |
| Dipole Moment | 0.00 Debye |
| Point Group | D3H |
| Time | 17s |
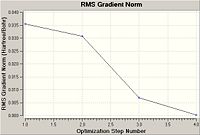
As can be seen the gradient is 0.00030672 a.u. which is lower than 0.001 therefore showing that the optimisation is complete. Also when the final set of forces and displacements are viewed they have all converged showing again that the optimisation is complete. The graph shows that Gaussian goes through many steps minimising the energy at each step finally resulting in a lowest energy, however the more steps involved in the calculation the more accurate the optimisation. The total energy graph shows that as the program performs more iterations the energy decreases to a final minima at optimisation step number 4, the RMS Gradient Norm graph also decreases as it is the root mean square of the gradient and as the gradient decreases to zero as we approach the minima.
MO Analysis
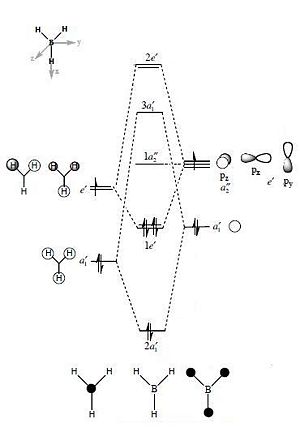
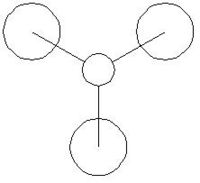
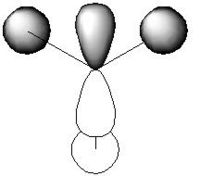
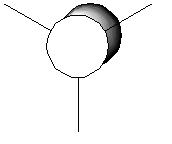
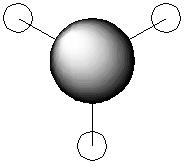
For the BH3 MO analysis the method set was energy instead of optimisation with DFT selcted and the 6-31G basis set. A MO diagram of BH3 for the valence electrons is shown to the right. A comparison of the MOs and LCAOs respresentation is shown below, only the valence orbitals were shown to simplify the image.
| Orbital | Molecular Orbital | LCAO Representation |
|---|---|---|
| 2a1' | 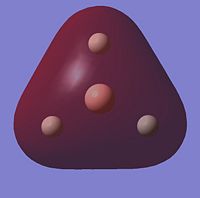 |
|
| 1e' | 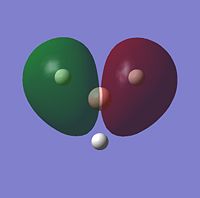 |

|
| 1e' |  |
|
| 1a2" |  |
|
| 3a1' | 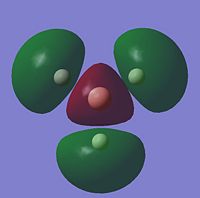 |
|
| 2e' | 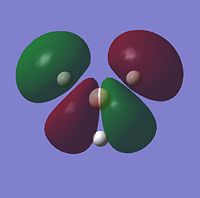 |

|
| 2e' |  |

|
Comparing the computational molecular orbital diagrams and the LCAO molecular orbital representations you can see that in all cases they are in very good agreement and there are no significant differences between the two. This therefore indicates that qualitative MO theory is accurate and is therefore very useful as a tool for general analysis.
NBO Analysis
The .log file from the population analysis was loaded and the results analysed.
 |
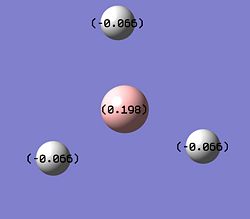 |
After inspection of the NBO colour analysis it can be seen that the central boron atom is green (positive) and that the 3 hydrogens are red (negative), this is to be expected as Boron is an electron deficient atom and therefore is positively charged. When the NBO number analysis is viewed it can be seen that all the hydrogens are in identical positions with the same slight negative charge (-0.066) and a positively charged boron (0.198).
     (Occupancy)   Bond orbital/ Coefficients/ Hybrids
---------------------------------------------------------------------------------
    1. (1.98096) BD ( 1) B   1 - H   2
               ( 46.65%)   0.6830* B   1 s( 33.33%)p 2.00( 66.67%)
                                           0.0000  0.5774  0.0000  0.0000  0.0000
                                           0.8165  0.0000  0.0000  0.0000
               ( 53.35%)   0.7304* H   2 s(100.00%)
                                           1.0000  0.0005
    2. (1.98096) BD ( 1) B   1 - H   3
               ( 46.65%)   0.6830* B   1 s( 33.33%)p 2.00( 66.67%)
                                           0.0000  0.5774  0.0000  0.7071  0.0000
                                          -0.4082  0.0000  0.0000  0.0000
               ( 53.35%)   0.7304* H   3 s(100.00%)
                                           1.0000  0.0005
    3. (1.98096) BD ( 1) B   1 - H   4
               ( 46.65%)   0.6830* B   1 s( 33.33%)p 2.00( 66.67%)
                                           0.0000  0.5774  0.0000 -0.7071  0.0000
                                          -0.4082  0.0000  0.0000  0.0000
               ( 53.35%)   0.7304* H   4 s(100.00%)
                                           1.0000  0.0005
    4. (1.99962) CR ( 1) B   1           s(100.00%)
                                           1.0000  0.0000  0.0000  0.0000  0.0000
                                           0.0000  0.0000  0.0000  0.0000
    5. (0.00000) LP*( 1) B   1           s(100.00%)
From the data above it can be seen that the H-B bonds must be sp2 hybridised as the s orbital and p orbitals contribution on the boron and hydrogen is 33% and 66% respectively therefore the ratio of contribution s:p is 1:2 which therefore indicates sp2 hybridisation. The hydrogens however are 100% s-orbital due to their nature of only have one electron in the s orbital and the boron has a lone pair in a s-orbital.
Vibrational Analysis
Vibrational analysis was carried out using the same method and basis set as in the optimisation and as can be seen from the summary tables the energies are the same indicating that the structure is unchanged from the earlier optimisation. The IR spectrum is shown to the right.

| B-H Bond Length | 1.19Å |
| H-B-H Bond Angle | 120o |
| Calculation Type | FREQ |
| Calculation Method | RB3LYP |
| Basis Set | 3-21G |
| Charge | 0 |
| Spin | Singlet |
| E(RB3LYP) | -26.462 a.u. |
| RMS Gradient Norm | 0.00020662 a.u. |
| Dipole Moment | 0.00 Debye |
| Point Group | D3H |
| Time | 11s |
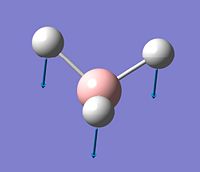
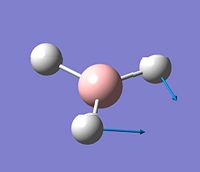
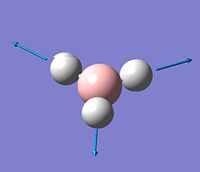
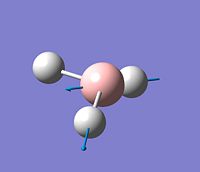
The vibration analysis is shown in the table below:
The IR spectrum only has 3 peaks instead of 6 as two of the vibrations are degenerate and so have the same energy so appear as only one peak but with a much larger intensity, another two of the vibrations are also degenerate and so have the same energy so again appear as only one peak but again with a much higher intensity and one of the vibrations (2598cm-1) has no overall net dipole moment and therefore it is not present in an IR spectrum as it is not active.
Data
BH3 Optimisation: https://www.ch.ic.ac.uk/wiki/index.php/Image:BH3_OPTIMISATION_INPUT_FILE.LOG
BH3 MO Analysis: https://www.ch.ic.ac.uk/wiki/index.php/Image:JONATHAN_BH3_OPTMO.LOG
BH3 Vibrational Analysis: https://www.ch.ic.ac.uk/wiki/index.php/Image:Copy_of_JONATHAN_BH3_FREQINPUTFILE%28NOTNEEDED%29.LOG
BCl3
Optimisation
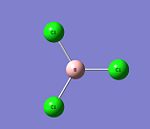
A molecule of BCl3 was made in GaussView 5. This formed a planar molecule with Cl-B-Cl bond angles of 120o and a B-Cl bond length of 1.87Å. This was then optimised using Gaussian with the B3LYP calculation method and the 3-21G basis set. This gave a bond length of 1.87Å which can be compared to the literature value of 1.74Å[1] and a Cl-B-Cl bond angle of 120o which can again be compared to the literature value of 120o[2]. It can therefore be seen that the bond angles agree however the bond lengths do not agree, with a more accurate basis set and more complex method a more accurate value for the bond length could well be achieved.
After the optimisation the results are as follows:
| B-Cl Bond Length | 1.87Å |
| Cl-B-Cl Bond Angle | 120o |
| Calculation Type | FOPT |
| Calculation Method | RB3LYP |
| Basis Set | LANL2MB |
| Charge | 0 |
| Spin | Singlet |
| E(RB3LYP) | -69.439 a.u. |
| RMS Gradient Norm | 0.00005905 a.u. |
| Dipole Moment | 0.00 Debye |
| Point Group | D3H |
| Time | 13s |
Vibrational Analysis
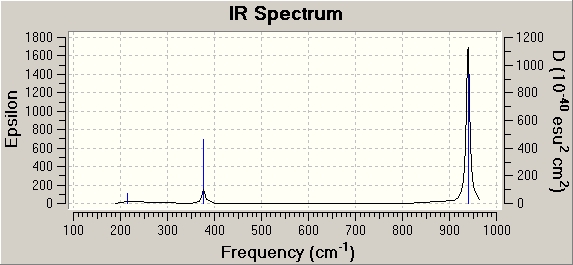
Vibrational analysis was carried out using the same method and basis set as in the optimisation and as can be seen from the summary tables the energies are the same indicating that the structures are unchanged from the earlier optimisation. The literature B-Cl bond length is The IR spectrum is shown to the right.
| B-Cl Bond Length | 1.87Å |
| Cl-B-Cl Bond Angle | 120o |
| Calculation Type | FREQ |
| Calculation Method | RB3LYP |
| Basis Set | LANL2MB |
| Charge | 0 |
| Spin | Singlet |
| E(RB3LYP) | -69.439 a.u. |
| RMS Gradient Norm | 0.00005910 a.u. |
| Dipole Moment | 0.00 Debye |
| Point Group | D3H |
| Time | 12s |
The same basis set and method was used for both the optimisation and vibrational analysis; this is because the same basis set and method must be used to have comparable results as a difference in basis sets and methods would lead to different values being produced, as the different methods would calculate values in different ways producing different results and the different basis sets would lead to different accuracies and results again giving different results.
The reason for doing the frequency analysis here is because it ensures that the structure obtained from the optimisation is a minima and is not a different geometry. In order to tell if it is a minima you have to look at the frequency as if the frequency is positive it means that the results are minima as frequency is the second derivative of the potential energy surface and a negative frequency would results in a maxima indicating that the structure has a local minima or a transition point.
Gaussview does not always show all bonds expected in a molecule but that does not mean there is no bond, it means that the bond simply exceeds the pre-defined bond distance value present in Gaussview as bonds are based on a distance critera in Gaussview. This leads to a interesting question of what is a bond. A bond is an interaction between atoms that leads to the formation of compounds and molecules. When looking at it in more detail there are two ways to look at a bond with VSEPR and with MO theory. VSEPR theory just looks at valence electrons and in this view a bond is simply interaction between two electrons. However MO theory looks at electrons in orbitals and therefore a bond in this case is interactions between orbitals of electron density causing a region of electron density in between to two positively charged nuclei causing a bond to occur due to the attraction between the positive nuclei and negative region of electron density.
The symmetry of BCl3 is D3h, this is also the symmetry given by Gaussview. This therefore indicates that Gaussview is a very exact program with respect to geometry, it also shows however that Gaussview can be constrained to an intial geometry and vary the molecule based on this geometry and not change it to another shape and therefore energy.
The vibration analysis is shown in the table below:
| Mode no. | Form of the vibration | Frequency | Intensity |
|---|---|---|---|
| 1 | 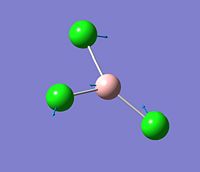 |
214 | 4 |
| 2 | 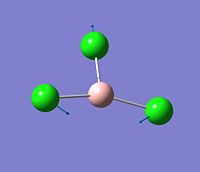 |
214 | 4 |
| 3 | 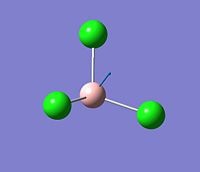 |
377 | 44 |
| 4 | 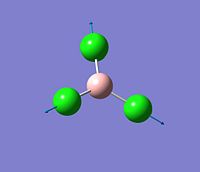 |
417 | 0 |
| 5 | 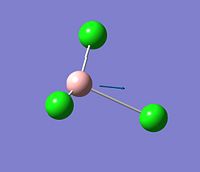 |
939 | 259 |
| 6 |  |
939 | 259 |
The IR spectrum only has 3 peaks instead of 6 as two of the vibrations are degenarate and so have the same energy so only appear as one peak with a much larger intensity, another two of the vibrations are also degenarate and so have the same energy so only appear as one peak and again have a much higher intensity and one of the vibrations (417cm-1) has no overall net dipole moment and therefore it is not present in an IR spectrum.
Data
BCl3 Optimisation: https://www.ch.ic.ac.uk/wiki/index.php/Image:JONATHAN_BCL3_OPTIMISATION.LOG
BCl3 Vibrational Analysis: https://www.ch.ic.ac.uk/wiki/index.php/Image:JONATHAN_BCL3_FREQ1.LOG
Isomers of Mo(CO)4L2
In this section I will be modelling Mo(CO)4PPh3 from the second year inorganic lab course and anlayse the results from vibrational analysis and the different vibrational bands present as four carbonyl absorption bands are expected from the cis isomer and only one from the trans ligand. Mo(CO)4PPh3 is a large molecule and requires large computing resources, it is therefore possible to make it less demanding by replacing the Ph3 group with a Cl.
Optimisation
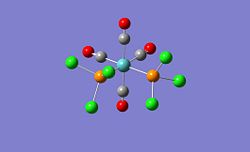
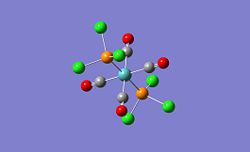
The cis[3] and trans[4] isomers were inital optimised using the B3LYP method and the low level basis set LANL2MB, this gives an approximate geometry with reasonable bond lengths and bond angles, however the dihedral angles are not well predicted and so another optimisation was carried out after altering the torsion angles of PCl3 as instructed by Patricia Hunt. The second optimisation with new geometry was carried out again using the B3LYP method and the LANL2DZ basis set which is a more accurate basis set and also increasing the electronic convergence by adding additional key words. The structures and data for the cis[5] and trans[6] isomers are shown below.
When the two isomers are viewed it can be seen that the trans isomer forms a eclipsed structure with respect to the PCl3 whereas with the cis isomer the two PCl3 groups form anti-parallel groups in order to minimise steric interactions to achieve the lowest energy. This an energy of -1637201 kJ/mol for the cis isomer and -1637199 kJ/mol for the trans isomer, this would indicate that the cis isomer is the more stable one out of the two due to the lower energy however the accuracy is only 10 kJ/mol so therefore this could be incorrect. This is correct for Mo(CO)4Cl2 however for Mo(CO)4(PPh3)2, which is what we are actually attempting to model using Cl as a replacement for PPh3 this is incorrect and the trans isomer is actually the more stable isomer[7]. This is because the large PPh3 groups cause much larger steric clashes between the ligands than when Cl is used especially for the cis isomer, this causes the cis isomer to be higher in energy than the trans and therefore the trans is now the more stable isomer of the two. Both isomers however are at similar energies with a difference of ≈3 kJ/mol, when this is compared to the energy at room temperature RT = 2.5 kJ/mol it indicates that conversion between the two isomers will most likely occur at room temperature especially as the accuracy is only 10 kJ/mol so therefore the energy difference could be lower and therefore interconversion would definetly occur.
From my comments above it can be concluded that to change the cis and trans relative ordering is a simple process and that for the cis isomer to be more stable we simply have to use a small ligand so steric clashes and interactions do not occur and to make the trans isomer more stable use large ligands that cause a large amount of steric clash and hinderance making the cis isomer higher in energy so the trans is now more favourable. There is however another way to alter the relative ordering of the cis and trans isomers, this is by changing the ligand for an electron rich group. The electron rich group will donate some of its electron density onto the metal centre which then means that there will be more back bonding character in the bond with the C=O. This extra back bonding character causes the cis conformer to be favoured as the back bonding causes the bond to weeaken and so the orbitals are more diffuse and cis is favoured. There is only a certain amount of back bonding that can occur. Thus it is best to use a mixture of steric and electronic effects to favour either the cis or trans conformer.
| Bond / Å | Calculated Cis Isomer | Literature Cis Isomer[8] | Calculated Trans Isomer | Literature Trans Isomer[9] |
| Mo-C | 2.01/2.06 | 1.97/2.02/2.06 | 2.06 | 2.01/2.02 |
| C-O | 1.17/1.18 | 1.16/1.15/1.14 | 1.17 | 1.16 |
| Mo-P | 2.51 | 2.57 | 2.44 | 2.50 |
| Angle | ||||
| P-Mo-P | 94.2o | 104.6o | 180.0o | 180.0o |
The reason for mulitple numbers in the table for one bond is due to the bond lengths being different due to the particular positioning of that bond in the molecule. When the computed values for Mo-C and C-O are compared with the literature values they are in good agreement as can be seen in the table above. However the Mo-P bond different while it is still in reasonable agreement to the literature values differs due to the fact that the literature has Ph groups attached whereas the computed values have Cl group attached and this therefore leads to the Mo-P bond being longer for the literature values. The bond angles for the trans are in very good agreement however the cis isomer values differ by a substantile amount due to the different in the sizes of the groups used in the computational and literature methods therefore causing differing amount of sterics interactions.
Vibrational Analysis
The cis[10] and trans[11] isomers vibrational analysis is seen below.
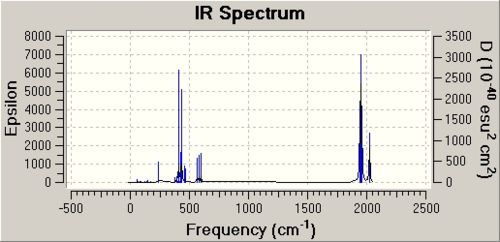 |
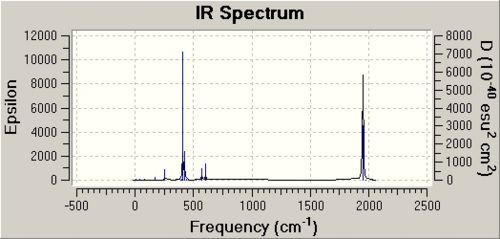 |
Low Frequency Vibrations
Illustrated below are two low frequencies for each of the isomers. The low frequency vibrations must occur at low temperature due to the two equations E=hf and E=RT which can combine to from RT=hf which illustrates what I mentioned earlier. Therefore as the energy of room temperature ≈2.5 kJ/mol the atoms will be vibrating quickly and thus higher vibrational energy levels can be accessed and the ground state of said molecule will be empty and therefore these vibrations are not visible due to the low intensity that results from this.
| Cis Isomer | Trans Isomer | |||||||
|---|---|---|---|---|---|---|---|---|
| Mode no. | Form of the vibration | Frequency | Intensity | Mode no. | Form of the vibration | Frequency | Intensity | |
| 1 | 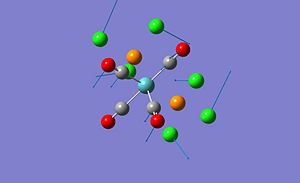 |
11 | 0 | 1 |  |
5 | 0 | |
| 2 | 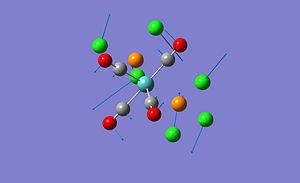 |
18 | 0 | 2 | 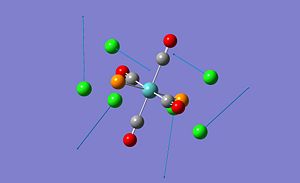 |
6 | 0 |
Carbonyl Analysis
The vibrational analysis for CO stretches is shown below and compared with literature.[12]
| Cis Isomer | ||||
|---|---|---|---|---|
| Mode no. | Lit. Frequency | Frequency | Intensity | Symmetry |
| 42 | 1986 | 1945 | 763 | B2 |
| 43 | 1994 | 1948 | 1498 | B1 |
| 44 | 2004 | 1958 | 633 | A1 |
| 45 | 2072 | 2023 | 598 | A1 |
When the literature and calulated frequencies are compared it can be seen that they are in a similar region but that the individual peaks do not agree. The cis isomer has four peaks as predicted from the symmetry which agrees with the literature.
| Trans Isomer | ||||
|---|---|---|---|---|
| Mode no. | Lit. Frequency | Frequency | Intensity | Symmetry |
| 42 | 1896 | 1950 | 1475 | Eu |
| 43 | 1896 | 1951 | 1467 | Eu |
| 44 | 1977 | 0 | B1g | |
| 45 | 2031 | 4 | A1g |
When the literature and calulated frequencies are compared it can be seen that they are in a similar region but that the individual peaks do not agree. Although there are 4 peaks predicted by symmetry 2 of them are degenerate and so form one peak in the literature spectra and 2 peaks have a very low intensity and so are not visible in literature spectra as they are not active in IR. Therefore only one peak is present out of the four predicted by symmetry.
Mini Project: Hydrogen: Fuel of the future
As a fuel of the future there is much research into hydrogen and the associated problems with developing it as use as a fuel; one of the problems with hydrogen is the storage of hydrogen and solid matrixes have been suggested as way to store hydrogen as it does not require high pressure and there is an improvement in safety. Ammonia borane has been suggested as a solid matrix for hydrogen storage due to its high hydrogen content and the fact that it is a stable solid at room temperature. The reaction that occurs to release the hydrogen is shown below and involves the formation of borazine as a byproduct.
| NH3BH3 -> B3N3H6 + H2 |
Ammonia Borane structure
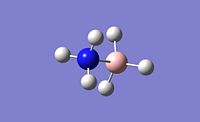
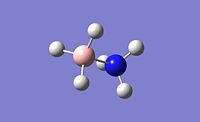
The ammonia borane structure was compared with its organic analogue (ethane); therefore an inital optimisation was carried out using the B3LYP method and the 3-21G basis set and then a further optimisaiton was carried out using the more accurate LANL2DZ. The data for the optimisation of ammonia borane (staggered[13] and eclipsed[14]) and ethane ( staggered[15] and eclipsed[16]) can be seen below. Frequency analysis was then carried out to ensure that the structures formed by optimisation are the minimum and the data obtained was positive therefore showing that these structures are indeed the minimum. (Vibrational Data for staggered ammonia borane[17], eclipsed ammonia borane[18], staggered ethane[19] and eclipsed ethane[20]).

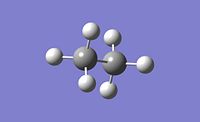
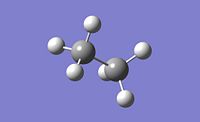
As can be seen from the data in the table above for both ammonia borane and ethane the staggered structure is the more stable structure when compared with the eclipsed structure with an energy difference of 8 kJ/mol for ammonia borane and 10 kJ/mol for ethane. This is expected as there is steric hinderance between the hydrogens when in the eclipsed formation whereas in the staggered formation this steric hinderance is minimised as seen in the image to the right. The ethane conformers are higher in energy than the ammonia borane conformers due to the bond lengths of the conformers with the ammonia borane bond lengths longer than the ethane meaning that the carbons in the ethane are closer and therefore the hydrogens are closer and so there is more steric hinderance leading to higher energies for the ethane conformers (ammonia borane eclipsed confomer 1.71Å and staggered conformer 1.68Å and with ethane eclipsed conformer 1.56Å and staggered conformer 1.54Å). This therefore also means that the energy difference is larger for the ethane conformers as the hydrogens are closer than when compared with the ammonia borane conformers as in ethane the eclipsed conformer is much higher in than the staggered conformer when compared to the difference with the ammonia borane conformers.
Bonding
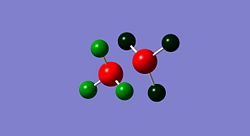
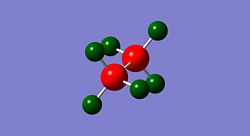
The bonding type and strength of the bonding can be observed by looking at the bond length, by performing NBO analysis and looking at the dipole moment. The bond length of B-N in ammonia borane is 1.68Å and the dipole moment is 5.70 Debye whereas the bond length of C-C in ethane is 1.54Å and the dipole moment is 0.00 Debye. The charge on the atoms can be viewed below from NBO analysis[21][22] and therefore the origins of the dipole moment and as a larger dipole moment tends to result in a weaker bond and ammonia borane has a much larger dipole moment. This therefore indicates that the N-B bond is weaker than the C-C bond and therefore has a longer bond length and is more reactive. This dipole moment destabilises the molecule and so ammonia borane is better than ethane for releasing H2.
Red-Black-Green = Negative-Uncharged-Positive
 |
 |
 |
 |
From the log file from the NBO analysis it can be seen that in the C-C bond each carbons contributes 50% to the bond however in the B-N bond the boron contributes 17.75% and the nitrogen contributes 82.25%, this indicates that the lone pair on the nitrogen contributes most to the bond.
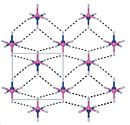
Despite the fact ammonia borane is isoelectric with ethane they have very different melting points with ethane at a very low melting point and ammonia borane at around 110oC. This is because in ammonia borane the hydrogens participate in hydrogen bonding with the electronegative elements (due to the high dipole moments and charges on the atoms). These interactions cause the stability to increase and therefore a solid is formed at room temperature with a regular lattice and a more favourable hydrogen density than ethane.[24]
Stability of ammonia borane relative to reactants
| E = E(reactants - E(products) |
The reaction shown below is the suggested reaction scheme for creating NH3BH3 and the stability of NH3BH3 relative to its suggested reactants will now be investigated using the equation to the right.
| NH4Cl + NaBH4 -> NH4BH4 + NaCl |
| NH4BH4 -> NH3BH3 + H2 |
The energies for the first reaction are shown below.
| Molecule | Energy / kJ/mol |
|---|---|
| NH4Cl[25] | -189343 |
| NaBH4[26] | -72076 |
| NH4BH4[27] | -221438 |
| NaCl[28] | -39972 |
The energy for the first reaction is: E = E(reactants - E(products) = -9 kJ/mol
The energies for the second reaction are shown below.
| Molecule | Energy / kJ/mol |
|---|---|
| NH4BH4[27] | -221438 |
| NH3BH3[13] | -218458 |
| H2[29] | -3083 |
The energy for the second reaction is: E = E(reactants - E(products) = 103 kJ/mol
This shows that for the first reaction the reactants are energetically more stable than the products and requires energy to proceed however for the second reaction the products are energetically more stable than the reactants.
The overall energy for the reaction is: E = 94 kJ/mol
Overall when the first and second reactions are combined it can be seen that the overall reaction is thermodynamically favourable and that the products are stable when compareed with the reactants. Therefore upon this analysis it can be theorised that this is a good reaction pathway for the formation of ammonia borane.
NH3BH3 Alkali Alternatives[30]
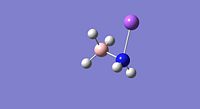
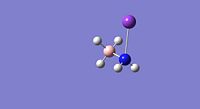
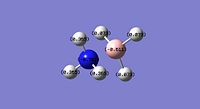
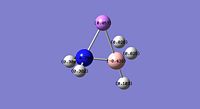
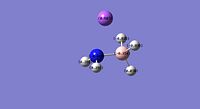
The problem with the use of NH3BH3 is the realease of borazine on decomposition, it is therefore possible to use an alternative to this with similar properties. One alternative is NaNH2BH3 and is the most traditional, it is possible however to use different alkali or alkaline earth metal cations and I will therefore be modelling a series of these to see how they compare. The same method and basis set was used as in the earlier NH3BH3 analysis and all the molecules formed the staggered conformation after optimisation as seen below. Frequency analysis was then carried out to ensure that these structures were indeed global minima and not local minima and they were[31][32][33].
| Property | LiNH2BH3[34] | NaNH2BH3[35] | KNH2BH3[36] |
| Jmol | 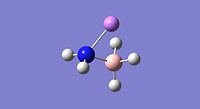 |
 |
 |
| Calculation Type | FOPT | FOPT | FOPT |
| Calculation Method | RB3LYP | RB3LYP | RB3LYP |
| Basis Set | LANL2DZ | LANL2DZ | LANL2DZ |
| Charge | 0 | 0 | 0 |
| Spin | Singlet | Singlet | Singlet |
| E(RB3LYP) | -90.179 a.u. | -82.843 a.u. | -110.781 a.u. |
| E | -236765 kJ/mol | -217504 kJ/mol | -290856 kJ/mol |
| RMS Gradient Norm | 0.00002408 a.u. | 0.00001120 a.u. | 0.00005253 a.u. |
| Dipole Moment | 4.97 Debye | 7.38 Debye | 9.54 Debye |
| Point Group | C1 | C1 | C1 |
| Time | 43.6 seconds | 2 minutes 19.5 seconds | 2 minutes 55.5 seconds |
| E-N Bond Length | 1.89Å | 2.26Å | 2.62Å |
| B-N Bond Length | 1.61Å | 1.61Å | 1.61Å |
 |
 |
 |
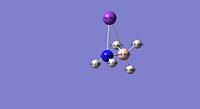 |
From the bond lengths is can be seen that the E-N bond lengths (where E=Li, Na or K) are substantically longer than the H-N bond length of 1.02Å in ammonia borane; this is indicative of substancial ionic character (M+(NH2BH3)-). The B-N bond lengths for the Li, Na and K compounds are shorter than for the ammonia borane compound, this is indicative of a stronger B-N bond in the alkali metal amidoborane derivatives. The substitution of hydrogen with an alkali metal which is a stronger electron donating group causes considerable changes in the electronic state of the nitrogen, this therefore modifies the B-N bond and the bonding of this is altered therefore affecting the entire molecule and this specific interaction makes dehydrogenation of the molecule easier.
The dipoles of the sodium and potassium derivatives are higher than the ammonia borane dipole, this alters the intermolecular interactions and changes the hydrogen bonding causing the molecules to form a more compact crystal structure which leads to a better hydrogen volumetric density. They are also more reactive as molecules with higher dipoles are more unstable so are much likely to release H2 and dehydrogenate.
Analysis was then attempted on derivatives of the alkaline earth metals (Be2+(NHBH3)2-, Mg2+(NHBH3)2- and Ca2+(NHBH3)2- however this failed as the optimisation did not converge after many attempts using different variations on setup and intial starting positions.
Conclusion
Whilst it can be seen that NH3BH3 is a very promising method for storage of hydrogen in the future especially when compared with its organic conterpart it does have its problems, the principle one is the release of the toxic gas borazine upon decomposition. This can be prevented by using alkali derivatives of these which do not release borazine and have better volumetric hydrogen densities than ammonia borane, it is therefore important that research is carried out into this area as it is very promising as another solution for hydrogen storage under normal conditions.
References
- ↑ 'The boron K photoabsorption spectra of BF3, BC13, and BBr3' - E. Ishigurot, S. Iwatas, Y. Suzukio, A. Mikunill and T. Sasakill, J. Phys. B: At. Mol. Phys., 1982, 15, 1842-1854
- ↑ A combined vacuum ultraviolet laser and synchrotron pulsed field ionsization study of BCl3 - J. Yang, Y. Mo, K. C. Lau, Y. Song, X. M. Qianb and C. Y. Ng, Physcial Chemistry Chemical Physics, 2005, 7, 1518-1526
- ↑ Cis Log File From Initial Optimisation DOI:10042/to-2981
- ↑ Trans Log File From Initial Optimisation DOI:10042/to-2982
- ↑ Cis Log File From Final Optimisation DOI:10042/to-2988
- ↑ Trans Log File From Final Optimisation DOI:10042/to-2989
- ↑ 'Crystal structures of trans-[Mo(CO)4(PPh3)2] and 1,4-bis_diphenylphosphino)-2,5-difluorobenzene' - G. Hogarth and T. Norman, Inorganica Chimica Acta, 1977, 254, 167-171
- ↑ 'Steric Contributions to the Solid-State Structures of Bis(phosphine) Derivatives of Molybdeum Carbonyl. X-ray Structural Studies of cis-Mo(CO)4[PPh3-nMen]2 (n = 0, 1, 2)' - F. A. Cotton, D. J. Darensbourg, S. Klein and B. W. S. Kolthhammer, Inorg. Chem., 1982, 21, 294-299
- ↑ 'Crystal structures of trans-[Mo(CO)4(PPh3)2] and 1,4-bis_diphenylphosphino)-2,5-difluorobenzene' - G. Hogarth and T. Norman, Inorganica Chimica Acta, 1977, 254, 167-171
- ↑ Cis Log File From Vibrational Analysis DOI:10042/to-2990
- ↑ Trans Log File From Vibrational Analysis DOI:10042/to-2991
- ↑ 'Vibrational Spectra and Bonding in Metal Carbonyls. III. Force Constants and Assignments of CO Stretching Modes in Various Molecules; Evaluation of CO Bond Orders' - F. A. Cotton, Journal of Inorganic Chemistry, 1964, 3, 702-711
- ↑ 13.0 13.1 Optimisation Data file for Ammonia Borane Staggered Conformer DOI:10042/to-3134 ]
- ↑ Optimisation Data file for Ammonia Borane Eclipsed Conformer DOI:10042/to-3135 ]
- ↑ Optimisation Data file for Ethane Staggered Conformer DOI:10042/to-3137 ]
- ↑ Optimisation Data file for Ethane Eclipsed Conformer DOI:10042/to-3136 ]
- ↑ Frequency Data file for Ammonia Borane Staggered Conformer DOI:10042/to-3146 ]
- ↑ Frequency Data file for Ammonia Borane Eclipsed Conformer DOI:10042/to-3147 ]
- ↑ Frequency Data file for Ethane Staggered Conformer DOI:10042/to-3144 ]
- ↑ Frequency Data file for Ethane Eclipsed Conformer DOI:10042/to-3145 ]
- ↑ NBO Data file for Ammonia Borane DOI:10042/to-3146 ]
- ↑ NBO Data file for Ethane DOI:10042/to-3146 ]
- ↑ 'Ammonia borane: the hydrogen source par excellence?' - F. H. Stephens, V. Pons and R. T. Baker, Dalton Transactions, 2007 DOI:10.1039/b703053c
- ↑ 'Ammonia borane: the hydrogen source par excellence?' - F. H. Stephens, V. Pons and R. T. Baker, Dalton Transactions, 2007 DOI:10.1039/b703053c
- ↑ Optimisation Data file for NH4Cl DOI:10042/to-3174 ]
- ↑ Optimisation Data file for NaBH4 DOI:10042/to-3175 ]
- ↑ 27.0 27.1 Optimisation Data file for NH4BH4 DOI:10042/to-3176 ]
- ↑ Optimisation Data file for NaCl DOI:10042/to-3177 ]
- ↑ Optimisation Data file for H2 DOI:10042/to-3178 ]
- ↑ 'High-capacity hydrogen storage in lithium and sodium amidoboranes' - Z. Xiongi et al., nature materials, 2008, 7, 138-141
- ↑ Frequency Data file for LiNH2BH3 DOI:10042/to-3413 ]
- ↑ Frequency Data file for NaNH2BH3 DOI:10042/to-3412 ]
- ↑ Frequency Data file for KNH2BH3 DOI:10042/to-3411 ]
- ↑ Optimisation Data file for LiNH2BH3 DOI:10042/to-3244 ]
- ↑ Optimisation Data file for NaNH2BH3 DOI:10042/to-3245 ]
- ↑ Optimisation Data file for KNH2BH3 DOI:10042/to-3246 ]
- ↑ NBO Data file for NH3BH3 DOI:10042/to-3146 ]
- ↑ NBO Data file for LiNH2BH3 DOI:10042/to-3294 ]
- ↑ NBO Data file for NaNH2BH3 DOI:10042/to-3293 ]
- ↑ NBO Data file for KNH2BH3 DOI:10042/to-3292 ]

