Rep:Mod:Gc517
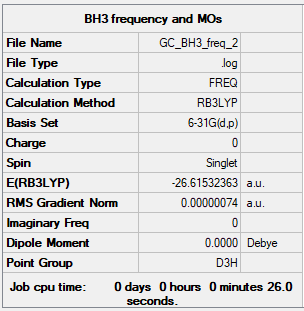
BH3
B3LYP/6-31G(d,p) level
 Item               Value     Threshold  Converged?
 Maximum Force            0.000001     0.000450     YES
 RMS     Force            0.000001     0.000300     YES
 Maximum Displacement     0.000006     0.001800     YES
 RMS     Displacement     0.000004     0.001200     YES
Frequency analysis log file: BH3 log file
 Low frequencies ---  -0.7432   -0.4567   -0.0054   10.8345   14.9093   14.9279
 Low frequencies ---  1163.0235 1213.2009 1213.2036
BH3 |
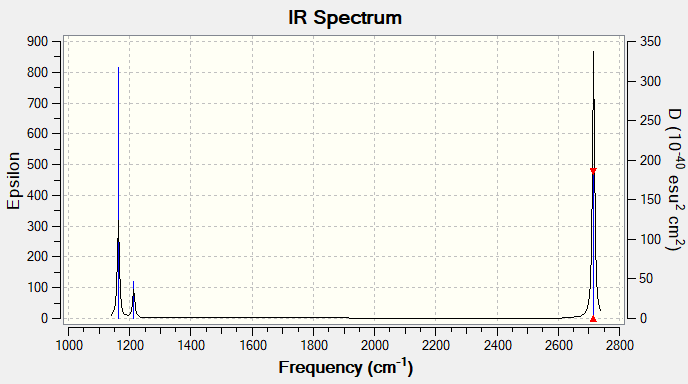
Vibrational spectrum for BH3
Ng611 (talk) 15:10, 27 May 2019 (BST) Good vibrational analysis!
| wavenumber (cm-1) | Intensity (arbitrary units) | symmetry | IR active? | type |
| 1163 | 96 | A2 | yes | out-of-plane bend |
| 1213 | 14 | E' | very slight | bend |
| 1213 | 14 | E' | very slight | bend |
| 2582 | 0 | A1' | no | symmetric stretch |
| 2715 | 126 | E' | yes | asymmetric stretch |
| 2715 | 126 | E' | yes | asymmetric stretch |
The reason why only 3 vibrational peaks are observed out of the 6 calculated is due to the fact that:
- two sets of vibrations are degenerate (ie same energy)
- the symmetric stretch is IR inactive because there is no change in dipole associated with it
MO diagram of BH3
|
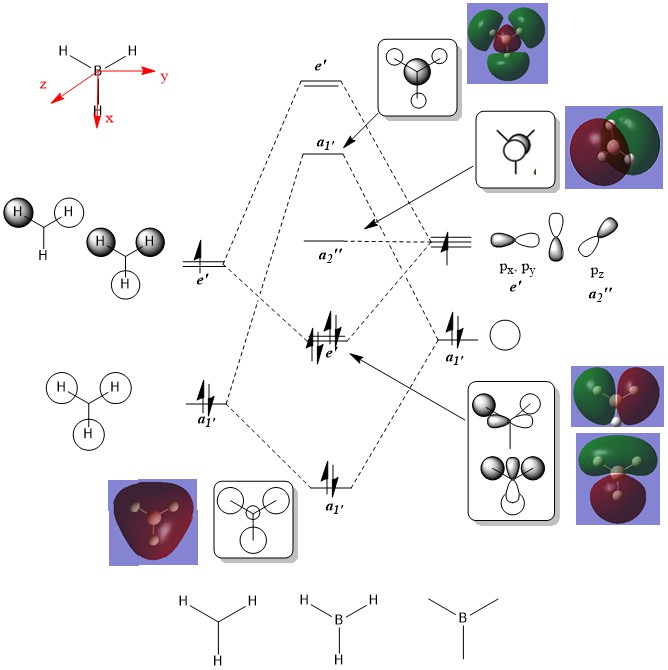
Overall, the MO qualitative diagram provides an accurate picture of the real molecular orbitals in BH3. While the bonding orbitals derived from the theory are quite close to the real computed ones, the real anti-bonding MOs are more diffuse than the drawn ones.
Ng611 (talk) 15:13, 27 May 2019 (BST) While the difference you gave is correct, it is not the most significant difference. Can you think of any more significant differences?
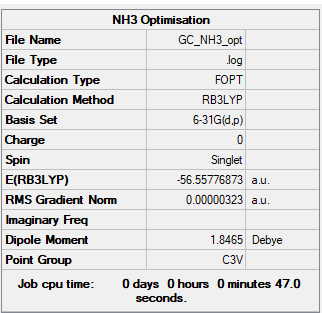
NH3
B3LYP/6-31G(d,p) level
 Item               Value     Threshold  Converged?
 Maximum Force            0.000006     0.000450     YES
 RMS     Force            0.000004     0.000300     YES
 Maximum Displacement     0.000012     0.001800     YES
 RMS     Displacement     0.000008     0.001200     YES
Frequency analysis log file: NH3 log file
 Low frequencies ---  -8.5646   -8.5588   -0.0047    0.0454    0.1784   26.4183
 Low frequencies ---  1089.7603 1694.1865 1694.1865
NH3 |
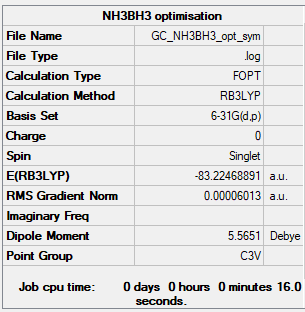
NH3BH3
B3LYP/6-31G(d,p) level
 Item               Value     Threshold  Converged?
 Maximum Force            0.000122     0.000450     YES
 RMS     Force            0.000058     0.000300     YES
 Maximum Displacement     0.000540     0.001800     YES
 RMS     Displacement     0.000297     0.001200     YES
Frequency analysis log file: NH3BH3 log file
 Low frequencies ---  -0.0571   -0.0499   -0.0074   21.7150   21.7251   40.6257
 Low frequencies ---  266.0444  632.3706  640.1455
NH3BH3 |
- E(NH3)= -56.55776873 a.u.
- E(BH3)= -26.61532363 a.u.
- E(NH3BH3)= -83.22468891 a.u.
- ΔE=E(NH3BH3)-[E(NH3)+E(BH3)]= -0.05159655 a.u. = -135 kJ/mol
From the calculations, a more negative value of E for the ammonia borane complex was obtained, meaning that the formation of the B-N bond led to a stabilisation of the molecule and energy was released. The bond between B and N is a dative bond, where the N atom donates its lone pair of electron to the electron-deficient borane. By comparing the B-N bond energy obtained to an average N-N bond energy [1] (160 kJ/mol) it can be stated that the bond is overall weaker (and hence, longer). This might be due to the fact that B and N have different electronegativities (with N being deeper in energy) and this leads to a decreased interaction between their orbitals.
Ng611 (talk) 15:15, 27 May 2019 (BST) Good calculation! Try to use a book/paper, instead of a web-based source/
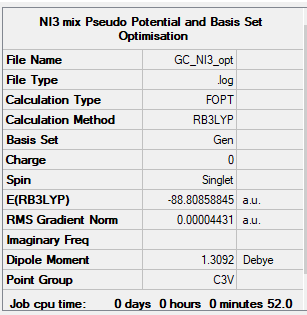
NI3
B3LYP/6-31G(d,p)LANL2DZ
 Item               Value     Threshold  Converged?
 Maximum Force            0.000102     0.000450     YES
 RMS     Force            0.000075     0.000300     YES
 Maximum Displacement     0.000667     0.001800     YES
 RMS     Displacement     0.000490     0.001200     YES
Frequency analysis log file: NI3 log file
 Low frequencies ---  -57.5982  -57.5982  -54.4001   -0.0138   -0.0053   -0.0037
 Low frequencies ---  125.3731  125.3764  182.0113
NI3 |
N-I bond lenght = 2.184 Å
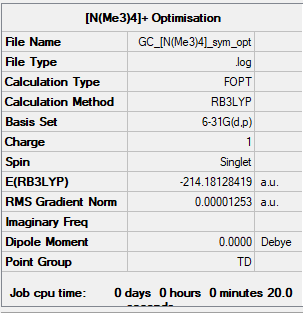
[N(CH3)4]+
B3LYP/6-31G(d,p)
 Item               Value     Threshold  Converged?
 Maximum Force            0.000018     0.000450     YES
 RMS     Force            0.000010     0.000300     YES
 Maximum Displacement     0.000279     0.001800     YES
 RMS     Displacement     0.000108     0.001200     YES
Frequency analysis log file: [N(Me3)4 log file]
 Low frequencies ---  -0.0006   -0.0002    0.0002   34.7041   34.7041   34.7041
 Low frequencies ---  216.7021  316.0377  316.0377
[N(Me3)4] |
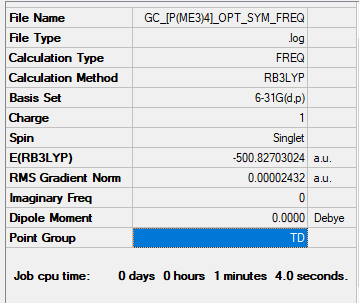
[P(CH3)4]+
B3LYP/6-31G(d,p)
 Item               Value     Threshold  Converged?
 Maximum Force            0.000120     0.000450     YES
 RMS     Force            0.000030     0.000300     YES
 Maximum Displacement     0.000586     0.001800     YES
 RMS     Displacement     0.000258     0.001200     YES
Opt + Frequency analysis log file: [P(Me3)4 log file]
 Low frequencies ---  -0.0032   -0.0029   -0.0025   26.2709   26.2709   26.2710
 Low frequencies ---  161.1920  195.6545  195.6545
[P(Me3)4] |
Charge Analysis
-
Charge analysis of [N(Me3)4]+
-
Charge analysis of [P(Me3)4]+
| N | C | H |
|---|---|---|
| -0.295 | -0.483 | 0.269 |
| P | C | H |
|---|---|---|
| 1.666 | -1.060 | 0.298 |
By comparing the two results, it is possible to observe the different electronegativities of the central atoms N and P in the two ions and their effect on the electronegativities of the other atoms. In fact, in the N complex, there is no significant difference between the charges on N and C, whereas the C-P bond in the P complex is polarised. This suggests that, in P(Me3)4]+ the C atoms pull the electron density towards them, leaving a positive charge on the P, whereas in [N(Me3)4]+ the charge is not localised on the N atom, but rather delocalised across the molecule. Moreover, due to symmetry, in both complexes the carge on the C and H atoms is the same.
It follows that the traditional representation of a [NR4]+ complex with the charge localised on the central atom is not accurate because it implies that the charge sits on the N, whereas calculated charged distributions show that this is not the case, due to the electronegativity of N compared to C and the low polarity of the of the C-N bond. Therefore, the positive charge is either to be considered delocalised across the molecule or, at most, located on the H atoms (the only positively charged atoms in the above analysis).
Ng611 (talk) 15:19, 27 May 2019 (BST) Yes, but you've not been clear on why these differences emerge. On a fundamental level, what is it about the formal charge picture that breaks down?
MO Analysis
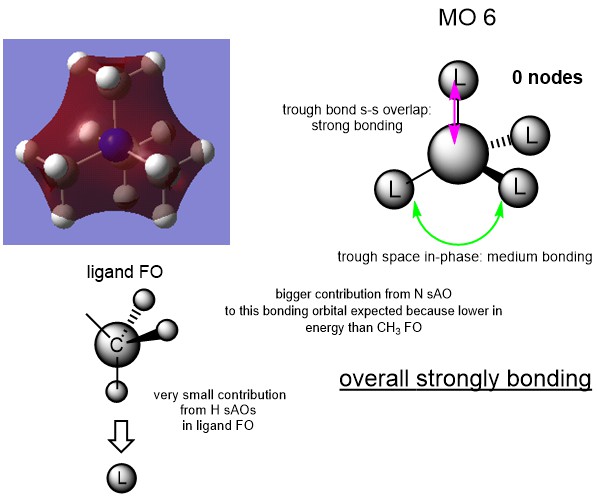
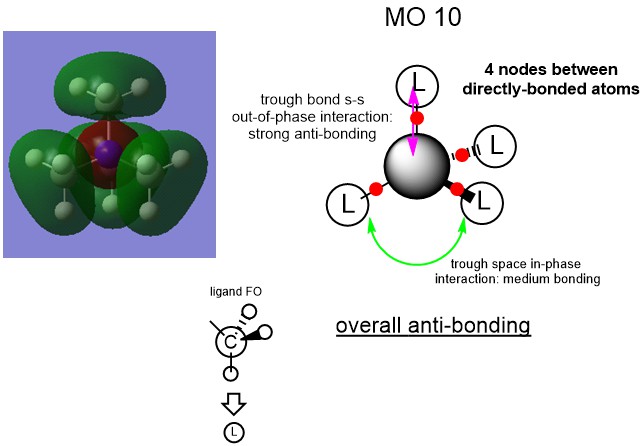
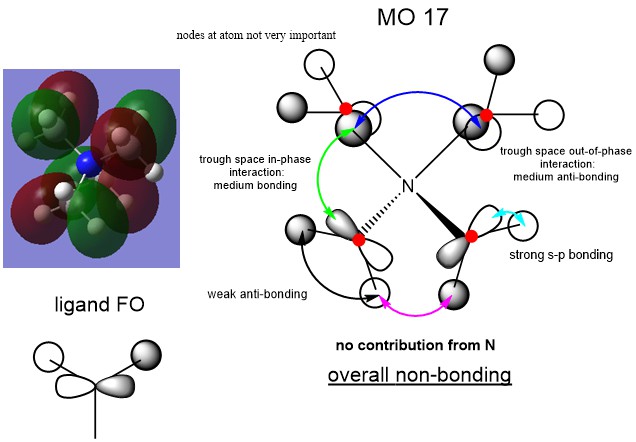
Ng611 (talk) 15:21, 27 May 2019 (BST) Good MO analysis. For your third MO, why not use the FO you (correctly) provide on your overall MO?
References
<references> [1] </references

![Charge analysis of [N(Me3)4]+](/images/thumb/1/1c/Charge_N_gc.PNG/590px-Charge_N_gc.PNG)
![Charge analysis of [P(Me3)4]+](/images/thumb/b/b4/Charge_P_gc.PNG/645px-Charge_P_gc.PNG)
