Rep:Mod:GD409 module2
Module 2: Structure and Bonding of Inorganic Complexes
Introduction
Inorganic compounds can be analysed using GaussView 5.0 in order to obtain various data regarding their structure and bonding which includes NMR, IR and dipole moments. This is possible as the programme uses first principles ‘ab inito’ quantum mechanical solutions in order to evaluate various molecules by solving Schrödinger’s equation using DFT calculations along with B3LYP settings. The molecules BH3 and TlBr3 are analysed using MO (and NBO) and pseudo-potentials respectively. Furthermore the transition metal complex Mo(CO)4(PPh3) is examined to test the geometric isomers and their stability. Finally the Mini-project is concerned with analysing aluminium dimers using two different basis sets in order to find the most stable isomer.
Optimisation of BH3
Due to the complexity of the polynomial atomic orbitals from the solution of the Schrodinger equation these cannot exactly be used. Instead Slater Type Orbitals (STO) can be used which resemble very closely the atomic orbitals. The introduction of Gaussian Type Orbitals (GTO) basis function is necessary as the STO is mathematically difficult to be handled computationally. There is a loss of accuracy of decay as the GTO has dependence of 1/r2 and the STO 1/r. Therefore three or more Gaussians can describe one atomic orbital more accurately and these are very efficient and fast. The STO also has inaccuracy as the single power of r results in incorrect number of radial nodes.
[1] A minimal basis set uses one STO to describe the ground state atomic orbital of an atom. In this case for BH3 3-21G basis set is used so as mentioned before one STO defines the 1s, 2s, 2p boron and 1s hydrogen atomic orbitals. The more STOs used the more accurate the approximation for the AOs but at the same time this increases the time taken and the cost of computational instrumentation. Normally the valence orbitals are the only ones that need to be analyzed more accurately as these usually participate in reactions the most. However the core density affects the total energy the most so is also key so even more GTOs should be used for the core. Therefore the primitive Gaussian functions contract in a specific way which results in less accurate reactivity. For 3-21G contracted basis set 3 contracted primitive Gaussian functions are present for the core and for the valence orbitals 3 primitive Gaussian functions are contracted (in pattern of 2 and 1).

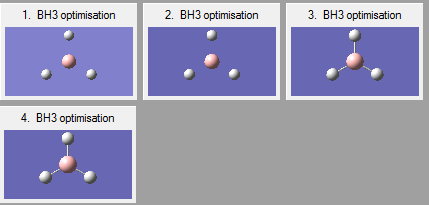
Optimisation of a BH3 molecule with bond lengths set to 1.5 Armstrong is performed using the Born Oppenheimer approximation (nuclei momenta neglected as they are heavier and slower than electrons) to calculate the electron density and energy. The nuclei position (R) is constantly altered undergoing 4 iterations until the minimum lowest energy geometry is obtained which corresponds to a minimum on a PES curve and is thus the optimised geometry. Each of the 4 iteration geometries has its total energy calculated again. These geometries can be seen in Figure 3. The root mean squared gradient is defined as the rate of change of energy E(R) with nuclear position.
The calculation is DFT and B3LYP model is set to control the particular approximations used when solving the Schrodinger equation. A basis set is defined as a set of functions used to make molecular orbitals. The basis set is 3-21G and this allows extremely fast calculations with low accuracy. The speed of calculation outweighs the low accuracy which is why this is the preferred basis set. In fact the accuracy in this case is not low because the molecule is very symmetric and basic so the contracted GTOs are not so damaging.
The calculation for the optimization is confirmed by checking that the gradient tends to zero and is lower than 0.001 which is indeed the case shown by the table (obtained from text log file). The reason the gradient tends to zero is that this is where a stationary point occurs.


The optimised geometry is at 1.19 armostrong and bond angle 120 degrees. The literature is 1.19 armstrong so this agrees.[2]


The negative gradient of the graph shows how after each iteration the energy decreased until the optimum geometry is obtained at a RMS gradient of zero (first derivative) where a minimum or maximum occurs. The confirmation of this is done using the second derivative as explained below. The reason the first two geometries lack bonds is that the distance between the atoms is too far and exceeds the set limit which Gaussian uses.
The stationary point minimum however can only be confirmed using vibrational analysis. The second derivative of the energy with respect to nuclear position is represented by the sign of the frequencies. If there is a maximum, energy is released and there is a negative frequency and no stationary point obtained as a result. If on the other hand the vibrational values are all positive, then a minimum is reached as the energy state increases due to electron movement. This can then be classified as a stationary point.
Vibrational Analysis
As mentioned before the second derivative of the vibrational analysis can confirm the local minima stationary point. The method used was DFT with B3LYP and the basis set is 3-21G. This is equivalent to what was used to optimise the BH3 structure in the first plase in order to be able to make comparisons between the energies. This is because if a different method or basis set is used the optimised structure obtained before is not going to automatically correspond to a minima on a potential energy surface from a different calculation type. In conclusion the accuracy of these calculations is dependent upon the basis set and calculation types. The results are shown below.
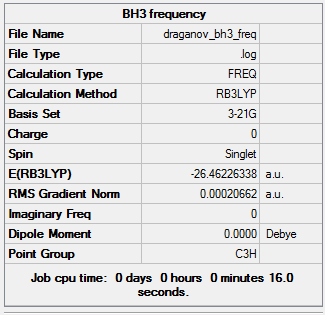

This table illustrates that the total energy E(RB3YLP) of summary 1 (optimisation of molecule) and summary 2 (Vibrational) are identical so is strong evidence for the convergence to a local minima. Furthermore the trigonal planar point group D3h in both is the same. There are 4 atoms which means: 3x4 – 6 = 6 vibrational frequencies which are all positive so minimum stationary point has indeed been obtained as explained earlier.
| Stretching vibrational mode | Vibration type | D3h point group symmetry | Frequency (cm-1) | Intensity | Visualisation | Literature cm^-1 [3] |
|---|---|---|---|---|---|---|
| 1 | Wagging – The centre of mass is unchanged for the molecule as the boron moves in opposite direction (like a recoil) to the hydrogens which move in unision in the z-direction | A2 ' ' | 1144.15 | 92.8665 | 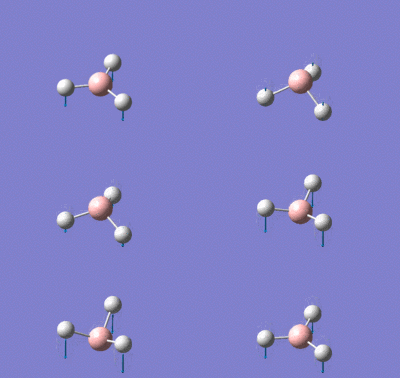 |
1147.5 |
| 2 | Scissoring – One hydrogen and the boron move upwards while the other two hydrogens move downwards which again means that the centre of mass is constant during the vibration. The angle H-B-H is contracted and expanded as a result. | E' | 1203.64 | 12.3148 | 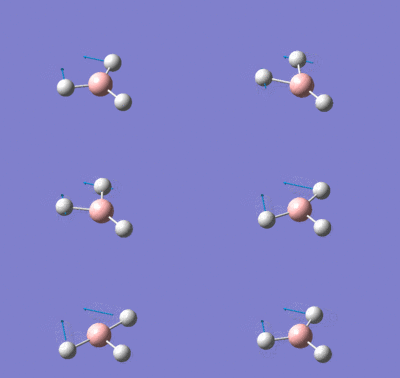 |
1196.7 |
| 3 | Rocking – One hydrogen swings from side to side and the other two hydrogens keep an equal angle between them as they rock. This means that the single hydrogen that moves side to side continuously changes its angle with the other two rocking hydrogens. In total one H-B-H angle expands, one is constant and one is constricted. The conservation of the centre of mass again occurs as the smaller movements of the atoms other than the hydrogen moving to change the two H-B-H angles are able to balance it. | E' | 1203.64 | 12.3173. | 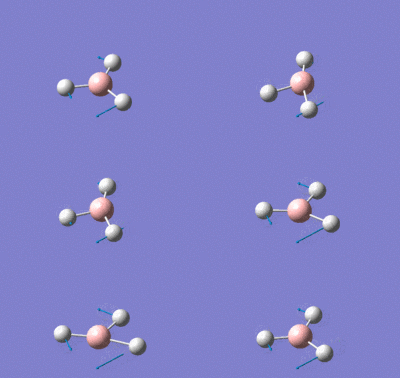 |
1196.7 |
| 4 | 'Symmetric Stretching - The central boron is constant while the B-H bonds all move in unison symmetrically. Unchanged centre of mass. | A'1 | 2598.42 | 0 | 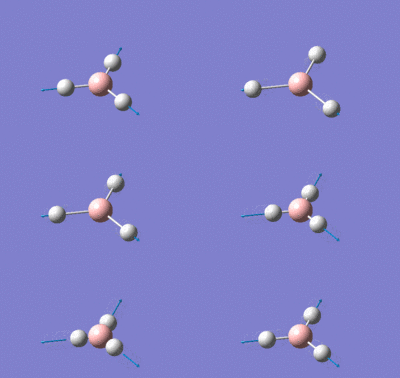 |
|
| 5 | Asymmetric Stretching – While one B-H bond is constant the other two B-H bonds are asymmetrically lengthening and shortening. | E' | 2737.44 | 103.74 |  |
2601.5 |
| 6 | Asymmetric Stretching - One B-H bond stretches and contracts asymmetrically to the other two which stretch and contract symmetrically. In order to keep the centre of mass constant throughout the vibration when two B-H bonds lengthen the boron moves up and the other B-H bond shortens. | E' | 2737.44 | 103.7333 | 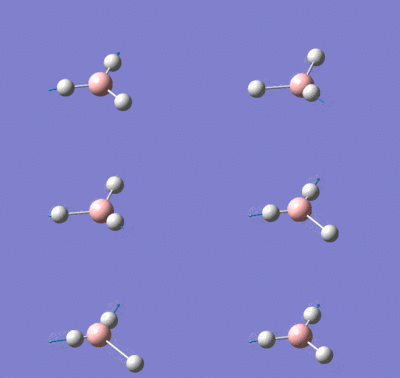 |
2601.5 |
The table above shows that the symmetric stretching frequency has a zero intensity and this can be explained as the symmetry means no transition dipole moment change so IR inactive. Also the scissoring and rocking have the same frequency as they are degenerate with the same energy. This also occurs for the last two asymmetric stretches at 273.44cm-1. Overall the IR shows 3 peaks consisting of a weak degenerate scissoring/rocking stretch, a strong pair of degenerate asymmetric stretches and a medium wagging stretch at 1144.15cm-1. As mentioned before the symmetric stretch is not observed. If this experiment had been done without a computer the inactive stretches would not have been seen so this is an advantage of computational IR analysis. Furthermore all the frequencies are positive confirmingthe energy minimum and also comparison with literature shows a very small difference showing the correct results have been obtained.
MO analysis of BH3
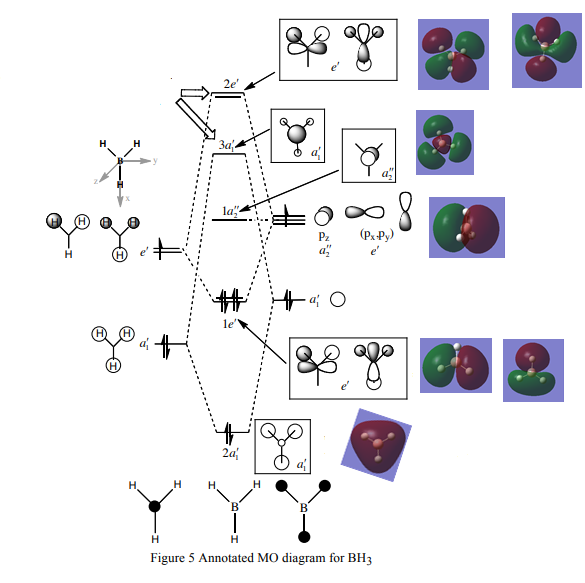
The Molecular Orbitals were calculated using the previous optimised file with key words “pop=full”, a basis set of 3-21G and the DFT-B3LYP method as before asking for full NBO’s. The advantage of computationally analysing the electron density is that the MO’s can be generated and matched to those produced by normal MO diagram analysis. DOI:10042/to-12237
 |
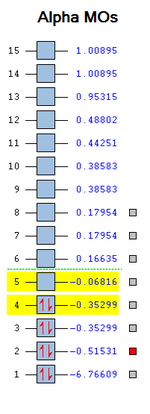 |
The 3a1’ is higher in energy (more destabilised) than the 2e’ due to molecular orbital mixing by theory. However if a different basis set is used and the calculation method is changed than this ordering can be different. As mentioned when comparing the linear combination of atomic orbitals obtained qualitatively to the MO’s generated computationally there is a very good match and this is shown in the diagram. The higher energy unfilled anti-bonding molecular orbitals are more diffuse and the similarity is not as quite good as the bonding ones as illustrated by 2e’. This is a very powerful discovery as no equations were required. However, when systems get more complex computational analysis is more efficient and preferred. The diagram does not show MO’s 9-15 as these do not take part in bonding. Also MO 1 is very low in energy and not shown. The other 7 MO’s were chosen as they were bonding.
NBO analysis

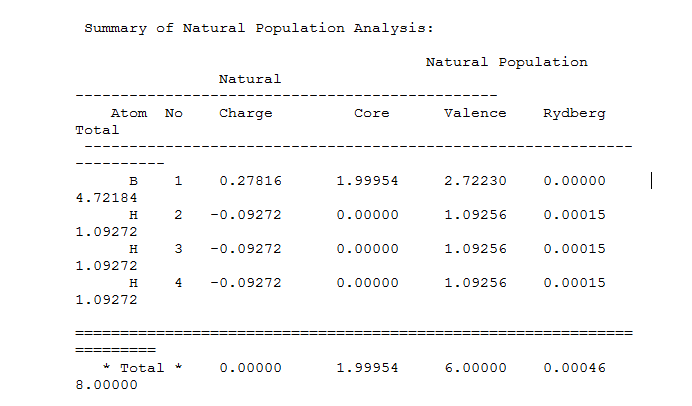
Natural Bond Orbitals (NBO’s) can give graphical images of charge distribution in a BH3 molecule. By further opening the .log file output information regarding the hybridization can be obtained.
Summary of Natural population analysis:
Bond orbital hybrids:
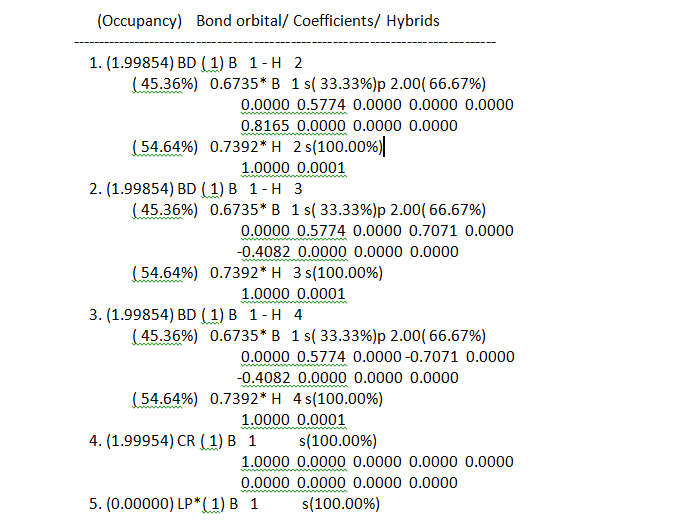
The Boron is Lewis deficient and so very positive while the hydrogens are negatively charged containing one third of the charge each due to being the s orbital in a sp2 hybridized structure. The hydrogen contributes an s orbital 100% and the boron a 2p-orbital so in total there are three sp2 orbital hybrids. The boron contributes 66.6667% p character and s character 1/3 so confirms the sp2 hybridization. The 4th orbital is non-bonding with a boron 100% s character. The fifth orbital is a lone pair boron orbital again reported as 100% s-character. Here this lone pair should be instead p-character. This error could be because the basis set used has low accuracy due to reasons mentioned earlier.
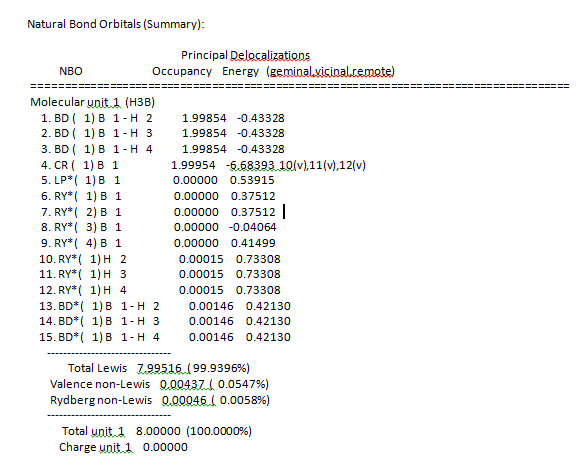
NBO summary:
Second order pertubration theory analysis of Fock Matrix is NBO basis:
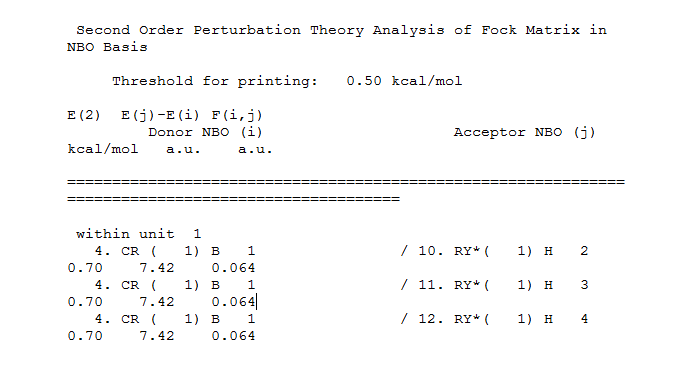
When mixing has an energy of 20kcalmol^-1 then it becomes significant. In the table no mixing can be seen as all the MO’s are lower in energy and not significant. The orbital occupancy table shows that there are two electrons present in 4 B-H bonds.
TlBr3 optimization
Compared to BH3 the TlBr3 has a much higher electron density, especially due to the Bromine atoms instead of hydrogens. The large electron density and the large size of the molecule results in relativistic effects, so it takes very long to calculate the wavefunction computationally and the Schrodinger equation struggles at calculating these. This is because the Schrodinger calculates all the electrons even the non-bonding ones. Therefore pseudo potential is used to avoid this as it takes into account the valence orbitals and so makes the calculation much faster. Also because thallium is larger, more diffuse and complex the 3-21G basis set is inaccurate. The LANL2DZ basis set is instead used with DFT-B3LYP method. This makes use of two Slater Orbitals to represent each atomic orbital so improves the accuracy and this is called double zeta basis function. Also it utilises the Los Alamos Effective core orbitals pseudo potentials. The D3h point group was used.


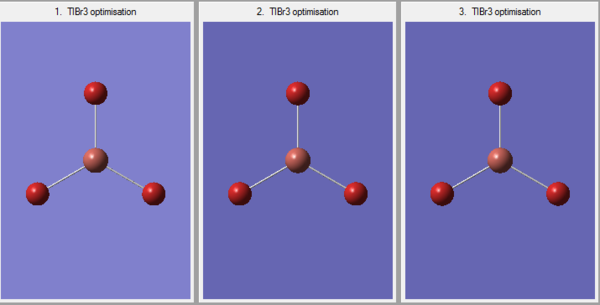
There were three iterations (as shown above) whilst optimising the structure and eventually the gradient is nearly zero. The discussion about BH3 are applicable here and hence the need of IR analysis to confirm the minima nature of the stationary point reached.
Vibrational Analysis
For the vibrational analysis of TlBr3 the same basis set and method was used as for optimising TlBr3 in order to have results that can be compared to each other with a fair method.
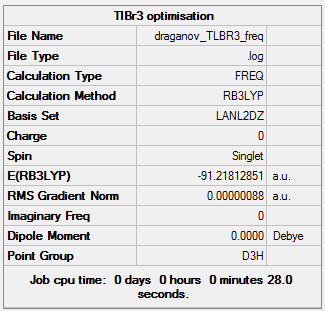
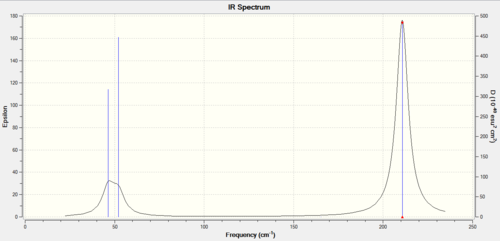
As it can be seen in this summary for the frequency, the final energy matches the previous optimised structure summary so this shows a correct calculation. The point group is the same for TlBr3 and BH3 so this is the reason the IR spectra are similar containing three peaks. There is a “broad peak” on the left due to superposition of two peaks. The reason the frequencies are much lower in thallium is because the bond Tl-Br is longer than B-H, thus weaker so of lower energy.
As mentioned before Gaussview has standard set bond distances and if the distance is larger than this then no bond is displayed between the atoms. The bond is therefore not decided upon electron density being shared between atoms which is a disadvantage. A real chemical bond forms as there is attractive electron density sharing between two or more atoms creating a lower energy molecule than if the individual energies of the atoms was added up.
The low frequencies arise due to centre of mass motion and as a result are lower than the normal modes in the IR spectrum. The lowest real mode was 46cm^-1 whilst the low frequencies are reported at -3.4, 0, 0, 0,3.9,3.9. Therefore 3.4 is around ten times smaller than 46 but this is acceptable . The reason there is error is due to the low accuracy method used.
The frequencies shown in the table below are all positive so the minimum stationary point was reached.
| Stretching vibrational mode | Vibration type | D3h point group symmetry | Frequency (cm-1) | Intensity | Visualisation | Literature cm^-1 [4] |
|---|---|---|---|---|---|---|
| 1 | Scissoring | E’ | 46 | 4 | 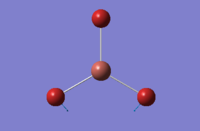 |
47 |
| 2 | Rocking | E' | 46 | 4 | 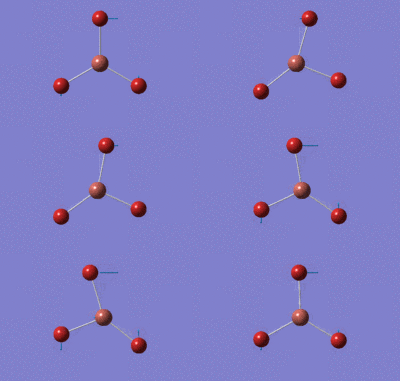 |
47 |
| 3 | Wagging | A2 ' | 52 | 6 | 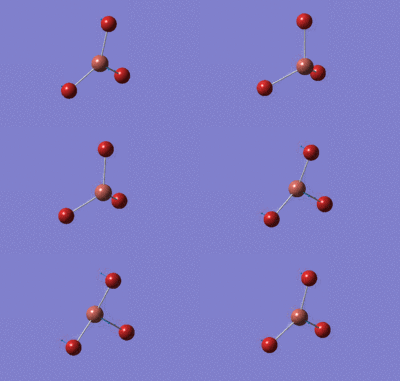 |
63 |
| 4 | 'Symmetric Stretching | A'1 | 165 | 0 | 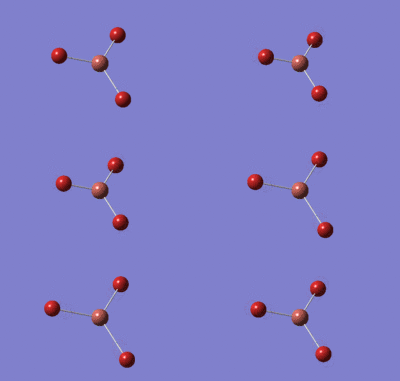 |
185 |
| 5 | Asymmetric Stretching | E' | 211 | 25 |  |
203 |
| 6 | Asymmetric Stretching | E' | 211 | 25 | 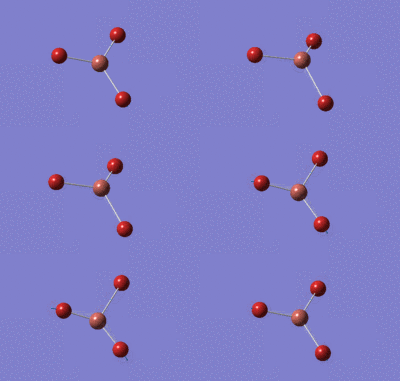 |
203 |
When comparing to literature all the values for the frequencies are in very good match. The last two asymmetric vibrations are identical in energy as in the case for BH3 and also the first two are the same. The symmetric one has no trasition moment dipole so zero intensity and doesn't come up. The remaining wagging vibration is shown in the IR. So there is two sets of degenerate frequencies and one wagging one, total of 3 peaks seen.
Cis and Trans Isomerisation of Mo(CO)4L2
Mo(CO)4(PPh3)2 is too heavy and large so computational demand is huge, instead the Ph groups are replaced by Cl atoms. Chlorine is suitable due to having very similar bonding and occupation of space sterically. Mo(CO)4(PCl3)2 is examined using DFT-B3LYP method and LANL2MB minimal pseudo potential for the core electrons. The limit for convergence is set to loose in order to gain the optimum bond lengths and angles in an approximate geometry structure. This was used to calculate the optimisation for the cis and trans isomer shown below. The Jmol structure is attached.


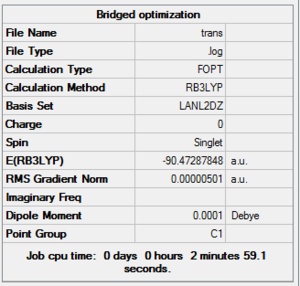


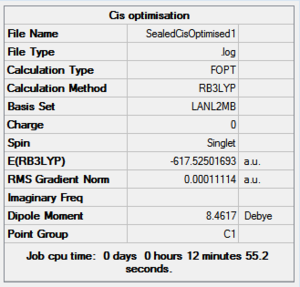


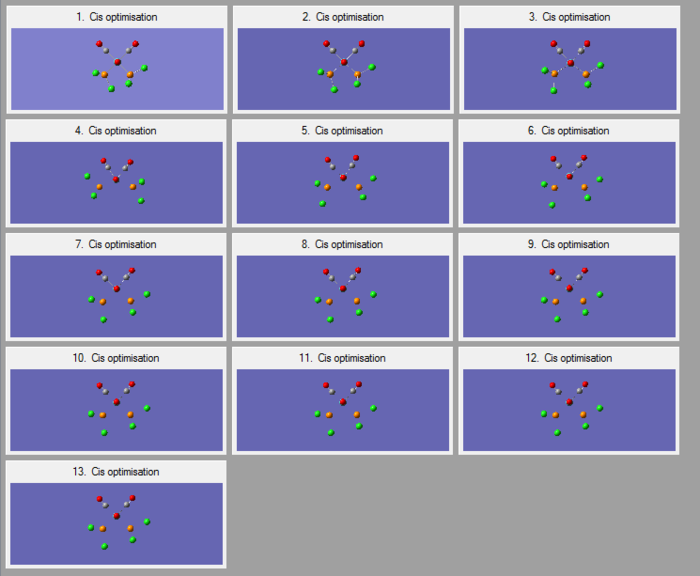
In both geometric isomers the final energy of -617.52au is the same. The main difference is in the dipole moments where the cis isomer has 8.5D whilst the trans has zero. The reason for the zero dipole moment in the trans is that the symmetry is very high. The cis isomer has 13 iterations and the trans has 4 iterations. The trans has a smoother curve. Both reached a stationary point but this was not the most optimised geometry as it was only a local minimum not a global one.
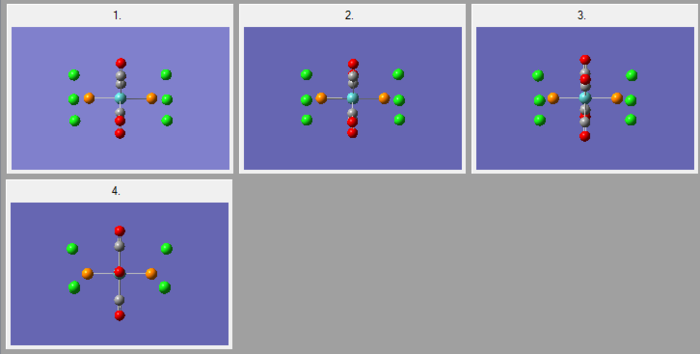
A second optimisation was done after the molecule geometry of the first optimised structures was altered slightly. For the trans isomer one of the chlorine atoms of the PCl3 was directly laying over the CO bond and the other two were in an eclipsed position. For the cis isomer the Cl atom of one of the two PCl3 groups was put parallel to the axial bond pointing down and the other group had the same thing done with one Cl pointing upwards instead. This is called dihedral optimisation, and has a improved pseudo potential with the basis set accuracy improved by using LANL2DZ (smaller range of convergence). The illustration below shows the starting changed geometries for the second optimisation:
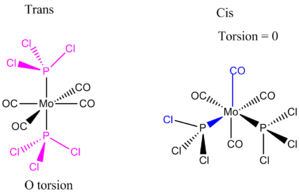
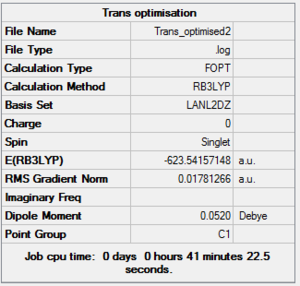


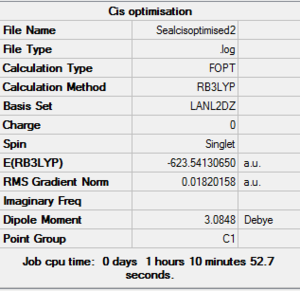


As can be seen this dihedral optimisation was more accurate and the minimum final energy is lower for both isomers at -623au (smaller than -617au form before), so in turn more stable. This can now be classified as a global minimum.
Vibrational analysis
The frequency of vibration was analysed using the same method and basis set as before to make the results fair and comparable. The summaries below show the frequency results for the two isomers. The minimum stationary point was confirmed as the energy stayed at -623au.
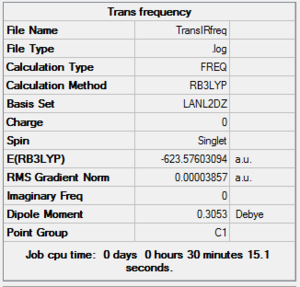
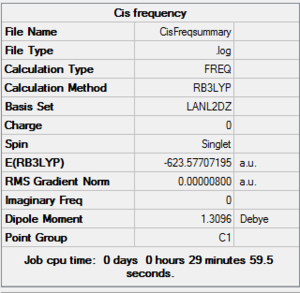
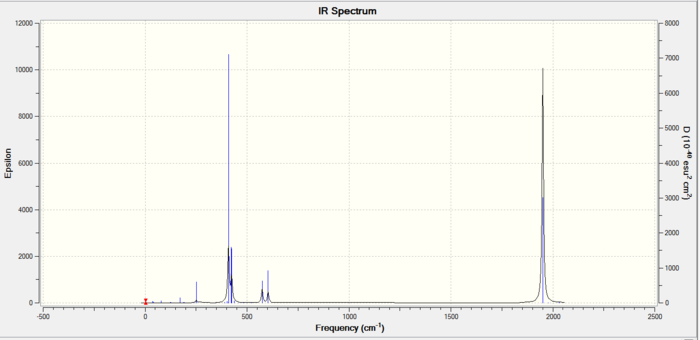
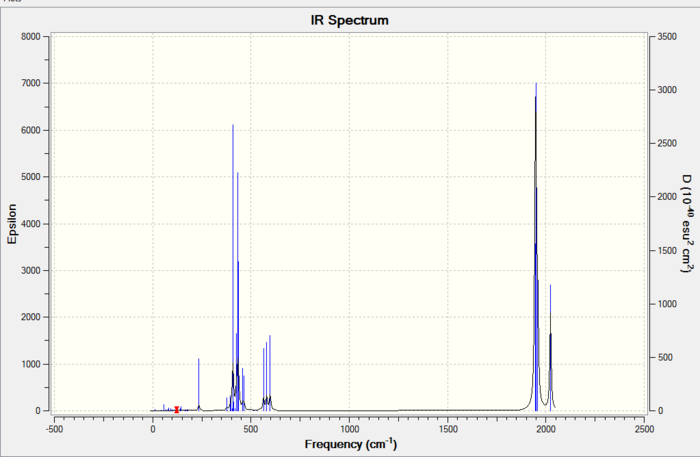
Below are the frequencies of vibrations for the trans conformer:
| Stretching vibrational mode | Vibration type | D3h point group symmetry | Frequency (cm-1) | Intensity | Visualisation | Literature cm^-1 [5] |
|---|---|---|---|---|---|---|
| 1 | - | - | 5 | 0.1 |  |
|
| 2 | - | - | 46 | 0 |  |
|
| 42 | Asymmetric | Eu | 1951 | 6 | 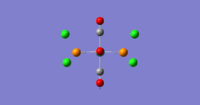 |
1943 |
| 43 | Asymmetric | E u | 1951 | 1467 | 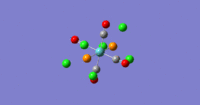 |
1943 |
| 44 | Symmetric out of phase | B1g | 1977 | 0.6 | 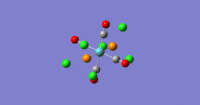 |
1985 |
| 45 | Symmetric | A1g | 2031 | 3.8 | 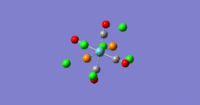 |
2050 |
The table shows that the literature values are very close to those obtained computationally.
Below are the frequencies of vibrations for the cis conformer:
| Stretching vibrational mode | Vibration type | D3h point group symmetry | Frequency (cm-1) | Intensity | Visualisation | Literature cm^-1 [5] |
|---|---|---|---|---|---|---|
| 1 | - | - | 11 | 0.03 |  |
|
| 2 | - | - | 18 | 0.01 |  |
|
| 42 | Asymmetric | B2 | 1945 | 763 |  |
1941 |
| 43 | Asymmetric | B 1 | 1949 | 1499 |  |
1948 |
| 44 | Symmetric out of phase | A1 | 1958 | 633 |  |
1965 |
| 45 | Symmetric | A1 | 2023 | 598 | 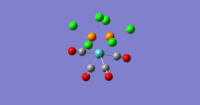 |
2049 |
Once again the agreement with literature is very good.
The two isomers had 45 frequency stretches but a lot of them had no transition dipole moment so were inactive on the IR and not shown. The lower symmetry cis isomer has a higher dipole moment (1.3D>0.3D) and a larger amount of peaks. There are two frequencies at 18 and 11 cm^-1 due to the chlorine atome being rotated out of plane of their ideal geometry. These frequencies are at very low energy so must be at the minimum.
The cis isomer has four CO carbonyl stretches of strong intensity whilst the trans has only one (formed from two degenerate ones). The other two stretches in the trans are inactive and not shown due to the extremely low intensity. The trans has a higher symmetry and this is shown by the fact that it has a lower dipole moment which is unaffected by the inactive vibrations mentioned. The cis and trans are very similar in their final energy so it isn’t possible to chose which is more stable and preferred. In the trans the PCl3 large groups are trans which means less steric repulsion so can be said to be slightly more stable.
The structure of the cis was analysed in terms of bond lengths and bond angles and compared to literature [6].
| Bond analysed | Computational length (A) | Literature length (A) |
|---|---|---|
| P-Mo | 2.512 | 2.58 |
| Mo-C axial | 2.058 | 2.02 |
| Mo-C equatorial | 2.012 | 1.97 |
| C-O axial | 1.173 | 1.13 |
The table shows how the bond lengths of the cis are all very close to literature and are ±0.05Å off. The P-Mo bond is shorter than literature and the rest are longer than expected.
The bond angles for the cis were compared below:
| Bond analysed | Bond angle computational(degrees) | Literature bond angle degrees |
|---|---|---|
| P-Mo-P | 94.16 | 105 |
| C-Mo-P axial | 91.89 | 91.7 |
| C-Mo-P equatorial | 176.09 | 174 |
| C-Mo-C cis | 178.35 | 173 |
The angles are larger than literature for all the bonds except the first C-Mo-P. This is because in literature phenyl groups are used which are larger so cause more steric repulsions and result in a larger angle. In this computational analysis Cl was used so it is possible for the angle to be smaller.
The trans isomer structure was also compared to literature[7].
| Bond analysed | Computational length (A) | Literature length (A) |
|---|---|---|
| P-Mo | 2.44 | 2.5 |
| P-C | 2.06 | 1.9 |
| C-O | 1.17 | 1.16 |
Here the P-Mo is shorter than literature just like the cis due to the fact that Cl is smaller than Ph (literature) so less strain at shorter distance. The rest of the values are again very close to literature.
| Bond analysed | Bond angle computational(degrees) | Literature bond angle degrees |
|---|---|---|
| P-Mo-P | 177 | 180 |
| C-Mo-P | 90 | 92 |
| C-Mo-C trans | 179.98 | 180 |
| C-Mo-C cis | 90.5 | 87 |
Here the bond angles are closely matching literature again. All this positive agreement illustrates that the choice of using Cl atoms in place of Ph is very appropriate as it affected literature very minimally yet allowed very reduced computational demand (shorter running times).
Mini-Project
Introduction
The aim of this project is to analyze the most stable dimerised structure of aluminium when two different halides are present i.e. bromine and chlorine. The chlorine and bromine can both chose to occupy the bridging position and the most stable one will be found. The 3 possible structures for AlBr2Cl4 (cis trans and bridging) will be examined by optimizing the molecules, calculating bond lengths, angles and vibrational stretches to compare to literature. Also NBO analysis will be considered to see the charge distributions and attempt to use this information to find the stabilities of the dimers relative to each other. Below are the 3 structures.
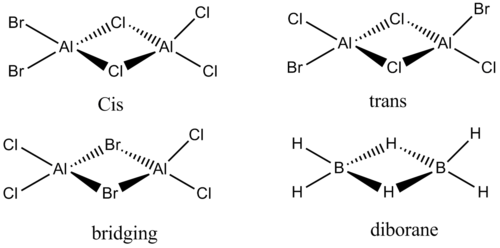
This is a 3c-2e multi-center bond which is formed from the very Lewis acidic trigonal planar AlX3 halides (X=Br, Cl, At) that accept a lone pair of electrons. Normally if VSEPR is used to explain the structure it is not possible. That is why molecular orbital theory is required. In this project diborane has its MO diagram analysed at it is one of the simplest known examples of the 3c-2e bond geometry described above. This MO theory for diborane will also apply for the other 3 aluminium dimers as the valence orbitals will for very similar MO diagrams.
Diborane
The DFT-B3LYP method was used with the LANL2DZ basis set in order to optimize the diborane. Below is the summary of the optimization for diborane and the Jmol file. DOI:10042/to-12241
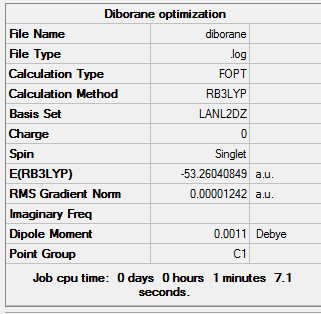
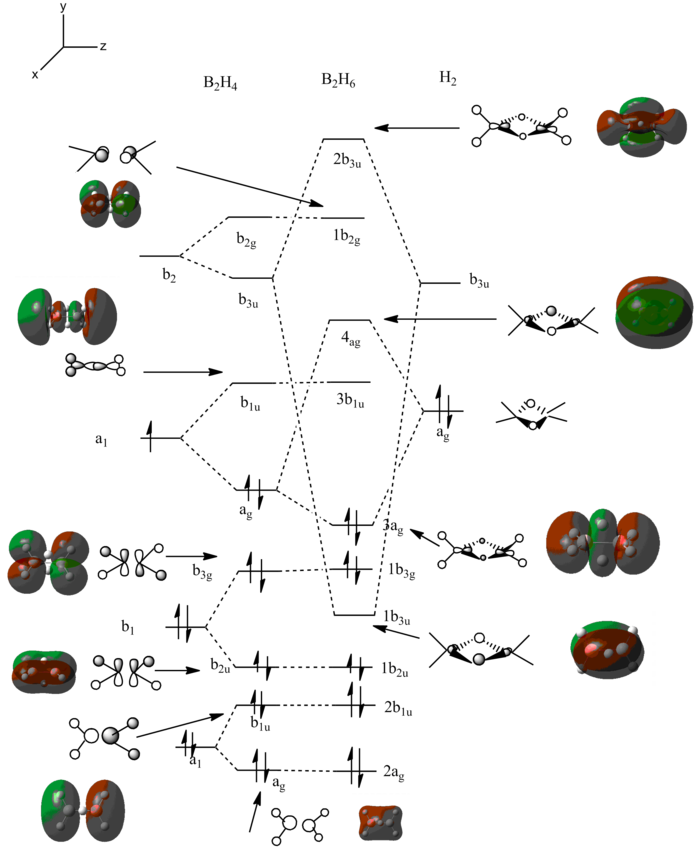
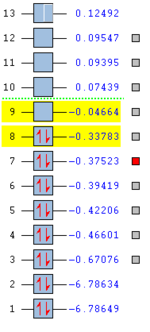
In order to analyze the molecular orbitals the “full NBO” options was used with energy selection and visualization of the first 3a-12a orbitals. This is because these were highlighted in yellow and participated in bonding. The others are not considered for the same reasons as before in BH3. The energies and the MO diagram is shown below. DOI:10042/to-12242
 |
 |
The computation molecular orbitals can be compared with the linear combination orbital method in the same way as before. For the LCAO approach the fragment orbitals used were (BH2)2 (giving ten electrons) and H2 (for the bridging give two electrons). The reason there is no orbital mixing is that there is a large difference in energy between the orbital that have the same symmetry. An example of this is 2ag and 3ag orbitals.
The energies illustrate that the biggest difference occurs between orbital 8 and 9. From this it can be deduced that 8 is the HOMO and 9 is the non-bonding LUMO. The LUMO is able to accept a lone pair of electrons making diborane a Lewis acid. The MO diagram shows good agreement between the LCAO approach and the computationally calculated orbitals. There are four non-bonding orbitals. The calculation was easier computationally than by hand (LCAO approach).
Aluminium isomers
In the 3 structures AlBr2Cl4 the bridging position is occupied by either the lighter molecular weight chlorine or heavier bromine and this is investigated below. In the cis form the two bromines are on the same side on the same aluminium. The trans form has bromines trans to each other on opposite faces. The bridging has the bromines in the bridging position and the chlorine on the two aluminium atoms. Further analysis can be done with 2 At atoms in place of the two Br atoms to investigate the really heavy atoms and perhaps find a pattern. The most stable form has the lowest final energy as shown in the summaries below for each optimization. Clearly this will be the most negative number. The optimizations were done once again using LANL2DZ basis set under DFT-B3LYP. The Jmol files are also attached along with the summaries for each below:
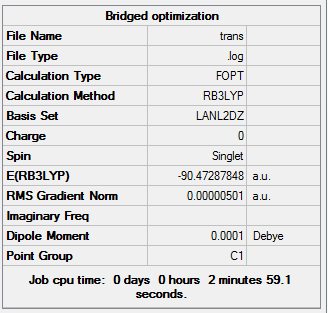
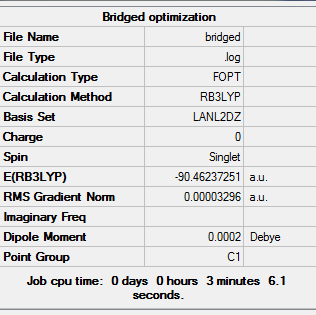
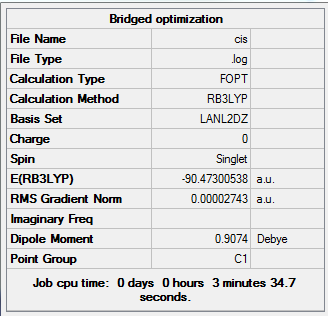
My results show that the cis is the most stable and the bridging bromines the least stable, with trans as an intermediate energy of the two. This cannot be rationalized unless the bond lengths, angles, vibrational stretch and charge distribution is analyzed. If we simply thing alone normal theory lines of strain and electronegativity the results are incorrect. For example the bromine atom is less electronegative than chlorine (further down the group) so surely these two bromines should be in bridging position to ease the dative covalent bonding to aluminium. Also the bromines are larger than chlorines, so surely they prefer to be as far apart as possible so in trans structure to avoid steric repulsions. However the cis is more stable according to the result which means that the large bromines prefer to be next to each other.
Structure analysis
Bond lengths for trans:
| Al-Br terminal (Armstrong) | Al-Cl terminal (armstrong) |
|---|---|
| 2.34 | 2.18 |
Bond lengths for bridging:
| Al-Br bridging (Armstrong) | Al-Cl terminal (armstrong) |
|---|---|
| 2.59 | 2.18 |
Bond angles for trans
| Terminal Cl-Al-Br (degrees) | Bridge Al-Cl-Al (degrees) |
|---|---|
| 124 | 95 |
Bond angles for bridging:
| Bridging Al-Br-Al (degrees) | Terminal Cl-Al-Cl (degrees) |
|---|---|
| 91 | 123 |
Cis Bond lengths:
| Al-Br terminal (Armstrong) | Al-Cl terminal (armstrong) | Al-Cl bridge (armstong) |
|---|---|---|
| 2.34 | 2.18 | 2.44 |
Bond angles for cis:
| Terminal Cl-Al-Cl (degrees) | Bridge Al-Cl-Al (degrees) | Br-Al-Br terminal |
|---|---|---|
| 123 | 95 | 125 |
Literature values for bond lengths [8]:
| Terminal Al-Cl | Bridge Al-Cl | Terminal Al-Br | Bridge Al-Br |
|---|---|---|---|
| 2.1 | 2.2 | 2.2 | 2.3 |
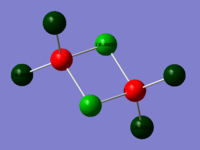
The diagram below shows what is meant by a bridging and terminal atom.
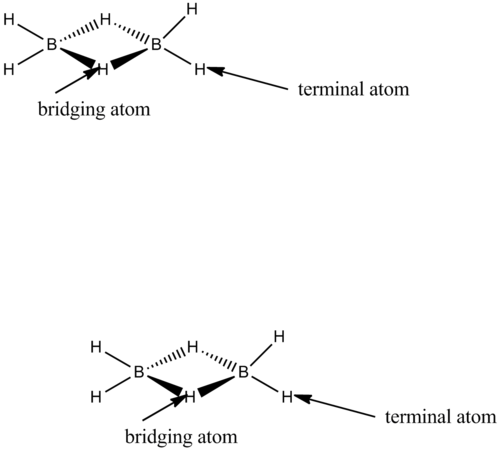
The termianl Al-Cl bond length calculated computationally seem to agree well with the literature value of 2.06Armstrong. The change of the bromine atom position (bridging, cis, trans) has no effect on the terminal bond length fo Al-Cl as this stays at 2.18 .The Al-Br terminal/bridged bond length changes for the three conformations. For the cis and trans the bond lengths are nearly the same. In the bridging conformer the Al-Br bond length is much greater as the orbital overlap is worse as bromine is in a different period to aluminium. The overlap integral S is smaller with bromine atoms bridging which results in a lower overall stabilization energy (Estab = S^2/difference in energy). This means the bond length is longer. Also an obvious reason is that the bromine has a higher atomic radius.
The bond angle for the bridging bromine atoms configuration is larger. This occurs as the bromine has a larger atomic radius so more steric repulsions and need to increase their distance apart, meaning that the bridging conformer is definitely not the most stable and the least stable as mentioned before. The reason that the trans is less stable than the cis cannot be explained by structural analysis and this is why vibrational analysis and charge distribution is taken into account.
IR vibrational analysis
The IR spectra of the three isomers is shown below:
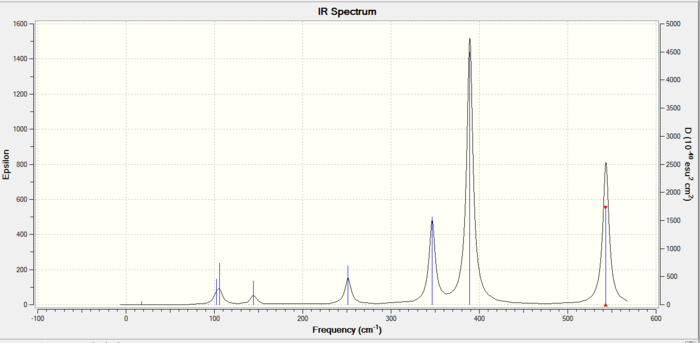
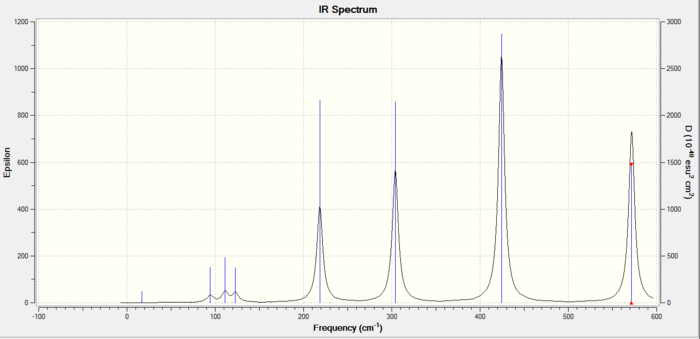
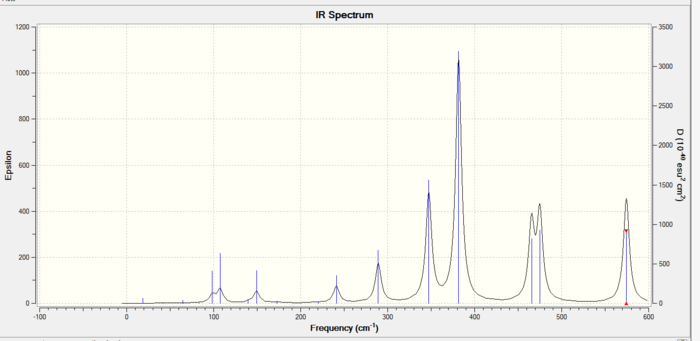
The trans isomer vibrational reults are shown below:
| Mode of vibration | Frequency (cm^-1) | Intensity | ’’’Visualization’’’ |
|---|---|---|---|
| 1 | 347 | 135 |  |
| 2 | 389 | 439 |  |
| 3 | 543 | 235 |  |
The bridging isomer is shown below:
| Mode of vibration | Frequency (cm^-1) | Intensity | ’’’Visualization’’’ |
|---|---|---|---|
| 1 | 304 | 163.4 |  |
| 2 | 424 | 305 |  |
| 3 | 572 | 211.7 |  |
When comparing the bridging and the trans configurations there is an interesting pattern. The first vibration has a lower frequency for the bridging by around 40cm^-1. On the other hand for the other two vibrations the bridging has a higher frequency than the trans. The aluminium atoms are still connected to the bridging bromines so hence the same atoms in the same type of bonding making this a bizarre result. The frequency of oscillation depends upon the force constant (type of bond) which is the same in this case. The changing factor is the type of vibrational motion which is different for the first vibrations (rocking forward and backwards). In order for the frequency to be smaller there needs to be a higher reduced mass. This means that the first vibration of the bridging conformation incorporates a larger amount of atoms with a higher total molecular weight. Therefore this low stretching frequency for the bridging bromine happens because the halogen bromine is heavier than chlorine.
The cis results are shown below:
| Mode of vibration | Frequency (cm^-1) | Intensity | ’’’Visualization’’’ |
|---|---|---|---|
| 1 | 347 | 136 |  |
| 2 | 382 | 305 |  |
| 3 | 465 | 96 |  |
| 4 | 475 | 110 |  |
| 5 | 574 | 132 |  |
The cis configuration can also be used for comparisons with the other two. Previously there were three main high intensity IR active modes of vibrations for the trans and bridging. For the cis there are five in total. This happens due to the chemical environment difference. One of the aluminium atoms is connected to two bromines while the other to two chlorines so there is an inequivalent environment, As a result one aluminium is able to oscillate in the cis, whilst before both aluminium atoms were able to vibrate together for the bridging and trans. Therefore the stretches 2 and 3 for the trans and bridging have been split into two derivatives which is why there are five stretches for the cis.
The first stretch of vibration for the cis is identical to that observed for the trans at 347cm^-1 which is again strange as the chemical environment is different as described above. This suggests that the first stretch only depends on the bridging atoms. The non-bridging halogens do not seem to affect it.
NBO
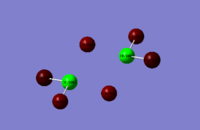
The charge distributions are shown below:
 |
 |
 |
Furthermore NBO analysis was conducted to analyze the charge distribution present in the three conformations and thus explain the stability for the final energy output. This was done using the energy option with additional keywords “pop=full”. The charges are shown on the atoms.
The Linus Pauling electronegativity series can be used to rationalize the charge distribution as the electronegativity for aluminium, bromine and chlorine are as follows: 1.6, 2.96, 3.2 respectively. Electronegativity is defined as the ability of an atom to attract electrons to itself in a covalent bond and depends on how close the outer valence shell is to the positive nucleus (nuclear attraction for foreign electron greatest for the chlorine as it is the smallest). The charge distribution is the same for the two bridging chlorine atoms for the cis and trans.
Optimisation using different basis set
The 6-311+G(d) basis set was used under DFT-B3LYP because it takes into account all the electrons and unlike the LANL2DZ does not simply look at the valence orbitals. This means it is more accurate.
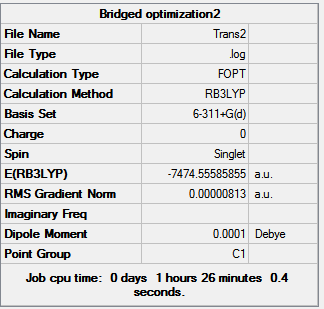
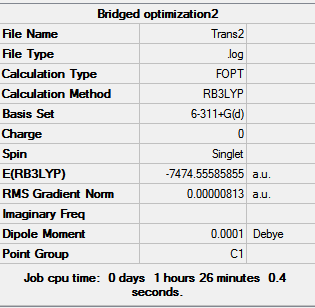

The surprising result is that the previously most stable cis isomer has becomes the least stable whilst the trans and bridging are identical. This cis took longest to optimise as it had the least symmetry. This helps explain that the cis is less stable than the trans because the bromine atoms are further apart in the trans so less steric repulsions. However the bridging being more stable cannot be explained and further in depth MO analysis is needed.
Structure analysis
Bond lengths for trans:
| Al-Br terminal (Armstrong) | Al-Cl terminal (armstrong) |
|---|---|
| 2.25 | 2.09 |
Bond lengths for bridging:
| Al-Br bridging (Armstrong) | Al-Cl terminal (armstrong) |
|---|---|
| 2.45 | 2.09 |
Bond angles for trans
| Terminal Cl-Al-Br (degrees) | Bridge Al-Cl-Al (degrees) |
|---|---|
| 122 | 90 |
Bond angles for bridging:
| Bridging Al-Br-Al (degrees) | Terminal Cl-Al-Cl (degrees) |
|---|---|
| 87 | 120 |
Cis Bond lengths:
| Al-Br terminal (Armstrong) | Al-Cl terminal (armstrong) | Al-Cl bridge (armstong) |
|---|---|---|
| 2.25 | 2.09 | 2.30 |
Bond angles for cis:
| Terminal Cl-Al-Cl (degrees) | Bridge Al-Cl-Al (degrees) | Br-Al-Br terminal |
|---|---|---|
| 122 | 90 | 122 |
Literature values for bond lengths [9]:
| Terminal Al-Cl | Bridge Al-Cl | Terminal Al-Br | Bridge Al-Br |
|---|---|---|---|
| 2.1 | 2.2 | 2.2 | 2.3 |
When the different base set is used for the trans bond lengths the Al-Br terminal position is closer to literature being 2.25 armstrong (before it was 2.34arsmstrong). The Al-Cl is also much closer to literature being 2.09 armstorng (2.18 before). This applies for all the isomers. The bridging Al-Cl length was before 2.44 but now 2.3 which means once again it is closer to literature value. As expected again the Al-Br bridging is 2.45 so closer to literature with this improved basis set. Therefore it can be concluded that using a basis set that incorporates all the electrons is more accurate as its values are closer to literature. This is of course expected as previously the pseudo potential was used to only regard the valence orbitals that participate in bonding for heavier atoms. All the previously mentioned effects are enhanced by these results.
In terms of bond angles with the new basis set the angles have all slightly decreased. This is because the previously estimated internal electron interactions are now more accurate. The increased overlap possible by analysing the structure more closely allows more favourable interactions then before.
IR vibrational analysis
The IR spectra of the three isomers is shown below:
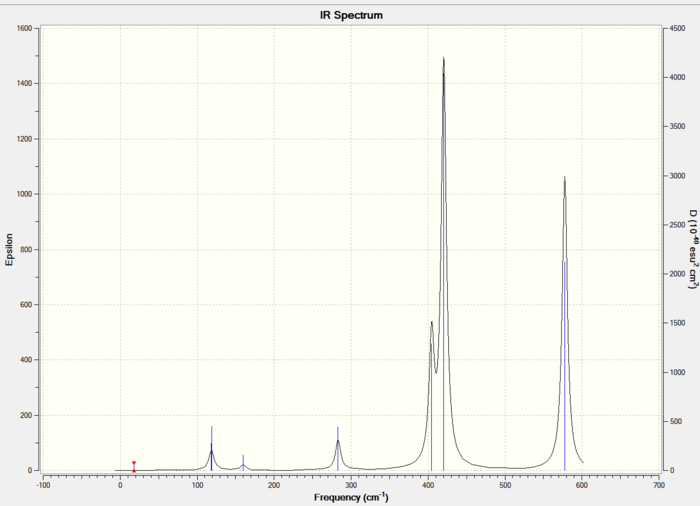

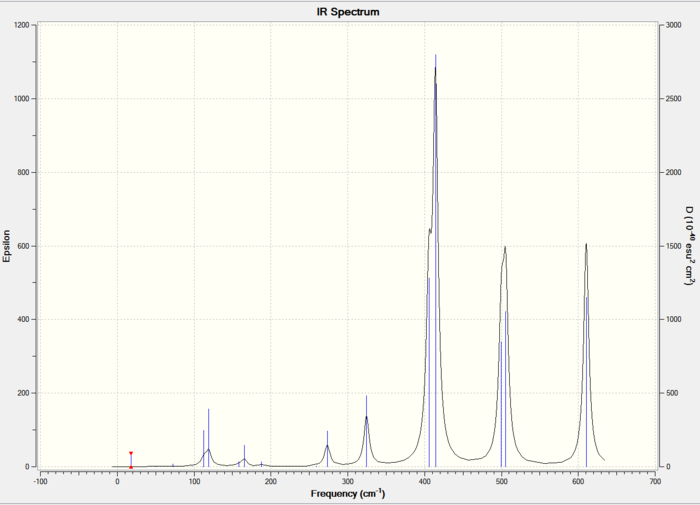
The trans isomer vibrational reults are shown below:
| Mode of vibration | Frequency (cm^-1) | Intensity |
|---|---|---|
| 1 | 404 | 131 |
| 2 | 420 | 426 |
| 3 | 578 | 308 |
The bridging isomer is shown below:
| Mode of vibration | Frequency (cm^-1) | Intensity |
|---|---|---|
| 1 | 357 | 155 |
| 2 | 467 | 347 |
| 3 | 605 | 319 |
The cis
| Mode of vibration | Frequency (cm^-1) | Intensity |
|---|---|---|
| 1 | 406 | 130 |
| 2 | 414 | 291 |
| 3 | 500 | 106 |
| 4 | 506 | 133 |
| 5 | 610 | 176 |
The stretching frequencies have increased for everything because there are more electrons being taken into account so a higher energy. The same pattern occurs where the trans has a higher first stretch than the bridging but lower stretches for 2 and 3. This can be rationalised as before. This cis isomer can also be rationalised as before as the proportions remained the same. The different first stretch by 2cm^-1 disproves the statement before that it depends only on the bridging atoms but because the difference is so low this is not very conclusive at all.
NBO
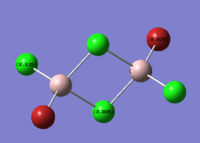
The charge distributions are shown below:
 |
 |
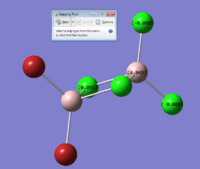 |
NBO analysis shows the charge distributions as before.
MO
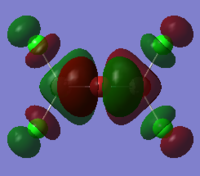
Trans isomer HOMO and LUMO along with energy shown below. Found at 82 and 83 orbitals:

HOMO:

LUMO:
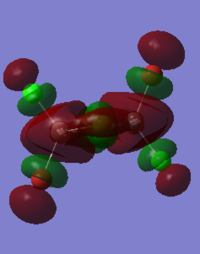
Bridging isomer HOMO and LUMO energy and orbitals shown below:DOI:10042/to-12247

HOMO:
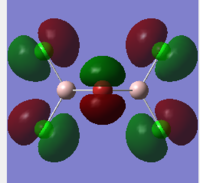
LUMO:
Cis isomer HOMO and LUMO energy and orbitals shown below:

HOMO:
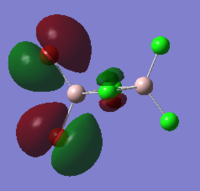
LUMO:
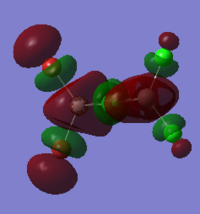
The MO diagrams show the HOMO and LUMO and 82 and 83. Again this is identified as the difference between these energy levels is the greatest. The HOMO shows more anti-bonding character in general compared to the LUMO. The trans HOMO shows anti-bonding character with the middle orbital which is small but the bonding character is between a large and small orbital so not very strong. The bridging HOMO shows the opposite kind of thing with stronger anti-bonding but also stronger bonding which compensates. This sort of explains their energies upon optimisation being identical. The cis HOMO on the other hand shows little anti-bondg (small green to big red) and no bonding. This explains why it is less stable energetically. Also the energy for the LUMO is greatest for the cis showing why it is readily able to accept electrons and hence more unstable.
Mini-project conclusion
According to the LANL2DZ basis set (pseudo potential onyl valenece orbitals regarded) the bridging conformer was the least stable whilst the cis was the most stable in the dimer AlCl4Br2. Diborane was represented by a MO diagram as it represent the same type of 3c-2e bonding as the aluminium dimer. The structural bond length/angles were calculated using ChemBio3D. This explained how steric repulsions and worse overlap integral disfavors the bridging bromine atoms. The vibrational analysis and NBO charge distribution calculations were not able to fully explain how the cis was more stable than the trans. The 6-311+G(d) basis set was more accurate hwoever as it regards all the electrons hence it takes longer to compute, but this was useful as the new bong lengths were closer to literature. The results here were reversed as the trans and bridging isomers were both more stable and equal compared to the cis isomer which was now the least stable. This is a fascinating result as it contradicts the previous finding. This can perhaps be explained by in depth analysis of the overlaps of the HOMO as attempted. In conclusion the second basis set is more reliable as it produced values closer to literature for all the bond lengths.
Conclusion
This Inorganic module has shown how Gaussview5.0 is very useful for analysing compounds. The optimised structures were successfully calculated for BH3 and TlBr3 as stated in the introduction along with further analysis into relativistic effects. The change of basis sets to LANL2DZ in order to only look at valence orbitals for the heavier transition metals of the form Mo(CO)4(PPh3)2 was also observed. The vibrational frequency IR was also calculated and MO diagrams were computationally determined and compared with the LCAO approach. The charge distribution of molecules was also studied. The Mini-project allowed all the learnt skills to be applied at looking a dimer.
References
- ↑ P. Hunt, Inorganic Computational Chemistry Year 4 lecture materials 2012, Imperial
- ↑ Handbook of Chemistry & Physics 2011-2012, 92nd Edition, 9-20
- ↑ B. Khater., J. Chem. Phys, 129, 2008
- ↑ J. E. D. Davies et al., J. Chem. Soc. (A), 1968, p.p .2050
- ↑ 5.0 5.1 F. Albert Cotton, Donald J. Darensbourg, Simonetta Klein, and Brian W. S. Kolthammer,Inorg. Chem., 21, (1982), p294
- ↑ F. Albert Cotton, Donald Darensbourg and Brian W. S. Kolthammer, Inorg. Chem., 21, (1982), p290-300
- ↑ G. Hogarth. T. Norman, Inorganica Chimica Acta, 254, (1997) p165-170.
- ↑ K. Wade,J.Chem.Educ., 49, 1972, pp.500-507
- ↑ K. Wade,J.Chem.Educ., 49, 1972, pp.500-507
