
Rep:Mod:Frodo
Aims and Objectives
This wiki will detail an initial foray into the area of bonding and orbital modelling which is critical to our understanding of experimental mechanisms in the laboratory. We will make use of Gaussian to optimise our molecular structures and then model the vibrations of our optimisations in order to check we are at an energetic minimum. Following this, we will analyse the molecular orbitals and charge density distributions.
Finally, we will increase the complexity of our target structures as we analyse a set of isoelectronic aromatic structures.
Bonding Optimisation of EX3 Molecules
Borane
B3LYP/3-21G
Optimisation log file here
| summary data | convergence | Jmol | |||
|---|---|---|---|---|---|

|
         Item               Value     Threshold  Converged?
 Maximum Force            0.000217     0.000450     YES
 RMS     Force            0.000105     0.000300     YES
 Maximum Displacement     0.000919     0.001800     YES
 RMS     Displacement     0.000441     0.001200     YES
 Predicted change in Energy=-1.635268D-07
 Optimization completed.
    -- Stationary point found.
|
|
6-31G(d,p)
Optimisation log file here
| summary data | convergence | Jmol | |||
|---|---|---|---|---|---|

|
         Item               Value     Threshold  Converged?
 Maximum Force            0.000012     0.000450     YES
 RMS     Force            0.000008     0.000300     YES
 Maximum Displacement     0.000064     0.001800     YES
 RMS     Displacement     0.000039     0.001200     YES
 Predicted change in Energy=-1.126756D-09
 Optimization completed.
    -- Stationary point found.
|
|
Gallium Tribromide
B3LYP/LANL2DZ
Optimisation log file: DOI:10042/143665
| summary data | convergence | Jmol | |||
|---|---|---|---|---|---|

|
         Item               Value     Threshold  Converged?
 Maximum Force            0.000000     0.000450     YES
 RMS     Force            0.000000     0.000300     YES
 Maximum Displacement     0.000003     0.001800     YES
 RMS     Displacement     0.000002     0.001200     YES
 Predicted change in Energy=-1.307747D-12
 Optimization completed.
    -- Stationary point found.
|
|
Boron Tribromide
6-31G(d,p)
Optimisation log file here: DOI:10042/151995
| summary data | convergence | Jmol | |||
|---|---|---|---|---|---|

|
         Item               Value     Threshold  Converged?
 Maximum Force            0.000008     0.000450     YES
 RMS     Force            0.000005     0.000300     YES
 Maximum Displacement     0.000034     0.001800     YES
 RMS     Displacement     0.000023     0.001200     YES
 Predicted change in Energy=-3.669488D-10
 Optimization completed.
    -- Stationary point found.
|
|
Ammonia
6-31G(d,p)
Optimisation log file here
| summary data | convergence | Jmol | |||
|---|---|---|---|---|---|

|
         Item               Value     Threshold  Converged?
 Maximum Force            0.000006     0.000450     YES
 RMS     Force            0.000004     0.000300     YES
 Maximum Displacement     0.000012     0.001800     YES
 RMS     Displacement     0.000008     0.001200     YES
 Predicted change in Energy=-9.841964D-11
 Optimization completed.
    -- Stationary point found.
|
|
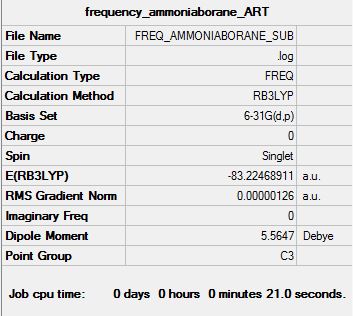
Ammonia Borane
6-31G(d,p)
Optimisation log file here
| summary data | convergence | Jmol | |||
|---|---|---|---|---|---|

|
         Item               Value     Threshold  Converged?
 Maximum Force            0.000004     0.000450     YES
 RMS     Force            0.000001     0.000300     YES
 Maximum Displacement     0.000038     0.001800     YES
 RMS     Displacement     0.000020     0.001200     YES
 Predicted change in Energy=-1.264577D-10
 Optimization completed.
    -- Stationary point found.
|
|
Analysis and Discussion
Covalent Radii - A Crude Reference Point
Boron and Gallium are both Group 13 elements and in the case of BH3, BBr3 and GaBr3 they form electron deficient, trigonal planar molecules. Due to their inherent electron deficiency they act as lewis acids and consequently accept a pair of electrons from electron donors such as pyridine.
As a first approximation, we may take the sum of the covalent radii of two atoms E and X to be equal to the bond length in X2E-X. In doing so, we assume a purely covalent bond with no ionic contributions. In moving from Hydrogen to Bromine as a ligand we expect the E-X length to increase as the degree of orbital overlap decreases (Br has larger, diffuse orbitals).
Using recent, covalent radii data,.[1] we may calculate a B-H bond length to be approximately 1.19Å. This is in agreement with our computed B-H bond length. Similarly, B-Br and Ga-Br have covalent bond lengths of 2.04Å and 2.42Å respectively. In both cases, the use of covalent radii overestimates the bond length.
Pz Backbonding - The Missing Link
Obviously, since our covalent radii model overestimates the bond length, there must be some bonding interaction that our simplistic model has failed to take into account. In addition, we must also explain why the B-Br bond length is overestimated more than the Ga-Br bond length.
In order to relieve the electron deficiency on the central atom, the halide atoms back donate electrons from their filled pz orbital into the empty pz orbital on Boron/Gallium. This gives rise to some π bonding characteristic, a higher than expected bond order and consequently shorter bond.
Moving down the group from Boron to Gallium, lewis acidity decreases, the pz orbital on the Group 13 atom becomes more diffuse, the bonds become longer and consequently the magnitude of the pz-pz interaction decreases.
Coupling the two explanations together, we can explain why the bond lengths are shorter in reality and why the B-Br bond is much shorter than expected when compared to the Ga-Br bond. In the case of the B-H bond, there is no pz orbital on Hydrogen and consequently no such pz-pz interaction can take place. This helps explain why our simplistic covalent radii model works so well in the case of Borane and implies a simple covalent B-H bond.
The idea of a simple, covalent B-H bond is backed up by the small difference in Pauling electronegativity between Boron (2.0) and Hydrogen (2.2).
Lastly, in all cases, the X-E-X bond angle is 120° which further supports the argument that the central atom is sp2 hybridised with an empty pz to accept electrons into.
| BH3 | BBr3 | GaBr3 | |
|---|---|---|---|
| r(E-X) | 1.19 | 1.93 | 2.35 |
| θ(X-E-X) | 120.0 | 120.0 | 120.0 |
What is a Bond?
A bond exists when the interaction between a set of species leads to a minimisation of the ensemble potential energy and consequent stabilisation of the resultant adduct.
Covalent bonds (in the sense of C-C, C-H, C=C etc.) have a quantum mechanical origin and it makes sense to begin our discussion here. Each atom in an covalent bond possesses its own set of atomic orbitals; taking the case of H2 these would be the two 1s orbitals on either Hydrogen atom. An atomic orbital is a mathematical wavefunction describing the quantum nature of an electron(s) in an atom; s,p,d and f orbitals are common atomic orbitals.
By making use of the Linear Combination of Atomic Orbital approach or LCAO, we can superposition these atomic orbitals when they interact to form covalent bonds. A linear combination of two separate s orbitals gives rise to a σ molecular orbital (also a termed a σ bond) and a combination of two separate p orbitals will produce a π molecualr orbital (π bond).
As with any form of superposition, the result will contain a constructive (bonding) and destructive (antibonding) combination. These combinations are termed molecular orbitals and represent the mathematical wavefunction of how the electrons in a molecular bond behave. In a bonding combination, electron density is placed in the central area of a bond where it is exposed to an attractive force from the two atomic nuclei consequently leading to a stabilisation of the resultant molecular orbital. The antibonding combination is likewise destabilised and placed at a higher energy.
Covalent bonds can range in bond strength; N2 contains a very strong triple bond (950 kJ mol-1) whilst C-C bonds with a bond strength of 350 kJ mol-1 might be termed medium strength. The degree of orbital overlap and differences in orbital energies all effect the strength of bonds.
Hitherto, we have spoken about purely covalent bonds, however, ionic bonds do exist and do not depend on the LCAO approach detailed above. Instead, electron(s) are transferred from one atom to another and generate charged ionic species which interact electrosatically with one another so as to minimise the ensemble potential energy. It is important to note that no such thing as purely ionic bonding exists; ions will tend to distort the electron clouds one another giving rise to some form of quasi-covalent bonding.
The lattice energies of atypical ionic solids range upwards of 1000 kJ mol-1 and can reach as much as 2300 kJ mol-1 (CaCl2). These again, would be classified as very strong bonds.
Neutral atoms that are not directly bonded to one another can still exert weak, but attractive forces on one another. The Lennard-Jones potential details the variation in potential energy with internuclear distance for such interactions.
Probably, the most famous of these interactions are hydrogen bonds which can be modelled according to the Lennard-Jones potential and although individually are quite weak, collectively can exert notable macroscopic effects such as increasing the boiling point of water over other group 16 hydrides.
Typically, hydrogen bonds have bond strengths of 10-40 kJ mol-1 i.e. many orders of magnitude lower than covalent or ionic bonds and are decidedly weak interactions. Other types of intermolecular attractions such as london dispersion forces are weaker by at least an order of magnitude.
Missing Bonds - Gaussian
At times, Gaussian may compute an optimised structure with no bonds present. This does not mean that the bonds do no exist, instead, when Gaussian peforms an optimisation it is working off a set of expected bond lengths. So if a low level calculation is carried out and the final bond length exceeds the expected, pre-programmed value, Gaussian will fail to recognise the existence of said bond. For example, in the dimer Al2Me6, the bridging C-Al bonds are longer (2.15Å) than the terminal Al-C bonds (1.95Å).[2] Consequently, a low level optimisation of such a structure may mean that Gaussian misinterprets both types of Al-C bonds to lie within a pre-set range and consequently lead to a poorly optimised structure.
Dative Bond Energy - NH3BH3
An attempt maybe made to compute the strength of the dative N↦B dative bond strength. The absolute energy of Ammonia, Borane and Ammonia Borane are reported below.
E(NH3)= -56.557769 hartrees, E(BH3)= -26.615324 hartrees, E(NH3BH3)= -83.224689 hartrees
ΔE=E(NH3BH3)-[E(NH3)+E(BH3)]=-83.224689-(-56.557769--26.615324)=-0.051596 hartrees
Hence, we obtain a dative N↦B dative bond strength of -135.47 KJ/mol. Comparing this to a medium strength bond, like C-C (350 KJ/mol), this is a weak bond. This value is a very poor match with higher level calculations in literature for the same bond (-274 KJ/mol).[3] Several reasons exist for this discrepancy; our model ignores the back donation from the Borane to Ammonia and polarisation effects that give rise to some amount of electrostatic attraction between Ammonia and Borane.
Frequency Optimisation of EX3 Molecules
Borane
Frequency file here
| summary data | low modes |
|---|---|

|
Low frequencies --- -14.6858 -14.6818 -11.0436 0.0005 0.0165 0.3415 Low frequencies --- 1162.9492 1213.1220 1213.1222 |
| Vibrations of BH3 | IR-spectrum | ||||||||||||||||||||||||||||
|---|---|---|---|---|---|---|---|---|---|---|---|---|---|---|---|---|---|---|---|---|---|---|---|---|---|---|---|---|---|
|
|

Gallium Tribromide
Frequency file: DOI:10042/146239
| summary data | low modes |
|---|---|

|
Low frequencies --- -1.4878 -0.0015 -0.0002 0.0096 0.6540 0.6540 Low frequencies --- 76.3920 76.3924 99.6767 |
| Vibrations of GaBr3 | IR-spectrum | ||||||||||||||||||||||||||||
|---|---|---|---|---|---|---|---|---|---|---|---|---|---|---|---|---|---|---|---|---|---|---|---|---|---|---|---|---|---|
|
|

Ammonia
Frequency file here
| summary data | low modes |
|---|---|

|
Low frequencies --- -0.0130 -0.0022 -0.0017 7.0722 8.1014 8.1017 Low frequencies --- 1089.3849 1693.9369 1693.9369 |
| Vibrations of NH3 | IR-spectrum | ||||||||||||||||||||||||||||
|---|---|---|---|---|---|---|---|---|---|---|---|---|---|---|---|---|---|---|---|---|---|---|---|---|---|---|---|---|---|
|
|

Ammonia Borane
Frequency file here
| summary data | low modes |
|---|---|

|
Low frequencies --- -5.6978 -0.3183 -0.0466 -0.0011 1.1624 1.2391 Low frequencies --- 263.2815 632.9623 638.4593 |
| Vibrations of NH3BH3 | IR-spectrum | ||||||||||||||||||||||||||||||||||||||||||||||||||||||||||||||||||||||||||||
|---|---|---|---|---|---|---|---|---|---|---|---|---|---|---|---|---|---|---|---|---|---|---|---|---|---|---|---|---|---|---|---|---|---|---|---|---|---|---|---|---|---|---|---|---|---|---|---|---|---|---|---|---|---|---|---|---|---|---|---|---|---|---|---|---|---|---|---|---|---|---|---|---|---|---|---|---|---|
|
|

Analysis and Discussion
IR Spectrum of Borane
The 3N-6 rule allows us to predict the number of vibrational degrees of freedom and in the case of Borane there are six degrees of freedom. However, as per our modelling output, two pairs of these vibrations ( specifically the pairs at 2716 cm-1 and 1213 cm-1) are energetically degenerate. This leaves only two more degrees of freedom of which one is IR inactive (2583 cm-1). In order to be IR active, a molecular vibration must cause a change in the dipole moment; by definition a symmetrical stretch in Borane cannot do this. The remaining vibrational stretch at 1163 cm-1 is IR active.
Experimentally, we are unlikely to see the peak at 1213 cm-1 due to its very low intensity. Raman spectroscopy can be used to visualise the IR inactive peak at 2583 cm-1.
A similar thought process allows us to interpret the GaBr3 IR spectrum (see summary above). A direct comparison between the two spectra will now be carried out.
The A2" Umbrella Mode as A Point of Reference
|
( is the mass of atom ). Where is the wavenumber and the spring constant. |
Since BH3 and GaBr3 share the same symmetry group (D3H) they will have similar modes such as the two set of degenerate vibrations. The intensity of these vibrational modes will be dependent on the amount by which the dipole moment is changed.
The Gallium atom, being lighter than the Bromine atoms, moves up and down relative to the Bromines whilst in the case of Borane, the Hydrogens move up and down relative to the Boron atom. It is energetically more favourable to displace a lighter atom than a heavier one.
Using the equation above; Gallium and Bromine atoms will have a larger reduced masses than Boron and Hydrogen. Since the IR wavenumber varies inversely with reduced mass, we can immediately see why the A2" umbrella mode of BH3 is at a higher wavenumbers. Additionally, it is easier to bend rather than stretch a bond, hence, in both cases stretches are at a higher wavenumber than bends. Looking at the intensity of the umbrella mode, we note it is higher for Borane than GaB3; this makes sense as there is a larger dipole moment change in the case of the former. In Borane, there are three Hydrogens being displaced whilst in GaBr3 only one Gallium atom is displaced.
Low Frequencies and Using the Same Basis Set
The first six low frequencies presented in the above examples are a measure of the amount by which the centre of mass of the molecule is moving. Ideally speaking these should be as low as possible and not more 10-15 wavenumbers. Additionally, the first 6 low frequencies are the 6 vibrational modes in the 3N-6 formula that are discarded. The represent the translational and rotational degrees of freedom.
When a structure is first submitted to Gaussian, it calculates the energy of the structure, makes adjustments and re-determines the energy before moving along a potential energy surface till an equilibrium point is reached. Whether this equilibrium lies at a maxima or minima is impossible to tell. A frequency analysis is carried by taking the second derivative of the potential energy surface in order to assess whether the target structure has been optimised for the lowest energy. In doing so it acts as a self check on our modelling work.
This lead on to why it is so important to use the same method and basis set for both the structure optimisation and frequency analysis. If a low level basis set was used to perform the optimisation and a higher level basis set for the susbequent frequency analysis then the equilibrium structure determined in the preceding case may no longer be an equilibrium structure in the corresponding frequency analysis. Additionally, the level of approximations made will change and so will the potential energy surface the structure is subjected to in the frequency analysis change.
Hence, any future comparisons between the two cases will be made useless.
Molecular Orbital Analysis of EX3 Molecules
Borane
Population File: DOI:10042/143695
| MO Diagram of Borane | Notes |
|---|---|
 |
Viability of LCAO vs. MO Computations At lower energies, the qualitative LCAO approach provides us with a good idea of the general shape and structure of the MOs, however, as we move up in energy the LCAO approach is unable to correctly assign weightless to the different AOs in order to assess their level of contribution to the overall MO's finer shape and dimensions. Because of this it can be difficult to assess the energies of two MOs basis this approach, especially when the level of in phase and out of phase interactions between two MOs (2e1' and 3a1') are similar To sum up; LCAO offers a quick and reasonable way of assessing the shapes of MOs without resorting to higher level calculations and provide a reasonable assessments of energies. It is a quick and dirty method that should be treated with the same level of appreciation given its low level approximations. Notes on MO Diagram
|
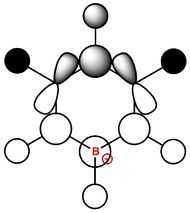
Ammonia
Population File: DOI:10042/147080
| Charge Distribution in Ammonia |
|---|
 |
Aromaticity
Benzene
Bonding Optimisation-6-31G(d,p)
Optimisation log file: DOI:10042/149866
| summary data | convergence | Jmol | |||
|---|---|---|---|---|---|

|
         Item               Value     Threshold  Converged?
 Maximum Force            0.000001     0.000015     YES
 RMS     Force            0.000000     0.000010     YES
 Maximum Displacement     0.000002     0.000060     YES
 RMS     Displacement     0.000001     0.000040     YES
 Predicted change in Energy=-6.700804D-12
 Optimization completed.
    -- Stationary point found.
|
|
Frequency Optimisation-6-31G(d,p)
Frequency file: DOI:10042/149869
| summary data | low modes |
|---|---|

|
Low frequencies --- -10.2549 -5.6651 -5.6651 -0.0056 -0.0056 -0.0012 Low frequencies --- 414.5451 414.5451 621.0429 |
| IR Spectra |
|---|
 |
Molecular Orbital Analysis
Population File: DOI:10042/151995
| MO Diagram of Benzene |
|---|
 |
Boratabenzene
Bonding Optimisation-6-31G(d,p)
Optimisation log file: DOI:10042/152270
| summary data | convergence | Jmol | |||
|---|---|---|---|---|---|

|
        Item               Value     Threshold  Converged?
 Maximum Force            0.000007     0.000015     YES
 RMS     Force            0.000002     0.000010     YES
 Maximum Displacement     0.000032     0.000060     YES
 RMS     Displacement     0.000009     0.000040     YES
 Predicted change in Energy=-4.417167D-10
 Optimization completed.
    -- Stationary point found.
|
|
Frequency Optimisation-6-31G(d,p)
Frequency file: DOI:10042/152286
| summary data | low modes |
|---|---|

|
Low frequencies --- -7.2579 -0.0006 -0.0005 0.0004 3.1967 4.5275 Low frequencies --- 371.2965 404.4162 565.0822 |
| IR Spectra |
|---|
 |
Molecular Orbital Analysis
Population File: DOI:10042/152433
Pyridinium
Bonding Optimisation-6-31G(d,p)
Optimisation log file: DOI:10042/152380
| summary data | convergence | Jmol | |||
|---|---|---|---|---|---|

|
     Item               Value     Threshold  Converged?
 Maximum Force            0.000003     0.000015     YES
 RMS     Force            0.000001     0.000010     YES
 Maximum Displacement     0.000007     0.000060     YES
 RMS     Displacement     0.000002     0.000040     YES
 Predicted change in Energy=-4.928705D-11
 Optimization completed.
    -- Stationary point found.
|
|
Frequency Optimisation-6-31G(d,p)
Frequency file: DOI:10042/152397
| summary data | low modes |
|---|---|

|
Low frequencies --- -9.4459 -3.2026 -0.0005 -0.0005 0.0008 0.1943 Low frequencies --- 391.8979 404.3391 620.1990 |
| IR Spectra |
|---|

|
Molecular Orbital Analysis
Population File: DOI:10042/152441
Borazine
Bonding Optimisation-6-31G(d,p)
Optimisation log file: DOI:10042/152804
| summary data | convergence | Jmol | |||
|---|---|---|---|---|---|

|
   Item               Value     Threshold  Converged?
 Maximum Force            0.000010     0.000015     YES
 RMS     Force            0.000005     0.000010     YES
 Maximum Displacement     0.000056     0.000060     YES
 RMS     Displacement     0.000018     0.000040     YES
 Predicted change in Energy=-3.035120D-09
 Optimization completed.
    -- Stationary point found.
|
|
Frequency Optimisation-6-31G(d,p)
Frequency file: DOI:10042/152828
| summary data | low modes |
|---|---|

|
Low frequencies --- -4.2188 -4.1715 -3.1604 -0.0036 0.0152 0.0211 Low frequencies --- 289.7299 289.7311 404.5165 |
| IR Spectra |
|---|

|
Molecular Orbital Analysis
Population File: DOI:10042/152840
Analysis and Discussion
Charge Distribution
Note: In the cases of Boratabenzene and Pyridinium; C1 is taken to be the heteroatom. In the case of Borazine, C1 is Boron. The rest of the charges are tabulated moving clockwise from C1. H1 is the Hydrogen atom attached to C1. Colour range was set at -0.3 to 0.3 for all distributions (see box in diagram above)
| Molecule | C1 | C2 | C3 | C4 | C5 | C6 | H1 | H2 | H3 | H4 | H5 | H6 | NBO Charges with Dipole Moment (Blue Arrow) |
|---|---|---|---|---|---|---|---|---|---|---|---|---|---|
| Benzene | -0.242 | -0.242 | -0.242 | -0.242 | -0.242 | -0.242 | 0.242 | 0.242 | 0.242 | 0.242 | 0.242 | 0.242 | |
| Boratabenzene | 0.198 | -0.589 | -0.257 | -0.340 | -0.257 | -0.589 | -0.094 | 0.186 | 0.183 | 0.189 | 0.183 | 0.186 | |
| Borazine | -1.091 | 0.729 | -1.091 | 0.729 | -1.091 | 0.729 | 0.432 | -0.070 | 0.432 | -0.070 | 0.432 | -0.070 | |
| Pyridinium | -0.469 | 0.061 | -0.241 | -0.130 | -0.241 | 0.061 | 0.484 | 0.289 | 0.300 | 0.295 | 0.300 | 0.289 |
|

In the following discussion electronegativity will be regularly quoted. Electronegativity is dependent on the Zeffective of an atom; which is itself dependent on nuclear charge and electron screening. Charge distributions can be explained by coupling resonance and inductive ideas, as will be explained below.
Benzene
In Benzene, the more electronegative Carbon atoms take a greater share of the electron density and this explains why there is an associated negative charge on all the Carbons in Benzene. Due to the high degree of symmetry, the charge density is equally partitioned between all six Carbons. The Hydrogens have an associated positive charge indicating a deficiency in electron density. Adding up all the charges gives a total charge of 0 which makes sense given the neutral nature of Benzene. Due to the equal balancing of charge between the Hydrogens and Carbons; we note a zero dipole moment.
Boratabenzene
Looking at the ortho- and para- Carbons, we note a much higher negative charge on them (-0.589 and -0.340 respectively) as compared to Benzene's Carbons (-0.242). This can be rationalised by looking at the resonance forms of Boratobenzene (below). The closer proximity of the ortho carbons to the boron explains why they take a greater share of the charge density (inductive effect). Also, there are more resonance forms with a formal negative charge located at the ortho site. The meta carbons are not involved in delocalisation of the negative charge by resonance and this is backed up by their similar charge density to the meta carbons in Benzene.
The Hydrogen on the Boron has a negative charge now because of its greater electronegativity compared to electropositive Boron. This means that the B-H bond has the opposite polarity to the C-H bond in benzene. Furthermore, the negative charge on the B-H proton makes it less easily lost as a proton and consequently makes boratabenzene less acidic relative to benzene.
Overall, there is a dipole moment away from the electropositive Boron atom and the sum of the charges adds up to -1 as expected.

Pyridinium
In Pyridinium the ortho carbon now has a significant deficiency of charge (0.061) compared to both benzene and boratabenzene. Additionally, the meta carbon is more charge deficient (-0.130) relative to benzene (-0.242). Once again, the reason for the relative deficiency of charge as well as the reason for why the ortho carbon has a greater deficiency can be explained using simple resonance and inductive ideas (below). As we can see, there are two resonance structures with a formal positive charge at the ortho sites, but only one at the para site. Also, the ortho carbons are closer to the more electronegative Nitrogen and consequently, will experience a greater deficiency in charge density.
Overall, there is a dipole moment towards the electron withdrawing and highly electronegative nitrogen atom and the sum of the charges adds up to +1, as expected.

Borazine
The nitrogens, being the most electronegative, take the greatest share of charge density and leave the electropositive borons with a significant deficiency in charge. Additionally, the H atoms on Nitrogen are charge deficient whilst those on Boron have a slight excess of charge. This can be understood easily by deploying simple ideas of electronegativity.
Overall, due to the symmetrical nature of the molecule there is no dipole moment and the sum of the charges adds to 0, as expected.
Effect of Substitution on Molecular Orbitals
As Boron, Carbon and Nitrogen are neighbouring elements in the same period and given that their electrons occupy atomic orbitals of similar energy levels, we can assume that their orbitals will overlap to similar extents. However, we expect to see several consequences of substituting an atom:
1.) Energy
As we go from pyridinium to benzene to boratabenzene, we would expect the energies of the MOs to increase gradually as the presence of highly electronegative nitrogen serves to stabilise the MO energies. On the other hand, electropositive boron cannot effectively stabilise the MOs through favourable electrostatic interactions. It is difficult to determine the exact effect of having equal numbers of boron and nitrogen in borazine and the consequent effect on MO energies without performing a computation.
Additionally, the greater the number of nodal planes present in an MO, the higher its energy i.e. the more destabilised it is.
2.) Degeneracy
In going from benzene (D6H) to either pyridinium or boratabenzene (both C2V), a carbon has been substituted for a heteroatom leading to a reduction in the number degenerate, irreducible representations. Hence, we would expect the degeneracy in benzene to be higher than in either pyridinium or boratabenzene.
3.) MO Shapes
Highly electronegtaive atoms are likely to attract electron density towards them leading to a bulging at certain points, whilst highly symmetric molecules might show a more even distribution. All of these points will be involved in the following MO comparison across the series of aromatic compounds.
MO Comparison
| Benzene | Boratabenzene | Pyridinium | Borazine | |
|---|---|---|---|---|
| MO | 
|

|

|

|
| LCAO (Black circle = place holder) | 
|

|

|

|
| Energy / au | -0.36288 | -0.13432 | -0.64552 | -0.36337 |
| Order | 17th | 17th | 17th | 17th |
| Degenerate? | No | No | No | No |
The above shows the HOMO-4 molecular orbital a.k.a the π totally bonding MO. It is made up of pz orbitals that show strong through space bonding to form an MO with large electron density above and below the nodal plane that lies in the plane of the molecule. They are all very similar to the π bonding MO of benzene. However, we do note, that the MO does seem to bulge at the electronegative Nitrogen atom in pyridinium. Additionally, the presence of electronegative Nitrogen, stabilises the MO to a much lower energy than all the other compounds including benzene. This explains the relative energies of the MOs as well.
There is no other possible combination of orbitals that could lead to this particular MO and this explains the lack of degeneracy across the board.
In borazine, the effects of alternating electropositive and electronegative atoms seems to cancel out leading to an even spread of the MO and consequently similar energy MOs to benzene i.e. there is no overall destabilisation or stabilisation of the MO energy. In boratabenzene the MO is distributed away from the electropositive boron as to be expected and due to its electropositivity the MO is destabilised relative to benzene.
LCAO predicts the general shape of the MO but can not determine the finer structure such as bulges around more electronegative atoms. This is since LCAO does not take into account that orbital sizes may vary as one atom pulls electron density towards it leading to a greater contribution of this atom to the MO versus all other atoms i.e. it cannot assign a weightage to orbital contribution.
| Benzene | Boratabenzene | Pyridinium | Borazine | |
|---|---|---|---|---|
| MO | 
|

|

|

|
| LCAO (Black circle = place holder) | 
|

|

|

|
| Energy / au | -0.24879 | 0.01076 | -0.48204 | -0.27685 |
| Order | 21st | 21st | 21st | 21st |
| Degenerate? | Yes | No | No | Yes |
The above MOs represent the HOMO of the concerned aromatic compounds. We now note two perpendicular nodal planes which explains why the MOs are higher than the HOMO-4 MOs. Additionally, in the molecule with C2V symmetry (pyridinium and boratabenzene) there has been a loss of degeneracy as compared to the highly symmetric D6H benzene and D3H borazine. This was discussed earlier.
In borazine, the molecule has been split unevenly by the nodal plane leading to the two electronegative nitrogens on one side taking a larger share of the MO. Benzene and pyridine have a very even distribution of the MO on either side of the nodal plane.
Boratabenzene's HOMO has a positive energy and is antibonding, this explains why the electron density and the MO are shifted towards the more electropositive boron atom which now contributes more to the overall MO. This is an overall unfavourable situation.
Once again, LCAO correctly identifies the general shape of the MO along with the presence of nodal planes but fails to assign a weightage/contribution factor to the individual atomic orbitals.
| Benzene | Boratabenzene | Pyridinium | Borazine | |
|---|---|---|---|---|
| MO | 
|

|

|

|
| LCAO (Black circle = place holder) | 
|
|

|

|
| Energy / au | -0.74488 | -0.46460 | -1.00127 | -0.83916 |
| Order | 9th | 9th | 9th | 9th |
| Degenerate? | Yes | No | No | Yes |
The above MOs correspond to the HOMO-12. Interestingly, we now see involvement of the s orbitals on the H atoms which are contributing to the overall MO by direct overlap with s orbitals on carbon. As noted before, the D6H symmetrical benzene and D3H symmetrical borazine show degeneracy at this level but the much less symmetric C2V molecules do not. All of the previous arguments regarding the highly electronegative nitrogen stabilising pyridinium compared to the others still apply.
As noted before, the presence of equal numbers of electropositive borons and electronegative nitrogens in borazine has no net effect on the stabilisation of the MO, this is because the stabilising effect of the electronegative Nitrogens are cancelled out by an equally destabilising effect from the borons.
Conclusion
We have effectively made use of Gaussian to study increasingly complex molecular system by performing bonding optimisations and vibrational analysis to confirm our optimisations are at their lowest energy. Additionally, we have linked our qualitative understanding of MO theory (LCAO) with the more quantitative measurements that may be obtained via Gaussian. Effective comparisons between the real aromatic systems and computed MOs were carried out and overall a deeper understanding of the nature of computational measurements as well as their applications in real systems was attained.