Rep:Mod:FrancisMgO
Free Energy and Thermal Expansion of MgO
Introduction
Aims
All molecules possess a series of vibrational energy levels. Macroscopic properties of materials, which consist of a number of molecules, are governed by the statistical average over the energy states the molecules are occupying. In this experiment, the vibrational modes, or phonons, of MgO are approximated using the quasi-harmonic approximation. Each vibrational mode is translationally invariant, and has a defined repeating unit. A phonon can be represented by a wave, where the wavelength depends on the length (i,e, number of atoms) of the repeating unit.[1] For example, if all atoms move towards the same direction, then λ = ∞. If adjacent atoms move in opposite directions, a repeating unit consists of two atoms, and λ = 2a, where a is the interatomic distance. A k value can also be defined for each photon, as k = 2π/λ. With the phonons calculated, the vibrational free energy and lattice parameters can subsequently be computed. Then, the thermal expansion of MgO will be investigated by computing the variations of the cell volume with temperature under the quasi-harmonic approximation. Moreover, the method of molecular dynamics will also be employed to investigate the thermal expansion of MgO, and the results obtained from the two different methods will be compared.
The System: MgO
 |
 |
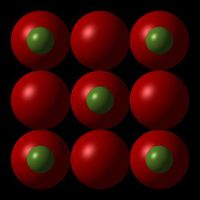
MgO has a face-centered cubic (fcc) crystal structure[2], which is also a cubic close-packed system. The dimensions of a cubic structure are defined by a single lattice parameter, since all edges are of equal length and angles between edges are 90o[3]. Since MgO consists of a 1:1 ratio of Mg and O atoms, it is a binary system. So to be specific, MgO has the rock-salt (NaCl) fcc crystal structure, which is an fcc structure with alternating Mg and O atoms in all dimensions. Figure 1.1 shows an MgO conventional cell which contains 4 atoms, all of which are lattice points. Figure 1.2 shows the smallest MgO primitive cell which contains 2 atoms.
A lattice can also be defined in reciprocal space (or k-space), with , where is a lattice vector in direct space and is a lattice vector in reciprocal space. For a direct space fcc lattice, the reciprocal lattice would be a body-centered cubic (bcc) structure. Also, similar to the Wigner-Seitz cell which could be defined as a primitive cell in direct space, the Brillouin zone can be defined as a primitive cell in reciprocal space.[4]The first Brillouin zone derived from a direct-space fcc lattice is shown in Figure 1.3, where is the origin in reciprocal space, and the indicated points are points of high symmetry.
Computation Methodology
Interaction Potentials
All computations were run with the general utility lattice programme (GULP), a programme that could be used to simulate a variety of materials, including three-dimensional periodic solids e.g. MgO. GULP uses symmetry-adapted algorithms, meaning that the symmetry of the molecule or system is constrained by its defined space group during the calculations.[5] Throughout the calculations, the following force field for MgO was applied. Mg2+ and O2- were treated as purely ionic spheres, and were given charges of +2e and -2e respectively. Only two-body interactions are taken into account; three-body interactions, and those of even higher order, are deemed negligible and hence not included in the potential. A long range electrostatic (Coloumbic) interaction potential exists between the oppositely charged ions, represented by the following equation:
Where indicates a long range potential. This electrostatic potential is proportional to the inverse of interatomic distance (). It also only takes into account two-body interactions; three-body interactions, and those of even higher order, are deemed negligible and hence not included in the potential.
Apart from the electrostatic potential, there is also a short range Buckingham potential that operates between the ions, which is represented by the following equation:
indicates a short range potential. Parameters , and are determined by statistically fitting empirical data. The first term on the right hand side corresponds to a repulsive potential, which is proportional to . The second term corresponds to Van der Waal's dispersion attraction, which is proportional to [6][7]. At high values of , both terms, especially the dispersion attraction term, will become negligible.
The total two-body interaction energy would be [7]. This interaction potential will be applied as the basis of calculations that will be done using two methods: the quasi-harmonic approximation and molecular dynamics.
Quasi-harmonic Approximation
In a lattice, consider two adjacent atoms having an equilibrium distance of . Also assume that each atom only feels the interatomic potential (and hence force) of its nearest neighbor. If each atom is allowed a displacement that is small relative to the equilibrium interatomic distance, the energy of the atom chain can be modelled by a Taylor series as follows[1][8]:
Where is the equilibrium bond length, and is the displacement from the equilibrium bond length. In this series, the first derivative term equals 0 because at the equilibrium bond length, the function has a gradient of 0. The harmonic approximation entails that at sufficiently low temperatures and small displacements, the quadratic term is dominant. Hence, the higher order derivative terms, i.e. the anharmonic terms, can be neglected. The energy of each diatomic system varies with interatomic distance in a parabolic fashion. In other words, the chain of atoms behave as a linked series of harmonic oscillators.
However, in this model the interatomic distance and energy of the system are independent of temperature. An implication is that thermal expansion cannot be accounted for. Therefore, a modification to the harmonic approximation is made, whereby anharmonicity is taken into account, but is restricted to thermal expansion. Anharmonic effects due to phonon-phonon interactions and hence damping are still assumed to be negligible.[1][9][10] The interatomic distance (and hence volume of the crystal) is now temperature-dependent, and the harmonic force constant is allowed to vary with temperature, but within each temperature the harmonic approximation holds. This modified model is called the quasi-harmonic approximation.
Molecular Dynamics
Contrary to the quasi-harmonic approximation, molecular dynamics is a classical simulation method. The forces between atoms are modelled by the long range Coloumbic potential and short range Buckingham potential as described above. First of all, an initial configuration has to be assigned to the system. This is done either by an energy minimisation algorithm, or by loading a known, pre-computed ideal structure. Then, an equilibration procedure takes place. Each atom is assigned an initial velocity that is random but among the system, the distribution of velocities of individual atoms correspond to the Boltzmann distribution at the particular temperature that is set. After the system has equilibrated and settled, molecular dynamics calculations are carried out, and on the basis of Newton's second law, [11][12][1]. The force on an atom can first be computed with the following equation:
Where represents the potential energy function experienced by atom due to the atoms in the system. Then, the acceleration experienced by atom can be computed with Newton's second law as follows:
With the acceleration, an updated velocity of atom can be computed by , and an updated position of atom by . At each time step, the above calculations are done for all atoms considered in the system, and the entire procedure is repeated every time step. Moreover, in each timestep, macroscopic properties of the system are estimated by computing the statistical averages of the microscopic properties of the atoms in consideration.
Computation Procedures
First, the lattice parameter of an MgO unit cell was computed using the designated interatomic potentials. The internal energy of an infinite MgO crystal lattice, i.e. the lattice binding energy, was also computed. Then, the vibrational modes, or phonons, of MgO were computed under the quasi-harmonic approximation. The phonon dispersion was computed by sampling 50 points along the path W(1/2, 1/4, 3/4)-L(1/2, 1/2, 1/2)-G(0, 0, 0)-X(1/2, 0, 1/2)-W-K(3/8, 3/8, 3/4) in k-space. The phonon density of states (DOS) was also computed, at shrinking factors of 1x1x1, 2x2x2, 3x3x3, 4x4x4, 8x8x8, 16x16x16, 32x32x32 and 64x64x64. Then, in order to compute the free energy of MgO under the quasi-harmonic approximation, phonon DOS calculations were done again, but this time the temperature of the system was set to 300 K, and were done at shrinking factors of 1x1x1, 2x2x2, ..., up to 16x16x16, and in addition, 32x32x32 and 64x64x64. The free energies of MgO were extracted from each DOS calculation. Afterwards, the thermal expansion of MgO was investigated under the quasi-harmonic approximation by running DOS calculations at a shrinking factor of 16x16x16, and having the temperature varied between 0 K to 1000 K in steps of 100 K. Of particular interest were the lattice parameters, cell volumes and free energies extracted from each calculation. Last but not least, the thermal expansion of MgO was investigated with classical molecular dynamics (MD) by running an MD calculation on a cell with 32 MgO units. An NPT ensemble was used, so that in each specified temperature the volume was allowed to respond and vary. Calculations were carried out with the temperature varying from 0 K to 1000 K in steps of 100 K. The remaining specifications are as follows: time step = 1.0 femtosecond, equilibration steps = 500, production steps = 500, sampling steps = 5, trajectory write steps = 5.
Results and Discussions
Vibrational modes
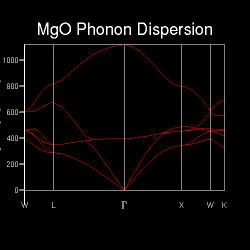
All molecules and lattice systems have distinct sets of vibrational modes, or phonons, and crystalline MgO is no exception. From a conventional cell, a cell in recriprocal space can be derived, and its first Brillouin zone. Figure shows the phonon dispersion of MgO generated by sampling points along the path W-L-G-W-X-K in k-space. These marked points are points of high symmetry within the Brillouin zone, and were selected by the programme because they are representative of the lattice. The phonon dispersion, depicted in Figure 2.1, shows the frequencies of phonons at each sampled point[13]. It can be shown that at a particular point, there are at most 6 branches of different frequencies. Literature suggests that for a 3-dimensional lattice with N atoms in a repeating unit, there will be 3N branches on its phonon dispersion. Among those 3N branches, there are 3 acoustic branches (the branches of lower frequencies) and 3N-3 optical branches (the corresponding branches of higher frequencies)[14]. In this particular case of 3-dimensional crystalline MgO, in each dimension there are two possible vibrational modes: that both Mg and O displace to the same direction, and Mg and O displacing to opposite directions. These give rise to two different phonon frequencies in each dimension, and in 3 dimensions this gives rise to 6 phonon frequencies. Moreover, it is also observed that at certain points long the sampled path, especially at the points of high symmetry, some phonons converge to the same frequency. This implies that due to the symmetry of the Brillouin zone, at certain points the vibrational modes become degenerate.
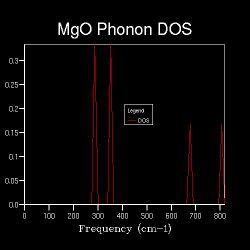
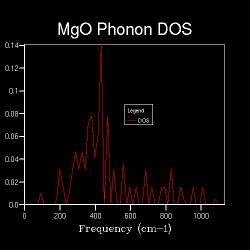
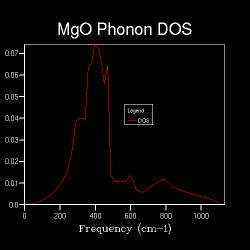
Apart from the phonon dispersion along the specified path, the phonon density of states at certain particular points in the Brillouin zone (k-points) are also computed. The DOS between ν and ν+δv, where δv is an infinitesimal change in frequency, is defined as the number of phonon states in ν+δv. An implication is that the DOS is proportional to the inverse of the gradient at the particular frequency on the phonon dispersion[13]. Also, a parameter in the DOS calculations is the shrinking factor, where the higher the shrinking factor the more fractions the Brillouin zone is sliced into, i.e. the larger the k-space grid size. Hence, more points will be sampled. In the first case where the k-space grid size is 1x1x1, the Brillouin zone is not spliced at all, and only one point is sampled. Figure 2.2 shows the corresponding DOS, which shows 4 distinct peaks at 286 cm-1, 351 cm-1, 676 cm-1 and 806 cm-1 respectively. This can be referred back to the phonon dispersion, where at point L, there are four corresponding phonons at approximately the above frequencies. Also, at point L, the four branches have approximately zero gradient. These indicate that the one point that is sampled for the DOS is point L in k-space.
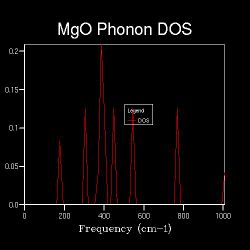
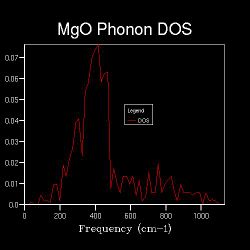
When the k-space grid size is increased to 2x2x2, the Brillouin zone is spliced into 8 fractions, and more points are sampled for the DOS. Figure shows 2.3 more distinct peaks than the 1x1x1 DOS. Even more points are sampled when the shrinking factor further increases, and as long as the k-space grid size is higher than 1x1x1, the DOS represents the average, normalised number of phonon modes that lie in the frequencies of ν+δv. It is worth nothing that the point sampled in the DOS of shrinking factor 1x1x1 is also sampled in that of shrinking factor 2x2x2; the points sampled in the DOS of shrinking factor 2x2x2 are also sampled in that of shrinking factor 4x4x4 etc. This is the reason behind increasing the shrinking factor, and hence the k-space grid size, by multiplying 2 in each dimension each time a more detailed DOS is run.
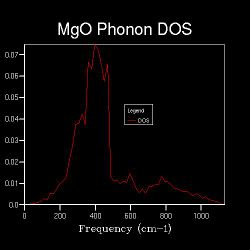
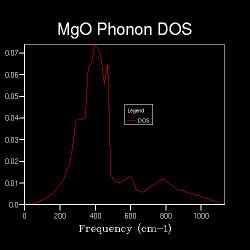
Figures 2.3 to 2.8 show that when the k-space grid size is increased from 2x2x2 to 4x4x4, even more distinct peaks appear in the DOS. However, when the k-space grid size further increases, there appears to be no additional peaks in the DOS; instead, the DOS starts to smoothen. This smoothening process continues until the shrinking factor becomes 32x32x32. Further changes to the DOS when the shrinking factor is increased to 64x64x64 are barely noticeable. Hence, it can be concluded that a good approximation to the phonon DOS of 3-dimensional MgO can be achieved with a k-space grid size of 32x32x32. In general, the higher the shrinking factor (i.e. k-space grid size), the more points are sampled in the Brillouin zone in DOS calculations, and more possible vibrations are sampled. Hence, the computed phonon DOS would be a better approximation of the real DOS picture. Since more points on the W-L-G-W-X-K path are sampled, the computed phonon DOS would also be of better agreement to the computed phonon dispersion.
 |
 |
 |
 |
 |
 |
Free energies
| Shrinking factor | Free energy (eV) |
|---|---|
| 1x1x1 | -40.930301 |
| 2x2x2 | -40.926609 |
| 3x3x3 | -40.926432 |
| 4x4x4 | -40.926450 |
| 5x5x5 | -40.926463 |
| 6x6x6 | -40.926471 |
| 7x7x7 | -40.926475 |
| 8x8x8 | -40.926478 |
| 9x9x9 | -40.926479 |
| 10x10x10 | -40.926480 |
| 11x11x11 | -40.926481 |
| 12x12x12 | -40.926481 |
| 13x13x13 | -40.926482 |
| 14x14x14 | -40.926482 |
| 15x15x15 | -40.926482 |
| 16x16x16 | -40.926482 |
| 32x32x32 | -40.926483 |
| 64x64x64 | -40.926483 |
When the phonon DOS calculations were done with a specified temperature, the free energy of the lattice can also be computed (at the designated shrinking factor). At 300 K, the lattice free energy computed at different shrinking factors are shown in the table on the right hand side.
The accuracy of the computed free energy values increases as the shrinking factor increases, i.e. when the grid size is smaller and more points are sampled for the DOS. Calculations with shrinking factors of 2x2x2 onwards are accurate to 0.5 meV; those with shrinking factors of 3x3x3 onwards are accurate to 0.1 meV. As the shrinking factor further increases, the calculated free energy values converge towards -40.926483 eV.
The free energy is lowest when only 1 k-point is sampled. It then increases until a maximum is reached when the k-space grid size is 3x3x3. Afterwards, the free energy decreases and converges.An explanation for this trend is attempted. The first and only k-point sampled is L(1/2, 1/2, 1/2) when the k-space grid size is 1x1x1. This is a point of high symmetry, and the vibrational modes are of lower energy. The average value of the vibrational frequencies at this k-point, counting degenerate modes as separate, is 462.59 cm-1. When the k-space grid size is 2x2x2, the 4 sampled k-points are of lower symmetry, and the vibrational modes are of higher energy. The average value of the vibrational frequencies at these 4 k-points, again counting degenerate modes as separate, is 468.01 cm-1, which is higher in energy than the 1x1x1 vibrational modes. Hence, the free energy increases from that of the 1x1x1 k-space grid size.
The average vibrational frequency from the sampled k-points starts to drop when the k-space grid size moves from 3x3x3 to 4x4x4, hence the drop in computed free energy. Also, as the k-space grid size further increases, the number of sampled k-points increases exponentially. As a lot more k-points are sampled across the Brillouin zone, the accuracies of DOS and free energy calculations would vastly increase. The difference between the computed free energy values between two consecutive grid sizes would also decrease as grid size increases. This explains the convergence of the free energy towards the ideal value where an infinite number of k-points are sampled.
Thermal expansion
Thermal expansion is a behaviour characterised by an increase in volume of matter in response to an increase in temperature. Its physical origin is that the average kinetic energy of matter is a function of temperature. When a particular substance, such as crystalline MgO is heated up, its average kinetic energy increases, and the fundamental units (in this case, Mg and O atoms) will tend to vibrate more vigorously. The distance maintained between atoms would increase, and so will the overall volume of the substance. In this experiment, thermal expansion is simulated within the quasi-harmonic approximation and with molecular dynamics calculations.
Quasi-harmonic approximation
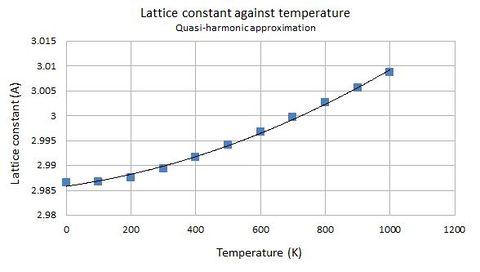
In the quasi-harmonic approximation, the lattice parameter and hence volume are dependent on temperature. The following figures depict the relationships of lattice parameter and volume against temperature respectively. The values were calculated by an optimisation procedure, where the programme computes the geometry of the cell that gives the lowest energy.
| Temperature (K) | Lattice parameter (Å) |
|---|---|
| 0 | 2.986563 |
| 100 | 2.986657 |
| 200 | 2.987605 |
| 300 | 2.989391 |
| 400 | 2.991631 |
| 500 | 2.994137 |
| 600 | 2.996822 |
| 700 | 2.999646 |
| 800 | 3.002591 |
| 900 | 3.005638 |
| 1000 | 3.008787 |
| Temperature (K) | Volume per formula unit (Å3) |
|---|---|
| 0 | 18.836496 |
| 100 | 18.838267 |
| 200 | 18.856203 |
| 300 | 18.890027 |
| 400 | 18.932509 |
| 500 | 18.980114 |
| 600 | 19.031225 |
| 700 | 19.085060 |
| 800 | 19.141320 |
| 900 | 19.199643 |
| 1000 | 19.260047 |
 |
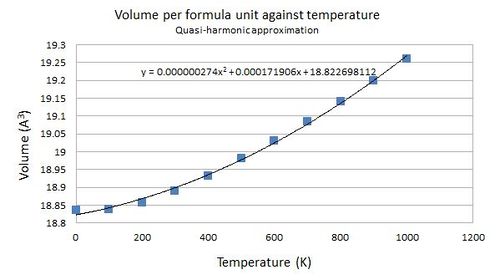 |
Both the lattice parameter and volume generally follows a parabolic model against temperature. In particular, volume and temperature are related by this equation: [explanation]
| Temperature (K) | Volume (Å3) | α (10-5 K-1) |
|---|---|---|
| 0 | 18.83650 | 0.912622 |
| 100 | 18.83827 | 1.20343 |
| 200 | 18.85620 | 1.49291 |
| 300 | 18.89003 | 1.78034 |
| 400 | 18.93251 | 2.06579 |
| 500 | 18.98001 | 2.34933 |
| 600 | 19.03123 | 2.63097 |
| 700 | 19.08506 | 2.91069 |
| 800 | 19.14132 | 3.18842 |
| 900 | 19.19967 | 3.46416 |
| 1000 | 19.26005 | 3.73782 |
For a system, the thermal expansion coefficient can be defined as follows[15]:
Where is the volume at a particular temperature. Physically, represents the increase in volume of the system with respect to its original volume when a temperature increase of is applied. The calculations for are done in constant pressure, which in reality is also a good assumption for a solid system. To calculate at various temperatures, firstly is as follows:
Then, the value of at each temperature can be calculated by substituting the respective values of volume and temperature into the equation . The results are tabulated on the right hand side. It can be shown that the thermal expansion coefficient increases as temperature rises in the quasi-harmonic approximation. Mathematically this is due to the parabolic nature of the relationship between and temperature, and the gradient of this curve increases as temperature increases.
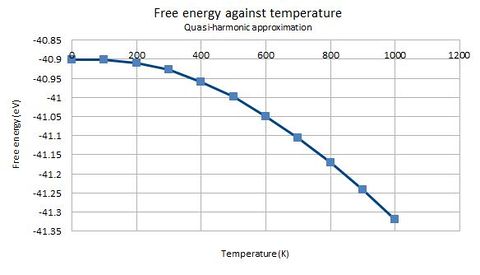
Apart from the lattice parameter and volume, the variation in free energy with temperature is also plotted and depicted in the following graph.
In the quasi-harmonic approximation, the Helmholtz free energy is defined by the following equation[1]:
Where is the partition function, is the potential energy of the crystal lattice, and is the sum of zero-point energies across all interatomic harmonic pair potentials. As the temperature increases, the term approaches 1, and the term becomes more negative. Hence, the free energy decreases at an increasing rate when temperature is increased. This is in contrast to the classical conditions, where internal energy is directly proportional to temperature, and the decrease in free energy with temperature would be linear.
Molecular dynamics
The volume of the supercell with 32 MgO units under investigation was computed under molecular dynamics conditions at various temperatures. The obtained values were also divided by 32 to yield the volume of one single MgO primitive cell, so as to allow a meaningful comparison between values obtained from the two computation methods to be made. Note that the programme does not allow a calculation to be done at T = 0 K, since at classical conditions a temperature at 0 K means there are no kinetic energy in the system at all, so the atoms will not move and no molecular dynamics calculations can be done.
| Temperature (K) | Volume of 32 MgO units (Å3) | Cell volume per formula unit (Å3) |
|---|---|---|
| 100 | 599.513295 | 18.7347905 |
| 200 | 601.241595 | 18.7887998 |
| 300 | 602.899441 | 18.8406075 |
| 400 | 604.609431 | 18.8940447 |
| 500 | 606.322864 | 18.9475895 |
| 600 | 608.166535 | 19.0052042 |
| 700 | 610.085241 | 19.0651638 |
| 800 | 612.102518 | 19.1282037 |
| 900 | 614.060747 | 19.1893983 |
| 1000 | 615.635320 | 19.2386038 |
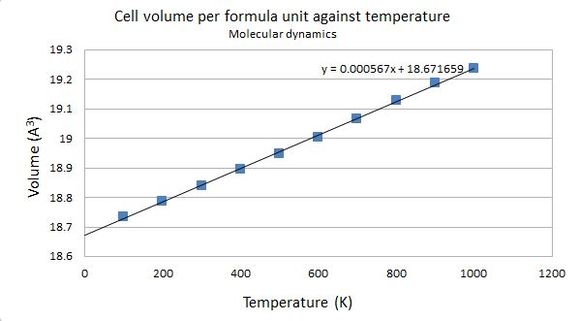
Figure shows that using molecular dynamics calculations, the volume increases with temperature in an approximately linear fashion. As with calculations done under the quasi-harmonic approximation, the thermal expansion coefficient at various temperatures can also be calculated. The relationship between the cell volume per formula unit and temperature is fitted with the following equation:
Hence, .
The table below shows the values of α at various temperatures.
| Temperature (K) | α (10-5 K-1) |
|---|---|
| 100 | 3.02645 |
| 200 | 3.01776 |
| 300 | 3.00946 |
| 400 | 3.00095 |
| 500 | 2.99247 |
| 600 | 2.98339 |
| 700 | 2.97401 |
| 800 | 2.96421 |
| 900 | 2.95476 |
| 1000 | 2.94620 |
Comparing the calculations done under the quasi-harmonic approximation and molecular dynamics conditions
The results obtained from computations under the quasi-harmonic approximation and molecular dynamics conditions respectively are compared here. The following two graphs show the variation of cell volume per formula unit and thermal expansion with temperature respectively, with results from the two sets of conditions plotted together.
 |
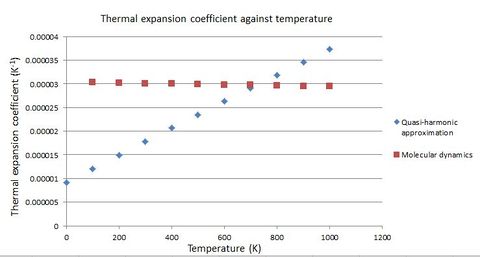 |
The volume has a roughly parabolic relationship with temperature for the quasi-harmonic approximation calculations, while the relationship is linear for molecular dynamics calculations. Therefore, the difference in the computed volume per formula unit is pronounced at both high and low temperatures. On the other hand, slightly decreases with temperature for molecular dynamics calculations, since is constant and V increases with temperature. However, rises significantly with temperature under quasi-harmonic approximation conditions, since even though volume decreases with temperature, increases vastly due to the parabolic nature of V(T). Hence, the difference in computed values for is also pronounced at the high and low temperature ranges.
At high temperatures, calculations done under molecular dynamics conditions are more accurate than those done under the quasi-harmonic approximation. This is because the quasi-harmonic approximation neglected anharmonic effects except those induced by thermal expansion[16]. In other words, the terms of order 3 and above in the Taylor series are ignored. At high temperatures anharmonic effects become significant enough, and the terms contribute considerably to the overall internal energy. The function of U(T) is less parabolic at high temperatures. On the other hand, molecular dynamics computations take into account anharmonicity at high temperatures. Also, the quantum effects that can only be accounted for by the quasi-harmonic approximation (which will be discussed in the next paragraph) are insignificant at high temperatures. Literature regarding the study of perovskites also suggested that the system would break down under the quasi-harmonic approximationeven before reaching the melting temperature[16].
At lower temperatures, however, quantum effects become significant[17]. The quasi-harmonic approximation, a quantum mechanical model, takes into account the zero point energy, which is the internal energy possessed by a system at 0 K where no vibrations are taking place and the interatomic separation sits at the equilibrium bond length. The origin of the zero point energy comes from the uncertainty principle, where the system has to have non-zero energy if it is to be confined in a certain space (i.e. the equilibrium interatomic distance). This is not accounted by molecular dynamics calculations[17][1], since it is a classical simulation method. Under classical conditions, the internal energy of a system is directly proportional to its temperature. At 0 K, the system would have no energy. Therefore, at low temperatures the calculations done under the quasi-harmonic approximation are more accurate.
Conclusion
The phonon dispersion across the first Brillouin zone, and subsequently the phonon DOS at various numbers of k-points for an MgO conventional cell were computed under the quasi-harmonic approximation. The changes to the DOS are no longer distinct after the grid size reaches 4x4x4, where further increases in grid size would only smoothen the DOS and provide a more accurate weighted average. The change in free energy with k-space grid size was monitored, which was found to have a degree of accuracy of 0.1 meV when k-space grid size reaches 3x3x3, and would converge as grid size further increases. Moreover, the thermal expansion of MgO was investigated by monitoring the changes of the lattice parameter, cell volume and free energy with temperature, under both the quasi-harmonic approximation and molecular dynamics conditions. Values for thermal expansion coefficients were calculated at various temperatures. Last but not least, the accuracy of the both computation methodologies was evaluated. It was concluded that while the quasi-harmonic approximation calculations yield more accurate results at low temperatures, molecular dynamics calculations were more accurate at high temperatures.
However, the statistical uncertainty in the computations carried out are worth noting. All decimal places were directly taken from the output values of the software, but by doing so we are ignoring the limit of statistical uncertainty. In other words, some decimal places might have no statistical significance (because they no longer accurately describe the physical system), but are still taken into account in the above analysis. Hence, the precision of the presented results might be overestimated. Also, we only used a supercell containing 32 MgO units for molecular dynamics calculations, but quasi-harmonic calculations suggest that in order to achieve an accuracy of 0.01 meV on free energy computations, a k-point grid size of 7x7x7 was required. This corresponds to a 7x7x7 MgO supercell in molecular dynamics calculations, which consists of 343 MgO units. This implies a room for improvement for the accuracy of the molecular dynamics calculations carried out, which comes with a price of computational time and resources.
Regarding the comparison between the quasi-harmonic approximation and molecular dynamics calculations, one effect we have not investigated is the ability of modelling first-order phase transitions. For calculations done under the quasi-harmonic approximation, phase transitions cannot be accounted for, since ultimately the factor that link atoms together is the harmonic force constant. It is allowed to vary with temperature, but the relationship does not allow for phase transitions where bonds are broken and interatomic distances are vastly increased, which significantly lowers the harmonic force constant. For molecular dynamics calculations, however, theoretically first-order phase transitions can be modelled and accounted for. Since the melting point of MgO is approximately 2800oC, though, the calculations carried out were far from the region where phase transitions and its associated reduction in symmetry would be observed.
Finally, literature[17] suggested an improved computation method that combines the advantages of both. This method fundamentally uses principles and conditions of molecular dynamics, but on top of that, a quantum correction procedure is applied. At high temperatures, since the quantum effects are insignificant, a high accuracy can be reasonably achieved. However, at low temperatures, this method would require a huge amount of computation resources, since the quantum effects to be corrected for are significant.
Bibliography
- ↑ 1.0 1.1 1.2 1.3 1.4 1.5 M. T. Dove, "Introduction to Lattice Dynamics", Cambridge: Cambridge University Press, 1993.
- ↑ T. S. Duffy , R. J. Hemley , and H. Mao, "Equation of State and Shear Strength at Multimegabar Pressures: Magnesium Oxide to 227 GPa", Phys. Rev. Lett., 1995, 74, 1371.DOI:10.1103/PhysRevLett.74.1371
- ↑ P.W. Atkins, T. L. Overon, J. P. Rourke, M. T. Weller, and F.A. Armstrong, "Inorganic Chemistry", 5th ed., Great Britain: Oxford University Press, 2010.
- ↑ A. P. Sutton, "Electronic Structure of Materials", Great Britain: Oxford Science Publications, 1993.
- ↑ J. D. Gale, "GULP: A computer program for the symmetry-adapted simulation of solids", J. Chem. Soc., Faraday Trans., 1997, 93(4), 629-637.DOI:10.1039/A606455H
- ↑ T. S. Bush, J, D. Gale, R. A. Catlow, and P. D. Battle, "Self-consistent Interatomic Potentials for the Simulation of Binary and Ternary Oxides", J. Mater. Chem., 1994, 4(6), 831-837.DOI:10.1039/JM9940400831
- ↑ 7.0 7.1 , M. Nadeem, M. J. Akhtar, R. Shaheen, and M. N. Haque, "Interatomic Potentials for Some Binary Oxides", J. Mater. Sci. Technol., 2001, 17(6), 638-642.
- ↑ S. Baroni, P. Giannozzi, and E. Isaev, "Thermal Properties of Materials from Ab Initio Quasi-Harmonic Phonons", Rev. Mineral. Geochem., 2009, 71, 3-19.DOI:10.2138/rmg.2010.71.3
- ↑ K. Ishikawa, "On the Quasi-Harmonic Theory of Phonons", Phys. Stat. Sol., 1967, 21, 137-144.DOI:10.1002/pssb.19670210111
- ↑ G. P. Srivastava, "The Physics of Phonons", New York: Taylor and Francis Group, 1990.
- ↑ M. P. Allen, "Computational Soft Matter: From Synthetic Polymers to Proteins", Julich: John von Neumann Institute for Compuring, 2004.
- ↑ A. Kukol (Eds.), "Molecular Modelling of Proteins", Totowa: Humana Press, 2008.
- ↑ 13.0 13.1 R. Hoffmann, "How Chemistry and Physics Meet in the Solid State", Angew. Chem. Int. Ed., 1987, 26(9), 846-878.DOI:10.1002/anie.198708461
- ↑ E. D. Palik (Eds.), "Handbook of Optical Constants of Solids", San Diego: Academic Press, Inc., 1985.
- ↑ D.L. Turcotte, and G. Schubert, "Geodynamics", 3rd ed., Cambridge: Cambridge University Press, 2014.
- ↑ 16.0 16.1 M. Matsui, G. D. Price, and A. Patel, "Comparison between the lattice dynamics and molecular dynamics: calculation results form MgSiO3 perovskite", Geophys. Res. Lett., 1994, 21(15), 1659-1662.DOI:10.1029/94GL01370
- ↑ 17.0 17.1 17.2 M. Matsui, "Molecular dynamics study of the structural and thermodynamic properties of MgO crystal with quantum correction", J. Chem. Phys., 1989, 91, 489-494.DOI:10.1063/1.457484
