
Rep:Mod:FSPhysical
3rd Year Computational Laboratory: Module 3
The Cope rearrangement - Optimising the reactants and products
(a)
- 1,5-hexadiene with anti-linkage: http://hdl.handle.net/10042/20995
Item table:
         Item               Value     Threshold  Converged?
 Maximum Force            0.000060     0.000450     YES
 RMS     Force            0.000010     0.000300     YES
 Maximum Displacement     0.000453     0.001800     YES
 RMS     Displacement     0.000171     0.001200     YES
 Predicted change in Energy=-2.037023D-08
 Optimization completed.
    -- Stationary point found.
- Energy: -231.69253528 a.u.
- Point group: Ci
(b)
- 1,5-hexadiene with gauche-linkage: http://hdl.handle.net/10042/21000
Item table
         Item               Value     Threshold  Converged?
 Maximum Force            0.000016     0.000450     YES
 RMS     Force            0.000003     0.000300     YES
 Maximum Displacement     0.000413     0.001800     YES
 RMS     Displacement     0.000130     0.001200     YES
 Predicted change in Energy=-1.902824D-09
 Optimization completed.
    -- Stationary point found.
- Energy: -231.69266122 a.u.
- Point group: C1
- The energy of the gauche conformation would be comparable to the energy of the antiperiplanar conformation due to the worse orbital overlap of single bonds (lower stabilisation energy) and higher steric congestion leading to increase in energy but more H-H attractive interactions leading to decrease in energy. As the chain contains only 6 carbons and hence not many hydrogens in the approximately 2.4 Å distance which would give attractive dispersion forces, a lower energy of the antiperiplanar conformation would be expected. In fact, it is the gauche conformation which is lower in energy by 0.00012594 a.u. = 0.33 kJ/mol. This can be explained by allowing two instead of one πC=C→σ*C-H and σC-H→π*C=C favourable interactions at each end of the molecule. This is known as the A1,3 eclipsed conformation.1
[1] Prof. H. Rzepa, Conformational analysis, Lecture notes, σ-π Conjugations
(c)
- From the analysis above, a gauche conformation can be lower in energy than the antiperiplanar one due to A1,3 eclipsed interactions. What makes one gauche conformation energetically more favourable over another is the number of H-H attractive dispersion forces. The way to maximize their number is to put carbons in a U-shape so that there is the maximal number of hydrogens close to each other and there are also present the eclipsed interactions. The pictures below show the initial U-shape (left), cleaning reassuring the optimal position of hydrogens and double bonds (middle) and final optimised (http://hdl.handle.net/10042/21000) molecule (right) which should be lowest in energy. After inspection of the apendix table, it is found that this structure is indeed the lowest one.


(d)
- The antiperiplanar structure matches the anti2 structure from the Apendix 1 table and has got the point group Ci
- The gauche structure matches the gauche3 structure from the Apendix 1 table and has got the point group C1. This is according to the table the lowest energy conformation.
(e)
- The first structure found was indeed the anti2 one with details described in part (a)
(f)
- 1,5-hexadiene with anti-linkage optimised at B3LYP/6-31G* level: http://hdl.handle.net/10042/21028
Item table:
         Item               Value     Threshold  Converged?
 Maximum Force            0.000015     0.000450     YES
 RMS     Force            0.000006     0.000300     YES
 Maximum Displacement     0.000180     0.001800     YES
 RMS     Displacement     0.000076     0.001200     YES
 Predicted change in Energy=-1.512876D-08
 Optimization completed.
    -- Stationary point found.
- Energy: -234.61170663 a.u.
- Point group: Ci remains the same
- ΔE = -2.91917135 a.u. = -7664.3 kJ/mol
- The overall structure has not changed much (is of the same symmetry), only the C-C-C angles widened in the structure optimised with more accurate basis set (125.3° vs 124.8° for C=C-C angle and 112.7° vs 111.3° for C-C-C angle). Hydrogens have not changed their positions. The refined structure may be lower in energy due to better H-H dispersion forces and orbital overlap in A1,3 eclipsed interactions.
(g)
- 1,5-hexadiene with anti-linkage, frequency analysis at B3LYP/6-31G* level: http://hdl.handle.net/10042/21041
Item table:
         Item               Value     Threshold  Converged?
 Maximum Force            0.000030     0.000450     YES
 RMS     Force            0.000013     0.000300     YES
 Maximum Displacement     0.000226     0.001800     YES
 RMS     Displacement     0.000101     0.001200     YES
 Predicted change in Energy=-1.412925D-08
 Optimization completed.
    -- Stationary point found.
- No negative frequencies:
Low frequencies ---  -10.8430   -4.0835    0.0004    0.0008    0.0009   17.4368
 Low frequencies ---   72.2451   80.0411  120.8640
IR spectrum:

 Sum of electronic and zero-point Energies=           -234.469207
 Sum of electronic and thermal Energies=              -234.461851
 Sum of electronic and thermal Enthalpies=            -234.460907
 Sum of electronic and thermal Free Energies=         -234.500819
The Cope rearrangement - Optimising the 'chair' and 'boat' transition structures
(a)
- allyl fragment: http://hdl.handle.net/10042/21053
Item table:
         Item               Value     Threshold  Converged?
 Maximum Force            0.000292     0.000450     YES
 RMS     Force            0.000121     0.000300     YES
 Maximum Displacement     0.001737     0.001800     YES
 RMS     Displacement     0.000873     0.001200     YES
 Predicted change in Energy=-1.428021D-06
 Optimization completed.
    -- Stationary point found.
(b)
- allyl fragments transition state: http://hdl.handle.net/10042/21058
Item table:
         Item               Value     Threshold  Converged?
 Maximum Force            0.000033     0.000450     YES
 RMS     Force            0.000008     0.000300     YES
 Maximum Displacement     0.000630     0.001800     YES
 RMS     Displacement     0.000107     0.001200     YES
 Predicted change in Energy=-7.528640D-08
 Optimization completed.
    -- Stationary point found.
Low frequencies --- -817.9466   -6.1297   -3.8402   -3.0374   -0.0009   -0.0004
 Low frequencies ---    0.0005  209.4454  395.9921
 ******    1 imaginary frequencies (negative Signs) ******
- A part of the view file above shows the imaginary frequency was calculated to be -818 cm-1 and the vibration corresponding to Cope rearrangement is animated below:

(c)
- allyl freeze coordinate optimisation: http://hdl.handle.net/10042/21065
Item table:
         Item               Value     Threshold  Converged?
 Maximum Force            0.000216     0.000450     YES
 RMS     Force            0.000084     0.000300     YES
 Maximum Displacement     0.003819     0.001800     NO
 RMS     Displacement     0.000724     0.001200     YES
 Predicted change in Energy=-8.960036D-06
(d)
- allyl derivative coordinate optimisation: http://hdl.handle.net/10042/21076
Item table:
         Item               Value     Threshold  Converged?
 Maximum Force            0.000038     0.000450     YES
 RMS     Force            0.000013     0.000300     YES
 Maximum Displacement     0.001608     0.001800     YES
 RMS     Displacement     0.000413     0.001200     YES
 Predicted change in Energy=-6.958117D-07
 Optimization completed.
    -- Stationary point found.
- N.B. The one displacement which did not converge is not important as long as it does not differ from the threshold value by much and the forces are converged. There are no negative frequencies except the one present also in part (b).
Low frequencies --- -818.0280   -4.7394   -4.4493   -0.0009   -0.0007   -0.0005
 Low frequencies ---    3.8655  209.4967  396.2075
 ******    1 imaginary frequencies (negative Signs) ******
 Harmonic frequencies (cm**-1), IR intensities (KM/Mole), Raman
- bond lengths in part (b) and part (d) are both 2.02 Å. In part (d) they are slightly shorter but the difference would only be seen if the numbers were rounded to 4th decimal place. Apart from this, the structures appear the same.
(e)
- Failed job Chair conformation:

- Boat conformation: http://hdl.handle.net/10042/21099
Item table
         Item               Value     Threshold  Converged?
 Maximum Force            0.000076     0.000450     YES
 RMS     Force            0.000026     0.000300     YES
 Maximum Displacement     0.006329     0.001800     NO
 RMS     Displacement     0.002094     0.001200     NO
 Predicted change in Energy=-7.986370D-07
Low frequencies --- -840.2605   -3.5031   -0.0007   -0.0004   -0.0003    0.7726
 Low frequencies ---    6.2725  155.4209  382.3252
 ******    1 imaginary frequencies (negative Signs) ******
(f)
- Energy of the last point on IRC on .log file: -231.68863886 a.u., and on .chk file: -231.68904673 a.u.
Method (i)
Summary table:
IRC4 (i)
File Name = IRC4 (i)
File Type = .log
Calculation Type = FREQ
Calculation Method = RHF
Basis Set = 3-21G
Charge = 0
Spin = Singlet
E(RHF) = -231.69166702 a.u.
RMS Gradient Norm = 0.00000247 a.u.
Imaginary Freq = 0
Dipole Moment = 0.3805 Debye
Point Group = C1
Job cpu time:  0 days  0 hours  0 minutes 33.3 seconds.
Item table
         Item               Value     Threshold  Converged?
 Maximum Force            0.000004     0.000450     YES
 RMS     Force            0.000002     0.000300     YES
 Maximum Displacement     0.000637     0.001800     YES
 RMS     Displacement     0.000195     0.001200     YES
 Predicted change in Energy=-1.373300D-09
 Optimization completed.
    -- Stationary point found.
Low frequencies ---   -0.6370   -0.1447    0.0003    0.0005    0.0006    1.5378
 Low frequencies ---   63.6151   98.2242  113.3773
Method (ii)
- The number of points was set to 150 but again only 26 of them were depicted on the .chk file. The energies on both .chk and .log files are the same as determined for the calculation involving only 50 points. The details of the calculaton can be found here: http://hdl.handle.net/10042/21135
- The subsequent optimisation to a minimum hence yielded the same structure and energy as the method (i). The datails can be found here: http://hdl.handle.net/10042/21137
Summary table:
IRC (iia)
File Name = IRC (iia)
File Type = .log
Calculation Type = FREQ
Calculation Method = RHF
Basis Set = 3-21G
Charge = 0
Spin = Singlet
E(RHF) = -231.69166702 a.u.
RMS Gradient Norm = 0.00000247 a.u.
Imaginary Freq = 0
Dipole Moment = 0.3805 Debye
Point Group = C1
Job cpu time:  0 days  0 hours  0 minutes 33.3 seconds.
Item table:
Item               Value     Threshold  Converged?
 Maximum Force            0.000004     0.000450     YES
 RMS     Force            0.000002     0.000300     YES
 Maximum Displacement     0.000637     0.001800     YES
 RMS     Displacement     0.000195     0.001200     YES
 Predicted change in Energy=-1.373299D-09
 Optimization completed.
    -- Stationary point found.
Low frequencies ---   -0.6370   -0.1447    0.0004    0.0006    0.0009    1.5378
 Low frequencies ---   63.6151   98.2242  113.3773
Cartesian Forces:  Max     0.002365566 RMS     0.000679611
 IRC-IRC-IRC-IRC-IRC-IRC-IRC-IRC-IRC-IRC-IRC-IRC-IRC-IRC-IRC-IRC-IRC-IRC
 Error in corrector energy =          -0.0000163226
 Magnitude of corrector gradient =     0.0048826880
 Magnitude of analytic gradient =      0.0047084848
 Magnitude of difference =             0.0036413346
 Angle between gradients (degrees)=   44.5785
 Reaction path inflection point has been passed.
   Previous lowest Hessian eigenvalue=   -0.0001301358
   Current lowest Hessian eigenvalue =    0.0002230544
 Pt 26 Step number  20 out of a maximum of  20
 CORRECTOR INTEGRATION CONVERGENCE:
   Recorrection delta-x convergence threshold:    0.010000
   Delta-x Convergence NOT Met
 Maximum number of corrector steps exceded.
 Error termination via Lnk1e in /apps/gaussian/g09_c01/g09/l123.exe at Tue Oct 23 16:36:29 2012.
 Job cpu time:  0 days  0 hours 14 minutes 32.1 seconds.
 File lengths (MBytes):  RWF=     16 Int=      0 D2E=      0 Chk=      3 Scr=      1
- The number of fully converged steps can be increased from 26 by either increasing the number of iterations per step from 20 to say 40 or by calculating the second derivatives more ofter to make sure the direction of the path is correct. This may be done using 'recalc=10' function.
Method (iii)
- The details of the calculation involving determination of force constants at each step can be found here: http://hdl.handle.net/10042/21153
- 44 intermediate structures were found and optimisation of the last gave the same energy as obtained before using the other 2 methods. Details of optimisation can be found here: http://hdl.handle.net/10042/21154
Summary table:
IRC (iiia)
File Name = IRC (iiia)
File Type = .log
Calculation Type = FREQ
Calculation Method = RHF
Basis Set = 3-21G
Charge = 0
Spin = Singlet
E(RHF) = -231.69166702 a.u.
RMS Gradient Norm = 0.00000475 a.u.
Imaginary Freq = 0
Dipole Moment = 0.3806 Debye
Point Group = C2
Job cpu time:  0 days  0 hours  0 minutes 26.0 seconds.
Item table:
Item               Value     Threshold  Converged?
 Maximum Force            0.000010     0.000450     YES
 RMS     Force            0.000003     0.000300     YES
 Maximum Displacement     0.000166     0.001800     YES
 RMS     Displacement     0.000049     0.001200     YES
 Predicted change in Energy=-2.172100D-09
 Optimization completed.
    -- Stationary point found.
Low frequencies ---   -1.3090   -0.8695   -0.0074    0.0039    0.0052    1.4017
 Low frequencies ---   63.6551   98.2278  113.3916
Summary
- The plots of energy vs reaction coordinate for methods (i) - left, (ii) - middle and (iii) - right can be found below:
.svg)
.svg)
.svg)
- From the calculated minimum energy of -231.69166702 a.u. and table of energies and conformations in Apendix 1 it can be concluded that the initial conformation is gauche2.
(g)
Chair
Item table:
optimisation: http://hdl.handle.net/10042/21164
         Item               Value     Threshold  Converged?
 Maximum Force            0.000016     0.000450     YES
 RMS     Force            0.000007     0.000300     YES
 Maximum Displacement     0.001568     0.001800     YES
 RMS     Displacement     0.000277     0.001200     YES
 Predicted change in Energy=-1.135493D-07
 Optimization completed.
    -- Stationary point found.
frequency: http://hdl.handle.net/10042/21165
Item table:
Item               Value     Threshold  Converged?
 Maximum Force            0.000073     0.000450     YES
 RMS     Force            0.000023     0.000300     YES
 Maximum Displacement     0.002540     0.001800     NO
 RMS     Displacement     0.000628     0.001200     YES
 Predicted change in Energy=-2.340496D-07
 Low frequencies --- -569.3573  -22.2231   -7.7496    0.0009    0.0010    0.0013
 Low frequencies ---   25.4747  195.0752  262.4381
 ******    1 imaginary frequencies (negative Signs) ******
Boat
optimisation: http://hdl.handle.net/10042/21174
Item table:
         Item               Value     Threshold  Converged?
 Maximum Force            0.000009     0.000450     YES
 RMS     Force            0.000003     0.000300     YES
 Maximum Displacement     0.000149     0.001800     YES
 RMS     Displacement     0.000053     0.001200     YES
 Predicted change in Energy=-2.714563D-09
 Optimization completed.
    -- Stationary point found.
frequency: http://hdl.handle.net/10042/21177
Item table:
Item               Value     Threshold  Converged?
 Maximum Force            0.000009     0.000450     YES
 RMS     Force            0.000004     0.000300     YES
 Maximum Displacement     0.000149     0.001800     YES
 RMS     Displacement     0.000074     0.001200     YES
 Predicted change in Energy=-2.792189D-09
 Optimization completed.
    -- Stationary point found.
Low frequencies --- -530.3623   -8.3879    0.0003    0.0006    0.0009   15.4591
 Low frequencies ---   17.6114  135.6121  261.7019
 ******    1 imaginary frequencies (negative Signs) ******
Summary
- The conformer which the reaction path leads to is gauche2. This is confirmed by comparing the energy from the appendix table and all three methods from part (f). The same energy of -231.69166702 a.u. is observed every time. This makes the determination of activation energy via mathematical approach using energies somewhat inaccurate as we would be comparing reactant which is gauche3 or anti2 with IRC calculation involving gauche2. To solve this, an attempt (http://hdl.handle.net/10042/21201) of finding the optimised gauche2 structure was conducted but the actual optimisation led to the lowest gauche3 conformer as had been found before. Therefore, another pair of calculations involving IRC for optimised chair and boat at RB3LYP 631/-G* level of theory was performed. Also an IRC calculation for boat at Ea HF/321-G was done.
- IRC for boat at Ea HF/321-G: http://hdl.handle.net/10042/21219
- IRC for chair at Ea HF/321-G from part (f): http://hdl.handle.net/10042/21153
- From these, the plot of energy versus reaction coordinate in [kcal/mol] gives the activation energy which simply corresponds to the peak. This time, the activation energy estimate is done within one conformer and should be more valid. The comparison of the graphical method with the mathematical method is performed below:
| Conformer | Ea HF/321-G [kcal/mol] | Reference value [kcal/mol] | IRC path HF/321-G | Visualisation of IRC path HF/321-G | Ea B3LYP/631-G* [kcal/mol] | Reference value [kcal/mol] | IRC path B3LYP/631-G* | Visualisation of IRC path B3LYP/31-G* |
| Chair | 45.68 | 44.69 | |
 |
33.30 | 33.17 | .svg) |

|
| Boat | 53.04 | 54.76 | .svg) |
 |
40.98 | 41.32 | .svg) |

|
| Item (x) + Method | Ea [a.u.] | Ea [kcal/mol] | ΔE (x - gauche3 at appropriate method) [kcal/mol] | ΔE Reference value [kcal/mol] | link to .log file |
| Chair, HF/321-G | -231.61932089 | -145343.21 | 46.02 | 44.69 | .log file can be found here |
| Boat, HF/321-G | -231.60280169 | -145332.84 | 56.39 | 54.76 | .log file can be found here |
| Chair, B3LYP/631-G* | -234.55693194 | -147186.59 | 34.13 | 33.17 | .log file can be found here |
| Boat, B3LYP/631-G* | -234.54309307 | -147177.90 | 42.81 | 41.32 | .log file can be found here |
| Gauche3, HF/321-G | -231.69266122 | -145389.23 | - | - | .log file can be found here |
| Gauche3, B3LYP/631-G* | -234.61132934 | -147220.72 | - | - | .log file can be found here |
- The improvement of the method from HF/321-G to B3LYP/631-G* did not change the structure of the molecules (same bond lengths and bond angles) but did change the energy of them.
- The agreement between the reference values and the ones computed is fairly satisfactory (especially using the more expensive basis set) but the graphical method gives in general closer values than the mathematical approach as the latter does not compare the same conformers.
- The values however do not match very well to the experimental ones (except chair at B3LYP/631-G* level using the mathematical approach) and are by 0.1-0.2 kcal/mol higher than the indicated tolerance. This may be explained by the fact that the basis set used was not advanced enough and also that 0K cannot be achieved experimentally and hence the results at this temperature are only extrapolated.
The Diels Alder cycloaddition
cis-butadiene
optimisation using semi-empirical AM1 method: http://hdl.handle.net/10042/21193
Item table
         Item               Value     Threshold  Converged?
 Maximum Force            0.000030     0.000450     YES
 RMS     Force            0.000011     0.000300     YES
 Maximum Displacement     0.000368     0.001800     YES
 RMS     Displacement     0.000162     0.001200     YES
 Predicted change in Energy=-9.691204D-09
 Optimization completed.
    -- Stationary point found.
- Energy: 0.04879719 a.u. = 30.62 kcal/mol
- The literature value was found to be 29.04 kcal/mol 2 rendering the semi-empirical AM1 method quite accurate for this system.
[2] D. Guay, Butadiene: A Molecular Mechanics Study, Department of Chemistry, University of Maine
- The molecule of cis-butadiene consists of 22 molecular orbitals with levels 11 and 12 being the HOMO and LUMO respectively. The diagrams below indicate that the HOMO is antisymmetric and the LUMO is symmetric with respect to the plane of symmetry (through the centre of the molecule namely C2-C3 bond - plane is coming 'into the screen'). They have got 1 and 2 nodal planes respectively (the point when the wavefunction goes to zero - indicated by phase colour change).
-
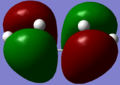 antisymmetric HOMO (11)
 -
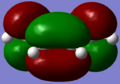 symmetric LUMO (12)


Transition state geometry
- The method to determine the transition state geometry was chosen to be the frozen coordinate one. First a transition state was drawn and the interfragment distance was set to 2.00 Å. This produced a file which did not converge by a lot plus created an actual bond between the two fragments. Thus a longer distance between them was attempted, specifically 2.20 Å.
Item tables:
- 2.00 Å, the files can be found here: http://hdl.handle.net/10042/21270

         Item               Value     Threshold  Converged?
 Maximum Force            0.010907     0.000450     NO
 RMS     Force            0.001109     0.000300     NO
 Maximum Displacement     0.032932     0.001800     NO
 RMS     Displacement     0.007062     0.001200     NO
 Predicted change in Energy=-9.840062D-04
 Optimization stopped.
    -- Number of steps exceeded,  NStep= 100
    -- Flag reset to prevent archiving.
- 2.20 Å, the files can be found here: http://hdl.handle.net/10042/21286

Item               Value     Threshold  Converged?
 Maximum Force            0.000043     0.000450     YES
 RMS     Force            0.000014     0.000300     YES
 Maximum Displacement     0.001386     0.001800     YES
 RMS     Displacement     0.000276     0.001200     YES
 Predicted change in Energy=-4.690489D-07
 Optimization completed.
    -- Stationary point found.
- This looks more like a transition state according to the theory and so this structure was taken to proceed with following steps. The method was still selected to be semi-empirical AM1, however, this time the job type was freq+opt with optimisation to TS (Berny) and never calculating the force constants. Instead of freeze coordinate, derivative was picked.
- Details of the calculation can be found here: http://hdl.handle.net/10042/21289
Item table:

 Item               Value     Threshold     ?
 Maximum Force            0.000048     0.000450     YES
 RMS     Force            0.000010     0.000300     YES
 Maximum Displacement     0.001780     0.001800     YES
 RMS     Displacement     0.000284     0.001200     YES
 Predicted change in Energy=-1.053660D-07
 Optimization completed.
    -- Stationary point found.
 Low frequencies --- -956.9447   -4.2549   -0.6480   -0.0374   -0.0032    0.0733
 Low frequencies ---    3.9218  147.1597  246.4666
 ******    1 imaginary frequencies (negative Signs) ******
- The structure with bond distances is visualised below (left) along with the vibrations corresponding to the reaction path at the transition state (middle) and the lowest positive frequency (right). It can be seen that for the imaginary frequency the formation of the two bonds happens at the same time and is thus regarded as synchronous whereas there is no bond formation or breakage for the lowest positive frequency. The dienophile fragment only vibrates to the left and right of the initial position equidistant from the butadiene fragment.
| Bond distances | Imaginary frequency | Lowest positive frequency | ||||||
 |
|
|
- The structure of the transition state is symmetric and the bond length of the partly formed C-C bonds was calculated to be 2.12 Å. 1 imaginary frequency proves the obtained structure is indeed a transition state. This vibration corresponds to shortening and lengthening of the two bonds between the fragments (as shown in the diagram above) depicting the mechanism of Diels Alder cycloaddition. The energy of the transition state was found to be 0.11165485 a.u. = 70.06 kcal/mol.
- The typical bond length of sp3-sp3 C-C bond is 1.54 Å and that of sp2-sp2 C-C bond is 1.47 Å.3 The van der Waals radius of carbon atom is 1.70 Å.4 This shows that the partly formed C-C bond (2.12 Å) is less than twice the van der Waals radius of carbon which indicates an interaction between the atoms and some orbital overlap which brings the two atoms closer to each other. However, as the bond is much longer than the typical C-C bond length, the structure can only correspond to the transition state as a product would have the bond in a typical sp3 C-C bond distance range.
[3] A. M. Fox; J. K. Whitesell, Organische Chemie: Grundlagen, Mechanismen, Bioorganische Anwendungen, Springer, 1995
[4] A. Bondi, Van der Waals Volumes and Radii, J. Phys. Chem. 68 (3): 441–51; (1964)
- The diagram showing the orbital interactions leading to either HOMO or LUMO of the transition state is shown below. If a plane of symmetry is considered, HOMO of butadiene is a and so is LUMO of ethene leading to s product. If an axis of symmetry is chosen, then both the HOMO of butadiene and LUMO of ethene are s again leading to s product. An analogous approach (with inverted input symmetry but the same output symmetry for the product) can be taken to evaluate the formation of LUMO. The reaction is allowed because it proceeds in a concerted fashion allowing HOMO of one reactant (butadiene) and LUMO of the other (ethene) to interact together. They have got the same symmetry. Overall it contains 4π (butadiene) + 2π (ethene) = 6π electrons proceeding via thermal Hueckel transition state which corresponds to the suprafacial mode and disrotation. The reaction can be classified as pericyclic π4s + π2s cycloaddition.


Regioselectivity of Diels Alder cycloaddition
- As the approach from the last section worked well, it was implemented in this case too. The internuclear distance between the atoms forming a new bond was retained at 2.20 Å. However, as the complexity of the system did increase, the semi-empirical method does not necessarily have to give results which are accurate enough. Hence the cycloaddition was first investigated using the semi-empirical AM1 method and then the results from it checked against more expensive Hartree-Fock 321-G method. The comparison and answers to questions can be found in the following Discussion section.
- Exo TS optimisation using AM1: http://hdl.handle.net/10042/21373
Item table:
         Item               Value     Threshold  Converged?
 Maximum Force            0.000048     0.000450     YES
 RMS     Force            0.000008     0.000300     YES
 Maximum Displacement     0.001227     0.001800     YES
 RMS     Displacement     0.000196     0.001200     YES
 Predicted change in Energy=-1.594207D-07
 Optimization completed.
    -- Stationary point found.
- Endo TS optimisation using AM1: http://hdl.handle.net/10042/21377
Item table:
         Item               Value     Threshold  Converged?
 Maximum Force            0.000047     0.000450     YES
 RMS     Force            0.000010     0.000300     YES
 Maximum Displacement     0.001426     0.001800     YES
 RMS     Displacement     0.000275     0.001200     YES
 Predicted change in Energy=-1.138917D-07
 Optimization completed.
    -- Stationary point found.
- Exo TS optimisation+frequency using AM1: http://hdl.handle.net/10042/21374
Item table:
         Item               Value     Threshold  Converged?
 Maximum Force            0.000040     0.000450     YES
 RMS     Force            0.000007     0.000300     YES
 Maximum Displacement     0.001090     0.001800     YES
 RMS     Displacement     0.000160     0.001200     YES
 Predicted change in Energy= 8.454763D-08
 Optimization completed.
    -- Stationary point found.
Low frequencies --- -811.1830   -3.2429   -2.4371   -0.0045    0.0181    0.5706
 Low frequencies ---    3.2305   60.7749  123.7291
 ******    1 imaginary frequencies (negative Signs) ******
- Exo TS optimisation+frequency using HF 321-G: http://hdl.handle.net/10042/21381
Item table:
         Item               Value     Threshold  Converged?
 Maximum Force            0.000110     0.000450     YES
 RMS     Force            0.000014     0.000300     YES
 Maximum Displacement     0.001672     0.001800     YES
 RMS     Displacement     0.000267     0.001200     YES
 Predicted change in Energy=-2.873026D-07
 Optimization completed.
    -- Stationary point found.
Low frequencies --- -646.7523   -5.5819   -4.1528   -2.9940   -0.0008    0.0003
 Low frequencies ---    0.0005   41.5142  131.1818
 ******    1 imaginary frequencies (negative Signs) ******
- Endo TS optimisation+frequency using AM1: http://hdl.handle.net/10042/21378
Item table:
         Item               Value     Threshold  Converged?
 Maximum Force            0.000024     0.000450     YES
 RMS     Force            0.000004     0.000300     YES
 Maximum Displacement     0.000587     0.001800     YES
 RMS     Displacement     0.000109     0.001200     YES
 Predicted change in Energy= 2.396101D-08
 Optimization completed.
    -- Stationary point found.
Low frequencies --- -805.7387   -2.4846   -2.2050   -0.2678   -0.0104    0.3647
 Low frequencies ---    2.2713   62.3995  111.6972
 ******    1 imaginary frequencies (negative Signs) ******
- Endo TS optimisation+frequency using HF 321-G: http://hdl.handle.net/10042/21379
Item table:
         Item               Value     Threshold  Converged?
 Maximum Force            0.000088     0.000450     YES
 RMS     Force            0.000014     0.000300     YES
 Maximum Displacement     0.001305     0.001800     YES
 RMS     Displacement     0.000210     0.001200     YES
 Predicted change in Energy=-9.224272D-08
 Optimization completed.
    -- Stationary point found.
Low frequencies --- -642.0162   -3.1455   -1.8324   -0.0005   -0.0005    0.0002
 Low frequencies ---    0.6100   64.8458  141.8588
 ******    1 imaginary frequencies (negative Signs) ******
- N.B. Opt+freq job using HF 321-G method can be used on AM1 optimised structure as the job type opt+freq will reoptimise it again according to the current method.
Discussion
| Item | Exo (AM1) | Exo (HF-321G) | Endo (AM1) | Endo (HF-321G) | ||||||||||||
| Relative energy [a.u.] | -0.05041994 | -605.60359097 | -0.05150483 | -605.61036814 | ||||||||||||
| Bond lengths (a-f) [Å] | 1.39, 1.41, 1.40, 1.49, 1.49, 1.52 | 1.37, 1.37, 1.40, 1.48, 1.52, 1.56 | 1.39, 1.41, 1.40, 1.49, 1.49, 1.52 | 1.37, 1.37, 1.40, 1.48, 1.52, 1.56 | ||||||||||||
| Partly formed σC-C (g) [Å] | 2.17 | 2.26 | 2.16 | 2.23 | ||||||||||||
| C-C through space (h) [Å] | 2.95 | 2.92 | 2.89 | 2.85 | ||||||||||||
| HOMO |  |
 |
 |

| ||||||||||||
| HOMO energy [a.u.] | -0.34271 | -0.32321 | -0.34504 | -0.32440 | ||||||||||||
| LUMO |  |
 |
 |

| ||||||||||||
| LUMO energy [a.u.] | -0.04048 | 0.05801 | -0.03571 | 0.07330 | ||||||||||||
| Imaginary frequency |
|
|
|
| ||||||||||||
| Imaginary frequency [cm-1] | -811 | -647 | -805 | -642 |

- HOMO for the exo structure consists of Ψ2 of the 1,3-diene and Ψ2 of the dienophile. Both wavefunctions go to zero once resulting into 2 nodal planes which are however in fact the same plane through the middle of the molecule (very similar to the previous case with butadiene and ethene). In addition, there is a very weak bonding interaction between the carbon of bridging CH2 and the oxygen of C=O. The HOMO for the endo regioisomer looks very much the same except now the orbital for oxygen in C=O points into the opposite direction and is closer to the forming C=C bond of the original cyclohexa-1,3-diene.
- The reason why AM1 method shows the level 34 as HOMO and the HF 321-G the level 47 is due to the consideration of core orbitals. The former ignores the levels which are deep down in energy whereas the latter takes into account all of them.
- The structures of both the regioisomers are similar in the sense that the maleic anhydride comes from one face of the diene and aligns in a parallel fashion to it. The difference is in the relative position of the bridge and maleic anhydride fragments in the final structure. For the exo regioisomer, the maleic anhydride fragment comes from the top and pushes the bridge down away from itself and therefore they end up on the same side of the molecule one above the other. For the endo regioisomer, it comes from the bottom face pushing the bridge up. This time the bridge is on the other side of the molecule though. Other parameters such as bond lengths and bond angles are very similar if not identical so it is only the relative orientation of the fragments which distinguishes the two regioisomers.
- The way the maleic anhydride fragment approaches the cyclohexa-1,3-diene can also explain why is the exo regioisomer more strained. It is due to the close proximity of the bridgehead and maleic anhydride fragment. They clash to each other raising the energy of the system. No such problem occurs in the endo form where the bridge and maleic anhydride are on the other side of the molecule.
- As for the secondary orbital overlap, there is a very weak interaction between CH2 fragment and C=O of the maleic anhydride in the exo form as indicated by the calculated HOMO but the true secondary orbital overlap effect is present only in the exo form between the forming C=C in the cyclohexa-1,3-diene and C=O of the maleic anhydride. This interaction helps to stabilise the transition state and is the decisive kinetic factor assuring the endo form is formed quicker and is thus the major product. The interaction however cannot be directly seen from the visualised HOMO but can be accounted for considering the through space distances. The shorter distance is present in the endo form implying better overlap and favourable interactions between the orbitals.5,6
- The relative energy difference between the two regioisomers differs significantly based on the method used. For the semi-empirical AM1 method, the endo transition state was calculated to be by 0.00108489 a.u. = 2.85 kJ/mol lower in energy than the exo form. Using the more advanced HF 321-G basis set, the difference was determined to be 0.0067772 a.u. = 17.78 kJ/mol in favour of the endo regioisomer. The latter should be closer to the real value.
[5] I. Fleming, Frontier Orbitals and Organic Chemical Reactions, John Wiley & Sons, 1976, pp. 87-88, 178-180
[6] S. Warren, N. Greeves, J. Clayden, P. Wothers, Organic Chemistry, Oxford University Press, 2000