
Rep:Mod:FRC1510
Module 3: Week 1: The Cope Rearrangement of 1,5-hexadiene Tutorial
Optimisation of the app conformation of 1,5-haxadiene

Performed the optimisation of an app formation for the centre four carbons of 1,5-haxadiene. File:1 5 heaxidiene 321G Optimisation.chk.
From the .chk file, observed that that both the double bond lenghts are 1.32 Å.
Results:
Summary Table:
| 1,5-hexadiene Optimisation | ||
|---|---|---|
| File Type | .chk | |
| Calculation Type | FOPT | |
| Calculation Method | RHF | |
| Basis Set | 3-21G | |
| Total Energy | -231.6925353 | a.u. |
| RMS Gradient Norm | 0.00001891 | a.u. |
| Dipole Moment | 0 | Debye |
Therefore from the Summary Table above can observe that the final total energy is -231.6925353 a.u.
Though the summary table did not provide a point group, after running a symmetry analysis the result was the the point group was a non-clear Ci/C1.
The success of the optimisation is dependent on whether or not all the items have been properly converged. This can be observed in the Item Table, shown below:
        Item               Value     Threshold  Converged?
 Maximum Force            0.000060     0.000450     YES
 RMS     Force            0.000010     0.000300     YES
 Maximum Displacement     0.000497     0.001800     YES
 RMS     Displacement     0.000171     0.001200     YES
 Predicted change in Energy=-2.037273D-08
 Optimization completed.
    -- Stationary point found.
The item table is showing that the forces and the displacement has been properly converged. Another method to have a general idea of whether or not the optimisation reached completetion is by observing the RMS gradient value in the Summary Table. The gradient needs to be smaller than .001 atomic units, and in this optimisation the value was 0.00001891 atomic units, therefore optimised!
Optimisation of a gauche conformation of 1,5-hexadiene

Performed optimisation of the guache conformation of 1,5-hexadiene for the centre four carbons. The double bond length is 1.32 Å, therefore the same as the previous conformation. File:1 5 hexadiene gauche optimisation.chk
Results:
Summary Table:
| 1,5-hexadiene gauche optimisation | Units | |
|---|---|---|
| File Type | .chk | |
| Calculation Type | FOPT | |
| Calculation Method | RHF | |
| Basis Set | 3-21G | |
| Total Energy | -231.6915303 | a.u. |
| RMS Gradient Norm | 0.00001866 | a.u. |
| Dipole Moment | 0.1281 | Debye |
Therefore from the summary table it was discovered that the final total energy is -231.6915303 a.u..
Though the point group was not described in the summary table, after a symmetry analysis the results were C2/C1.
Item Table:
Observed the Item Table as a method of analysis:
        Item               Value     Threshold  Converged?
 Maximum Force            0.000018     0.000450     YES
 RMS     Force            0.000008     0.000300     YES
 Maximum Displacement     0.001463     0.001800     YES
 RMS     Displacement     0.000413     0.001200     YES
 Predicted change in Energy=-4.919422D-08
 Optimization completed.
    -- Stationary point found.
Everything is converged, optimisation completed!
Comparisons of Energies
The app conformation had a total energy of -231.6925353 a.u. and the gauche conformation had a final total energy of -231.6915303 a.u. Though very similar energies, the app seems to have a lower energy, and is therefore the more stable conformation out of these two. There are different 'gauche' and 'anti' conformations existing that have lower final total energies.
DO PART C!!!!!!!!
Naming the Conformations according to Appendix 1
Therefore the app structure appears to be 'anti2', as it has the same energy and the same point group.
On the other hand, the Gauche conformation appears to be the 'gaughe4' conformation, due to, as above, it has the same energy and the C2 point group, which was one of the options of symmetry of the conformation.
Optimising "anti2" conformation
The conformation of anti2 by coincidence has already been optimised in the first section. The calculation done with gaussian resulted with an energy of -231.69254 atomic units. In appendix 1, the energy is quoted being -231.69254 atomic units. The results are the same. This is a good demonstration of a) the accuracy of the calculations and b)that the structure was optimised correctly.
Optimising the app conformation once more with a higher level of theory

Performed an optimisation of the previous app conformation 1,5-hexadiene, this time with a 631-G(d) basis set. File:1 5 heaxidiene 631G APP Optimisation.chk. The optimised structure is shown in the figure to the left, at an angle to see the app conformation.
Results:
Summary Table:
| 1,5-hexadien 631G Optimisation | Units | |
|---|---|---|
| File Type | .chk | |
| Calculation Type | FOPT | |
| Calculation Method | RB3LYP | |
| Basis Set | 6-31G(D) | |
| Total Energy | -234.6117028 | a.u. |
| RMS Gradient Norm | 0.00001326 | a.u. |
| Dipole Moment | 0 | Debye |
| Point Group |
Therefore the final total energy is -234.6117028 a.u. This energy is lower than the previous conformations done, and therefore can be assumed that due to that it will have the lowest activation energy.DOI:10.1002/anie.197504601
After doing a symmetry analysis, the result is a Ci/C1 point group. If it is Ci, then the point group would be the same, but if it goes with the other option then it would have changed the symmetry.
Item Table:
         Item               Value     Threshold  Converged?
 Maximum Force            0.000015     0.000450     YES
 RMS     Force            0.000006     0.000300     YES
 Maximum Displacement     0.000219     0.001800     YES
 RMS     Displacement     0.000079     0.001200     YES
 Predicted change in Energy=-1.588873D-08
 Optimization completed.
    -- Stationary point found.
As demonstrated above, all items have been converged, therefore the optimisation has occured correctly.
Comparisons of the geometries of the different optimisation results of the app conformation
| Basis Set | HF/3-21G | B3LYP/631-G(d) |
|---|---|---|
| Structure | 
|

|
| Energies | -231.6925353 a.u. | -234.6117028 a.u. |
| Double Bond length | 1.32 Å | 1.33 Å |
| C(12/7)-C(2/1) Bond length | 1.51 Å | 1.5 Å |
| C(2)-C(1) bond length | 1.55 Å | 1.55 Å |
| C(14)-C(12)-C(2) angle | 124.8° | 125.3° |
Though there is a large change of conformational energy (1831.8 kcal/mol!), the overall geometry does not change significantly. According to the table above, a few bond lengths change only about +/- .1 Å, and the angle changes by less than one degree.
Frequency Analysis
Frequency Analysis of the 631-G(d) basis set of the app conformation of 1,5-hexadiene
Performed the frequency analysis on the app conformation 1,5-hexadiene. File:1 5 HEAXIDIENE 631G APP FREQUENCY.LOG.
Results:
Summary Table:
| 1,5-hexadiene 631G frequency | Units | |
|---|---|---|
| File Type | .log | |
| Calculation Type | FREQ | |
| Calculation Method | RB3LYP | |
| Basis Set | 6-31G(d) | |
| E(RB3LYP) | -234.6117102 | a.u. |
| RMS Gradient Norm | 0.00001497 | a.u. |
| Dipole Moment | 0 | Debye |
| Point Group | CI |
The energy remains the same as the optimisation, which is as it should be.
Item Table:
         Item               Value     Threshold  Converged?
 Maximum Force            0.000040     0.000450     YES
 RMS     Force            0.000015     0.000300     YES
 Maximum Displacement     0.001432     0.001800     YES
 RMS     Displacement     0.000651     0.001200     YES
 Predicted change in Energy=-3.250840D-08
 Optimization completed.
    -- Stationary point found.
Everything is converged and therefore the optimisation has reached completion, and the results can be trusted to be true.
Analyzing the vibrational results, the program claims that there are 42 vibrations. This should be constant with the 3N-6 rule.[1] The (N) value 1,5-hexadiene is 16, therefore there are a correct number of vibrations.
With the frequency analysis it is also possible to observe the IR Spectra of the molecule:

With the .log file could observe the different types of energies (in atomic units):
 Sum of electronic and zero-point Energies=           -234.469204
 Sum of electronic and thermal Energies=              -234.461857
 Sum of electronic and thermal Enthalpies=            -234.460913
 Sum of electronic and thermal Free Energies=         -234.500778
There are four types of energies mentioned above. The first is the sum of electronic and zero-point energy. As the name tells, this value is the potential energy of the molecule if there were to be no vibrations, which can be assumed at 0 Kelvin. The second energy is the sum of electronic and thermal energies, which includes the translational, rotational and vibrational energies at room temperature. The sum of electronic and thermal enthalpies is as the previous case except this time round it includes a correction for 298 K. Finally the sum of electronic and thermal free energies takes into consideration the entropy given to free energy. With the 'real' energy being -234.6117102, it can be observed that none of the energies written above are the same as it, they are all less-negative. Anytime a frequency or Opt+Fre job is run, this information will be annotated for comparative reasons.
It is important to make sure that you select the correct energy/enthalpy term to compare to your experimental values. Note that these corrections can also be calculated at other temperatures using the Temperature option in Gaussian, If you have time, try re-calculate these quantities at 0 K as shown in the Advanced GaussView Tutorial.
Module 3: Week 1: Optimizing the "Chair" and "Boat" Transition Structures
Optimising the first half of the transition state

Optimised the structure of half the transition state., that has the chemical formula C3H5, using the HF/321-G level of theory. File:C3H5 OPT.chk
The half-transition state structure was optimised as a method of making sure that when the transition state is measured and optimised it is facilitated by the fact that its subsections are already optimised themselves. Therefore it is a method to decrease the chances of errors and failed optimisations.
Results:
Summary Table:
| C3H5 Optimisation | Units | |
|---|---|---|
| File Type | .chk | |
| Calculation Type | FOPT | |
| Calculation Method | UHF | |
| Basis Set | 3-21G | |
| Total Energy | -115.8230401 | a.u. |
| RMS Gradient Norm | 0.00003048 | a.u. |
| Dipole Moment | 0.0292 | Debye |
As can be seen from the summary table above, the final total energy is -115.8230401 a.u. The gradient is less than .001 a.u., which is a sign that the energy has been properly optimised.
This optimised 'half-structure' is going to be used to construct a full optimised transition state, by using it twice.
When asked to symmetrize, Gaussian stated that the point groups were C2v/C1
Item Table:
         Item               Value     Threshold  Converged?
 Maximum Force            0.000048     0.000450     YES
 RMS     Force            0.000018     0.000300     YES
 Maximum Displacement     0.000155     0.001800     YES
 RMS     Displacement     0.000070     0.001200     YES
 Predicted change in Energy=-1.277267D-08
 Optimization completed.
    -- Stationary point found.
The half-structure of the chair transition state formation has been properly converged and therefore optimised, and is now 'safe' to be used in the proceeding transition state calculations.
Optimising the chair transition state computing the force constant matrix

Used two of the half-structure of the previous section to create a guess structure of the chair transition state that had approximately a distance of 2.2 Å in between the terminal carbons. Optimised the TS(Berny) (not minimum) and measured the frequency of the guess structure of the chair transition state. Result file: File:CHAIR TS 321G.LOG
Results:
The distance between the terminal carbons were 2.02 Å.
Summary Table:
| CHAIR TS OPT + FREQUENCY | Units | |
|---|---|---|
| File Type | .log | |
| Calculation Type | FREQ | |
| Calculation Method | RHF | |
| Basis Set | 3-21G | |
| Charge | 0 | |
| Spin | Singlet | |
| E(RHF) | -231.6193224 | a.u. |
| RMS Gradient Norm | 0.00002188 | a.u. |
| Imaginary Freq | 1 | |
| Dipole Moment | 0.0001 | Debye |
| Point Group | C1 |
The calculation took 24 seconds. The final total energy was -231.6193224 a.u.. The summary table states that there is one imaginary frequency, and when observing the 'vibrations' table, the imaginary table appears to occur at -818.06 cm-1 according to the results of the frequency analysis. The vibration at this frequency can be observed below, and it is noted that it demonstrates following the Cope rearrangement:

Item Table:
         Item               Value     Threshold  Converged?
 Maximum Force            0.000019     0.000450     YES
 RMS     Force            0.000005     0.000300     YES
 Maximum Displacement     0.001020     0.001800     YES
 RMS     Displacement     0.000182     0.001200     YES
 Predicted change in Energy=-6.394019D-08
 Optimization completed.
    -- Stationary point found.
All the items are converged, therefore the data can be trusted as the structure has been properly optimised.
From the frequency analysis was able to find the IR Spectra of the structure:

And from the .log file the four different type of energies:
 Sum of electronic and zero-point Energies=           -231.466700
 Sum of electronic and thermal Energies=              -231.461340
 Sum of electronic and thermal Enthalpies=            -231.460396
 Sum of electronic and thermal Free Energies=         -231.495205
(All energies above are in atomic units).
These energies, though not exact, are all relative value to each other and the real final total energy of -231.6193224 atomic units. Compared to the only previous occasion when the energies were retrieved, the energies are all closer in energy to each other as there is only a difference of 0.034809 atomic units between the larger and smaller energies.
Optimising the chair transition state using the frozen coordinate method.

Using the method of 'freezing bonds', the chair transition state was optimised once more so as to be able to observe different techniques of transition state measuring. A 3D representation. It is important to use the keyword Opt=noeigen for the calculation to occur.
Results:
The distance between the terminal carbons of the two different fragments is 2.02 Å, therefore the bond distance of the 'unfrozen' structure is shorter than the originally 'frozen' bonds (they were frozen at 2.20 Å). This is the same distance as the previous method of optimisation.
Summary Table:
| CHAIR_TS_FROZEN2_321G | Units | |
|---|---|---|
| File Name | CHAIR_TS_UNFROZEN3 | |
| File Type | .log | |
| Calculation Type | FREQ | |
| Calculation Method | RHF | |
| Basis Set | 3-21G | |
| Charge | 0 | |
| Spin | Singlet | |
| E(RHF) | -231.6193223 | a.u. |
| RMS Gradient Norm | 0.00004562 | a.u. |
| Imaginary Freq | 1 | |
| Dipole Moment | 0.0017 | Debye |
| Point Group | C1 |
Important data is reported in this table: For starters the conformation energy is -231.6193223 atomic units. As with the bond distance, this is equal to the results of the previous method. It is stated that there is one imaginary frequency, and with the vibrations tab in Gaussian it is stated that it is at 817.90 cm-1. This detail is different from the previous, though minimally (<.2 cm-1 difference).
IR Spectra:

Energies (in atomic units):
Sum of electronic and zero-point Energies=           -231.466702
 Sum of electronic and thermal Energies=              -231.461344
 Sum of electronic and thermal Enthalpies=            -231.460400
 Sum of electronic and thermal Free Energies=         -231.495207
Comparisons of the two methods for the measurement of the chair transition state
| Force Constant Method | Frozen Coordinate Method | |
|---|---|---|
| Bond breaking/forming length | 2.02 Å | 2.02 Å |
| Final Total Energy | -231.6193224 a.u. | -231.6193223 a.u. |
Both methods started with relatively a 2.20 Å distance between the terminal carbons, and both methods proceeded to reduce that length to the same distance: 2.02 Å. Another comparison is the final total energy measurement, and again both methods lead to practically identical values. This is a representation that neither one of the methods is 'more correct', and when trying to optmising the transition state both methods are viable options.
Optimisation and Frequency Analysis of the boat transition state using the QST2 method
Ran the optimisation and frequency calculation again, but this time with a a specific geometry, and the TS-QST2 was run. The basis set remained that of HF/321-G. File:BOAT5 TS 321G.LOG
The figure below shows the input file of the optimisation and frequency analysis. The structure to the left is the reactant and the figure to the right is the structure of the product. The numbering was assigned in a controlled fashion so as to assure that the correct optimisation occurred. The Gaussian program was incapable of running the optimisation unless the numbering (which is shown below) is identical to that of the figure. It was also important to adjust the structures to the conformation below for the transition state to be measured. For the reactant (figure on the left) the angle C2-C3-C4-C5 has to equal 0°, and the angles (C2-C3-C4) and (C3-C4-C5) have to equal 100°. The same goes for the mirror image angles of the product structure. A 'dummy' trial was run through the structures before the angles were specified and the calculation failed.

Results:
The figure below shows the optimised transition state of the boat conformation. The 'transition state bond lengths' (a.k.a. distance between the terminal carbons) is 2.14 Å.


Once the figures have been labelled it can be observed how the atoms did not change position vs. the input file (which has the same labeling above):

Summary table:
| BOAT_TS_321G | Units | |
|---|---|---|
| File Name | BOAT5_TS_321G | |
| File Type | .log | |
| Calculation Type | FREQ | |
| Calculation Method | RHF | |
| Basis Set | 3-21G | |
| Charge | 0 | |
| Spin | Singlet | |
| E(RHF) | -231.6028025 | a.u. |
| RMS Gradient Norm | 0.00000028 | a.u. |
| Imaginary Freq | 1 | |
| Dipole Moment | 0.1584 | Debye |
| Point Group | C1 |
Therefore the important bits of information in the summary table show that the final total energy is -231.6028025 a.u. and that there is one imaginary frequency. When observing the vibrations, this imaginary frequency was at -839.98 cm-1. The vibration at this frequency is shown below. Even though the structure of the transition state has changed it is shown below that the motions still resemble that of the Cope rearrangement.

Item Table:
         Item               Value     Threshold  Converged?
 Maximum Force            0.000001     0.000015     YES
 RMS     Force            0.000000     0.000010     YES
 Maximum Displacement     0.000013     0.000060     YES
 RMS     Displacement     0.000003     0.000040     YES
 Predicted change in Energy=-7.490236D-12
 Optimization completed.
    -- Stationary point found.
Item table conclusion: everything is converged, the optimisation happened!
Therefore from the frequency calculations could come up with the IR Spectra of the transition state.

Energies (in atomic units):
 Sum of electronic and zero-point Energies=           -231.450929
 Sum of electronic and thermal Energies=              -231.445300
 Sum of electronic and thermal Enthalpies=            -231.444355
 Sum of electronic and thermal Free Energies=         -231.479774
Intrinsic Reaction Coordinate:
Used the intrinsic reaction coordinate (IRC) as a calculation method of demonstrating the path from the transition state to the final structure. This is a useful method to investigate what conformation the final structure, whether it will be a guache or an anti conformation. Though the IRC might not be able to complete the reaction path, the structure with the lowest energy can be optimised and will hopefully take the form of the final structure.
Chair Transition State:
Performed the IRC of the first optimisation of the chair transition state (force constant matrix method), and the energy diagram was observed. Since the optimisation was only read in the 'forward' direction, it begins at the transition state (the highest energy) and as it approaches the 'final structure' the energy decreases.
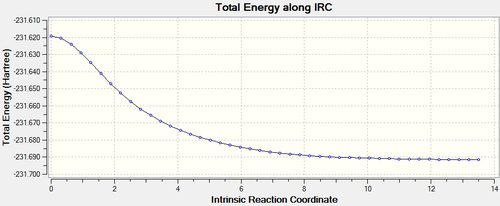
This diagram can be used to observed the required 'activation energy' to reach the transition state. In this case the uppermost energy is -231.61932200 atomic units and the lowest energy is -231.69157852 atomic units.
Therefore the difference will be the activation energy, which is 0.07225652 atomic units, which can be converted to a more quantifiable value 45.34 kcal/mol.
Minimisation of energy of the Chair transition state

The lowest energy form of the IRC can then be optimised itself to find the 'final structure'. This minimization was done with the same structure which had the -231.69157852 atomic units. This optimisation was done with the 321-G basis set. The result was as follows:
File:CHAIR TS 321G MINIMIZE.LOG
Results:
Summary Table:
| CHAIR_TS_MINIMIZE_FRE | Units | |
|---|---|---|
| File Name | CHAIR_TS_321G_MINIMIZE | |
| File Type | .log | |
| Calculation Type | FREQ | |
| Calculation Method | RHF | |
| Basis Set | 3-21G | |
| Charge | 0 | |
| Spin | Singlet | |
| E(RHF) | -231.69166702 | a.u. |
| RMS Gradient Norm | 0.00000475 | a.u. |
| Imaginary Freq | 0 | |
| Dipole Moment | 0.3806 | Debye |
| Point Group | C2 |
With the above information in the summary table it can be compared to Appendix 1 to be able to assign it a classification. The energy is calculated to be -231.691667 atomic units and the point group is noted as being C2. With this information the structure can therefore be classified as the 'gauche2' conformation. Now that there is a minimized structure the activation energy can be calculated once more, this time more accurately:
The new energy difference is 0.072345 atomic units, which is 45.40 kcal/mol.
Item Table:
         Item               Value     Threshold  Converged?
 Maximum Force            0.000010     0.000450     YES
 RMS     Force            0.000003     0.000300     YES
 Maximum Displacement     0.000299     0.001800     YES
 RMS     Displacement     0.000091     0.001200     YES
 Predicted change in Energy=-2.413989D-09
 Optimization completed.
    -- Stationary point found.
Frequency Analysis:

There is no imaginary frequency for the minimized structure as that is a characteristic of the transition state. The frequency with the largest absorbency is at 1108-1.
Energies:
 Sum of electronic and zero-point Energies=           -231.538704
 Sum of electronic and thermal Energies=              -231.531794
 Sum of electronic and thermal Enthalpies=            -231.530850
 Sum of electronic and thermal Free Energies=         -231.570131
Boat Transition State
Performed IRC on the boat transition from the .chk of the boat transition state the was optimised previously.
Energy Diagram:

Again the highest energy represents the transition state and the downward slope represents the reaction reaching its product's conformation. In this case the highest energy is -231.60280249 atomic units and the lowest is -231.68298205 atomic units. This means that the difference, and the activation energy, is 0.08017956 atomic units, therefore 50.31 kcal/mol.
Minimization of the boat transition state

The lowest energy of the IRC was run under the "Opt+Fre" job to find the conformation that derives from the boat transiton state:
File:BOAT5 TS 321G MINIMIZE FRE.LOG
Results:
Summary Table:
| BOAT_TS_321G_MINIMIZE | Units | |
|---|---|---|
| File Name | BOAT5_TS_321G_MINIMIZE_FRE | |
| File Type | .log | |
| Calculation Type | FREQ | |
| Calculation Method | RHF | |
| Basis Set | 3-21G | |
| Charge | 0 | |
| Spin | Singlet | |
| E(RHF) | -231.69266122 | a.u. |
| RMS Gradient Norm | 0.00000515 | a.u. |
| Imaginary Freq | 0 | |
| Dipole Moment | 0.3405 | Debye |
| Point Group | C1 |
The summary table above describes that there is an energy of -231.6926612 atomic units and that the symmetry point group is C1. This information indicates that this is the structure 'gauche3'.
Item Table:
         Item               Value     Threshold  Converged?
 Maximum Force            0.000006     0.000450     YES
 RMS     Force            0.000002     0.000300     YES
 Maximum Displacement     0.000284     0.001800     YES
 RMS     Displacement     0.000066     0.001200     YES
 Predicted change in Energy=-3.025819D-09
 Optimization completed.
    -- Stationary point found.
As hoped, everything has been converged and the structure has been fully optimised.
Frequency analysis:
Since the minimized structure is no longer a transition state there is no longer a imaginary frequency, as is noted in the summary table.
IR Spectra:

The largest peak observed has a frequency of 1110 cm-1.
Thermodynamic energies:
Sum of electronic and zero-point Energies=           -231.539486
 Sum of electronic and thermal Energies=              -231.532647
 Sum of electronic and thermal Enthalpies=            -231.531703
 Sum of electronic and thermal Free Energies=         -231.570640
As it was for the chair minimized structure, the energies of the minimized structure are all 'more negative' than that of the previous transition state. This is understandable as it is much more stable than the transition state so would therefore have lower energy.
Module 3: Week 2: The Diels Alder Cycloaddition
For all the calculations done in this section, unless specifically said otherwise, the basis set used was semi-empirical/AM1. This is a lower level of theory than previously used, but is understandable considering that some of the molecules used are going to be larger than before, and for the sake of time it is a necessity.
Optimisation of cis-butadiene

Cis-butadiene (pictured), which is an important part of the Diels Alder reaction that will be studied in the next section, was optimised for a minimum. Opt=noEigen was used as a key word as the force was calculated once.
A new technique is used in this section in that now the MO's are going to be part of the observation. They will be used to analyse the HOMO and LUMO of the molecules and help determine whether or not they are symmetric or asymmetric vs. the plane.
Results:
From the optimised structure it was deducted that the C-C single bond was 1.45 Å, and the C=C double bond was an understandable shorter length of 1.34 Å due to the stronger bond. The angle C-C=C is 126°, and the C-C=C-C is an expected 0°.
Summary Table:
| Butadiene_OPT_AM1 | Units | |
|---|---|---|
| File Name | BUTADIENE_OPT_AM1 | |
| File Type | .log | |
| Calculation Type | FOPT | |
| Calculation Method | RAM1 | |
| Basis Set | ZDO | |
| Charge | 0 | |
| Spin | Singlet | |
| E(RAM1) | 0.04879719 | a.u. |
| RMS Gradient Norm | 0.00001745 | a.u. |
| Imaginary Freq | ||
| Dipole Moment | 0.0414 | Debye |
| Point Group | C1 |
The frequency was not measured, explaining why the Imaginary Frequency section is blank. The final energy is 0.04879719 atomic units, which is substantially less than any of the previous measurements.
Item Table:
         Item               Value     Threshold  Converged?
 Maximum Force            0.000030     0.000450     YES
 RMS     Force            0.000011     0.000300     YES
 Maximum Displacement     0.000355     0.001800     YES
 RMS     Displacement     0.000162     0.001200     YES
 Predicted change in Energy=-9.691068D-09
 Optimization completed.
    -- Stationary point found.
Everything has been converged, and therefore the optimisation has been completed.
MO Analysis


Using Gaussian it is possible to visualize the HOMO and LUMO of butadiene. On the right are the MO representations that have been visualized.
The figure to the right shows the HOMO of butadiene. The plane of the molecule would go vertically down the middle of that molecule. The orbitals would therefore not be mirror reflections of each other, on the contrary they are the opposite. Therefore it can be deducted that the HOMO is asymmetric. The HOMO had two less nodal planes than the LUMO (3 vs. 5) and therefore it explains why the LUMO has the higher energy between the two.
On the figure to the left the LUMO of butadiene can be observed. In this case, if you were to draw the imaginary plane in the same place as was done for the HOMO, down the middle, the result is the opposite as the one before. In this case, either side of the plane is identical to the other side. Therefore it can be said that the LUMO is indeed symmetric.
Transition state analysis of cis-butadiene plus ethylene
To ensure the best results, ethylene was optimised separately first before 'reacted' with the previously optimised butadiene. They were combined so as to be able to observe the transition state of the Diels Alder (Butadiene+ethylene) cycloaddition. The structure of the optimised ethylene is below.

It was then optimised and frequency analysed at the transition state (TSBerny).
Results:
File:BUTADIENE ETHYLENE OPT FRE3.LOG
The resultant distance between the terminal carbons is 2.12 Å. The C=C double bond for both the ethylene and the butadiene is 1.38 Å, and the C-C single bond is 1.40 Å. These bond lengths are more similar in size than the usual comparison between a single and a double bond. This is because during this reaction all the double bonds become single bonds, and the one single bond becomes a double. Therefore it is understandable that at the transition state, they bond lengths should be reaching an equal value. The Item table can be found in the .log file attached above.
Summary Table:
| BUTADIENE ETHYLENE opt | ||
|---|---|---|
| File Name | BUTADIENE_ETHYLENE_OPT_FRE3 | |
| File Type | .log | |
| Calculation Type | FREQ | |
| Calculation Method | RAM1 | |
| Basis Set | ZDO | |
| Charge | 0 | |
| Spin | Singlet | |
| E(RAM1) | 0.11165465 | a.u. |
| RMS Gradient Norm | 0.00000491 | a.u. |
| Imaginary Freq | 1 | |
| Dipole Moment | 0.5605 | Debye |
| Point Group | C1 |

From the summary table the energy is described to have the value of 0.11165465 atomic units. This is much less than the transition states of the chair and boat transitions of the cope rearrangement. This is because the Diels Alder reaction is not very favourable, especially without substituents. The gradient is smaller than .001 atomic units, which is a good sign that the calculations were properly done. An important hint that the transition state was found is that there is one imaginary frequency. The vibrations were analysed and the imaginary frequency was found to have the value of -956 cm-1. This vibration is shown to the left. The difference between this transition state and the one of the Cope rearrangement is that it is synchronous, that is to say that the two bonds seem to be formed at the same time. For the Cope rearrangement it was alternative bond forming/breaking.

The IRC was run so as to be able to observe the reaction happen and the result can be seen to the right. This representation also shows how the two bonds forming happen at the same time. It shows as well the previous observation that the double bonds become single bonds and vice versa, explaining the similar bond lengths at the transition state.
Below is the energy path of the IRC, therefore the energy path of the reaction. This path is from the same file of the figure above that is a motion representation of the reaction. For the beginning the energy slowly increases, and this is viewed to be because it is as the butadiene and ethylene approach each other and 'accommodate' themselves by turning to a more comfortable conformation that allows them to have the best interaction. Therefore the highest peak is the transition state (the original optimisation), understandably with the highest energy. Once the transition state is 'crossed' there is a sudden drop in energy as the reaction reaches the stable product. From this diagram and the IRC it is possible to calculate the activation energy, from the lowest energy to the left of the transition state to the highest energy (therefore the transition state). It is therefore calculated to be: 23.23 kcal/mol

From the final product it is possible to compare the bond lengths of the sp2 and the sp3 C-C bond lengths. The sp2 bond length is that from the C=C double bond that is formed, since it has relatively a trigonal planar formation (~120°). This bond length is 1.34 Å (.04 shorter than the double bond length of the transition state). The sp3 C-C bonds are all the single bonds that are in between two carbons with tetrahedral shapes (~109°). This bond length is meant to be 1.52 Å. This is substantially longer than the transition state single bonds, due to the much more relaxed conformation.
IR Spectra:
From the frequency analysis the IR Spectra was observed:

There are three main peaks, there are at 729 cm-1, 923 cm-1 and 1101 cm-1. The peak at the far right are not being considered in these exercises.


MO analysis:
The HOMO and LUMO of the butadiene+ethylene transition state was visualized with the aim to observe if the orbitals were symmetric or asymmetric with regards to the plane of symmetry. The results are the figures to the left and right. Both of the illustrations are at the exact same orientation to simplify the comparisons. The HOMO of the Diels Alder reaction is illustrated in the figure to the left. The plane of symmetry goes through the molecule horizontally (therefore in this representation it is the empty space that runs through the transition state). Therefore it is the same plane of symmetry previously used for when analysing the orbitals of the butadiene, but it has now been rotated 90 degrees. The HOMO of butadiene has already been deducted to being assymetric, and since the ethylene at this orbital has alternative orientated p-orbitals, overall the HOMO of the transition state is assymetric.
On the other hand, the LUMO (the figure to the right) looks significantly different. Due to the ehylene p-orbitals being orientated in the same direction it can now interact through a Π bond. If one observes the figure with the same plane of symmetry as the HOMO, it become apparent that the LUMO of butadiene+ethylene is symmetric.

FMO:
The reason that the reaction can occur is due to the theory called FMO (Frontier Molecular Orbitals).[2]
The diagram (constructed with the programs ChemDraw Pro) to the left demonstrates how the orbitals of the butadiene (left) interact with the orbitals of the ethylene (right). The orbitals are arranged in order of energy, with the most antibonding at the top and the most bonding at the bottom. For the reaction to be able to proceed the HOMO of the butadiene needs to interact with the LUMO of the ethylene. Observing the orbitals it can be noticed how these two orbitals have the same asymmetric formations relative to the plane of symmetry. The same happens vice versa, with the HOMO of the ethylene interacting with the LUMO of butadiene, since they too have the same symmetry versus the plane of symmetry, this time they are both symmetrical.
This theory explains why in the IRC a lot of the initial time is spent with the two different fragments approaching themselves at what seems a specific angle. This observation has been noted earlier. This is necessary for the specific HOMO-LUMO interactions to occur. By observing the transition state optimised at the beginning of this section, the angle of attack is 99.3° from the butadiene to the ethylene.
Energies:
Since the frequency analysis of the transition state was conducted alongside of the optimisation it is possible to observe the different types of the thermochemistry energies, in atomic units:
 Sum of electronic and zero-point Energies=              0.253275
 Sum of electronic and thermal Energies=                 0.259453
 Sum of electronic and thermal Enthalpies=               0.260397
 Sum of electronic and thermal Free Energies=            0.224015
Study of the regioselectivity of the Diels Alder Reaction


For the next step another Diels Alders reaction is going to be analysed. This time it is in between cyclohexa-1,3-diene and maleic anhydride. There will be two conformations: the endo and exo. The object of research is to find which of these two is the kinetic result and which is the thermodynamic result, or one of the conformations can be both the kinetic and thermodynamic product. The thermodynamic will have the lower energy, but the kinetic will have the lower activation energy.
Optimisations
Both of the conformations were optimised running a frequency analysis at the same time. They were optimised to a TS(Berny) transition state, with the force constant measured only once (only possible if using the keyword Opt=noeigen).
Results:
ENDO conformation file: File:DIELS ALDER OPT FRE2.LOG
EXO conformation file: File:DIELS ALDER EXO OPT FRE.LOG
The summary tables of both of the optimisation calculations are shown below:
| ENDO FORM | Units | EXO FORM | Units | |||
|---|---|---|---|---|---|---|
| File Name | DIELS_ALDER_OPT_FRE2 | File Name | DIELS_ALDER_EXO_OPT_FRE | |||
| File Type | .log | File Type | .log | |||
| Calculation Type | FREQ | Calculation Type | FREQ | |||
| Calculation Method | RAM1 | Calculation Method | RAM1 | |||
| Basis Set | ZDO | Basis Set | ZDO | |||
| Charge | 0 | Charge | 0 | |||
| Spin | Singlet | Spin | Singlet | |||
| E(RAM1) | -0.05150476 | a.u. | E(RAM1) | -0.05041984 | a.u. | |
| RMS Gradient Norm | 0.00001561 | a.u. | RMS Gradient Norm | 0.00000908 | a.u. | |
| Imaginary Freq | 1 | Imaginary Freq | 1 | |||
| Dipole Moment | 6.166 | Debye | Dipole Moment | 5.5638 | Debye | |
| Point Group | C1 | Point Group | C1 |


Though the different conformations have similar energies, the difference between them is large enough to make conclusions. The energy of the endo conformation is -0.05150476 atomic units and the energy of the exo conformation is -0.05041984 atomic units. Therefore the conclusion from that is that the endo form has the lower energy transition state, which is the first step of indicating that it might be at least the kinetic product. We need the results of the IRC before any conclusions can be properly made.
Another bit of information that can be retrieved from the summary table is that they both have one imaginary frequency, which is correctly indicative that a transition state was measured. The vibrational analysis described the endo form to have the imaginary frequency of -806 cm-1. This vibration can be observed in the firgure to the left. On the other hand, for the transition vibration of the exo form, it is different than the endo. For the exo the imaginary frequency is at -812 cm-1. The vibration for the exo form can be observed on the figure to the right.
IRC:
The IRC plays an important role in this analysis as it will describe a) which of the conformations has a lower transition site and b) which one is thermodynamically more stable by having the larger Gibbs Free energy.
ENDO Conformation:

If the figure to the left is clicked then it is possible to observe the reaction of the Endo conformation.

From the optimisation we know that the transition state energy is -0.05150476 atomic units. From the IRC we now know that the lowest energy before the transition state (reactant) is -0.09435144 atomic units and the lowest energy after the transition state (product) is -0.16016654 atomic units. With this first measurement is is possible to calculate the activation energy, which turns out to be 0.04284668 atomic units, which is 26.89 kcal/mol. With the latter measurement it is possible to calculate the Gibbs free energy, which turns out to be -0.10866178 atomic units, which is -68.19 kcal/mol. This results are still pretty meaningless until the exo form is analysed so as to be able to draw a conlcuion from the comparisons.
EXO Conformation:

The figure to the right shows the reaction path that the exo conformation takes, and below is the energy path representation.

The energy path looks like it behaves similarly to that of the exo conformation. As mentioned in the summary table above, the transition state energy -0.05041984 atomic units and now from the IRC we can find the reactant total energy and the product total energy. The lowest total energy before the transition state is -0.09537189 atomic units. The lowest energy after the transition state is -0.15990509 atomic units. With the total energy of the reactant it is possible to calculate the activation energy: 0.04495205 atomic units, 28.21 kcal/mol. The latter measurement is used for the calculation of the Gibbs free energy: -0.10948525 atomic units, -68.70 kcal/mol. With the measurements from the two conformations done, it is now possible to find out which product is the kinetic one.
ENDO vs. EXO:
| Endo | Exo | |
|---|---|---|
| Structure |
|
|
| Terminal bond distance at the transition state | 2.16 Å | 2.17 Å |
| Angle of entry | 100° | 99° |
| Double bond length | 1.41 Å | 1.41 Å |
| Sigma bond length | 1.39 Å | 1.40 Å |
| Transition state energy | -0.05150476 atomic units | -0.05041984 atomic units |
| Activation energy | 26.89 kcal/mol | 28.21 kcal/mol |
| Gibbs Free energy | -68.19 kcal/mol | -68.70 kcal/mol |
Therefore from these results it has become clear which of the products is the kinetic product and which is the thermodynamic one. Just looking at the Gibbs Free energies, the exo-form has the slightly greater energy, therefore it is more stable, and that is the definition of the thermodynamic result. But though it is the lowest Gibbs energy, it is the endo-transition state that has the lower activation energy. Since this product is the easiest to make, it is the kinetic energy. This means that at room temperature, when there is no extra heat to help aid the thermodynamic transition state, the endo-conformation will be predominate as the major product.
MO Analysis:
The MO analysis as a method to observe if the reaction is possible:
ENDO:


EXO:


Since all of the conformations are anti symmetrical, it is possible for the HOMO-LUMO interactions to occur.
Thermodynamic Energies:
ENDO:
 Sum of electronic and zero-point Energies=              0.133494
 Sum of electronic and thermal Energies=                 0.143683
 Sum of electronic and thermal Enthalpies=               0.144627
 Sum of electronic and thermal Free Energies=            0.097351
EXO:
 Sum of electronic and zero-point Energies=              0.134881
 Sum of electronic and thermal Energies=                 0.144882
 Sum of electronic and thermal Enthalpies=               0.145826
 Sum of electronic and thermal Free Energies=            0.099118
REFERENCES
- ↑ Paula, Peter Atkins, Julio de (2009). Elements of physical chemistry (5th ed. ed.). Oxford: Oxford U.P. pp. 459. ISBN 978-0-19-922672-6.
- ↑ Fukui, K.; Yonezawa, T.; Nagata, C.; Shingu, H. J. Chem. Phys., 1954, 22, 1433; (b) Fukui, K. in Molecular Orbitals in Chemistry, Physics and Biology, Löwdin, P.–O.; Pullman, B. (Eds.), Academic Press, New York, 1964, p. 513.