Rep:Mod:EmilyParmenterInorganic
EX3 Section
BH3 Optimisation
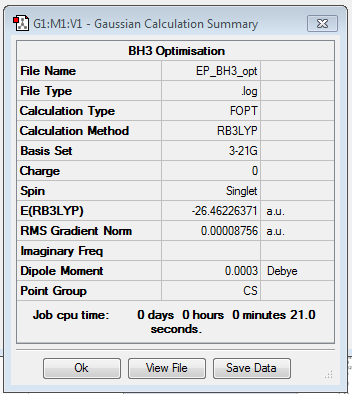
The molecule of BH3 was optimised using the B3LYP method and the 3-21G basis set. Although this basis set has a low accuracy, it allows quick calculations.
The link to my log file is here File:EP BH3 OPT.LOG
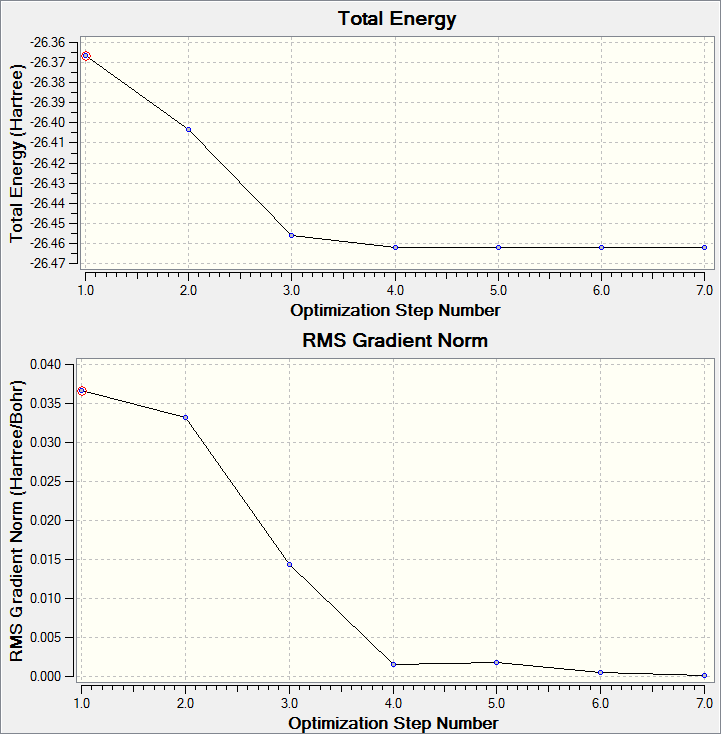
The Born-Oppenheimer approximation is used when solving the Schrödinger equation to give the electron density, this assumes that the nuclei are in fixed positions and so the energy is dependent on the position of the nuclei. The optimisation works by solving the Schrödinger equation for nuclei in fixed positions, and then changing the position of the nuclei and solving the Schrödinger equation for this new position to see if the energy is lower. The idea is to move along the potential energy surface until the lowest energy point is reached; the position of the nuclei at this lowest energy point is known as the optimised geometry. The graphs below show the energy decreasing as the molecule is optimised, and the gradient going to zero as it approaches the minimum energy point. The gradient is zero in the optimised geometry as there are no forces acting on the molecule, this is known as the equilibrium position. Forces will act on the molecule if the energy can be decreased by changing the positions of the nuclei.
Using a Better Basis Set
The basis set determines the number of functions that are used to describe the electronic structure of a molecule. A better basis uses more functions and so can build up a much better picture of the electronic structure of a molecule. However the more functions used the more difficult the calculation and so the more computing power needed; this means that a balance has to be struck between the computing power needed and the accuracy of the picture of electronic structure.
In this optimisation of BH3 the method used was B3LYP (the same as above) but a better basis set, 6-31G(d,p), was used.
| Summary Data | Convergence | Jmol | ||
|---|---|---|---|---|
 |
Item Value Threshold Converged? Maximum Force 0.000009 0.000450 YES RMS Force 0.000006 0.000300 YES Maximum Displacement 0.000037 0.001800 YES RMS Displacement 0.000024 0.001200 YES |
The link to my log file is here File:EP BH3 OPT 631G DP OPT2.LOG
GaBr3 Optimisation
A pseudo potential is used to simplify the calculations used in the optimisation of GaBr3. It is assumed that valence electrons dominate the bonding interactions and so the core electrons can be modelled by a function, known as the pseudo potential.
The method used for the optimisation of GaBr3 is B3LYP and the LanL2DZ is used as the basis set; this is a medium basis set which uses D95V on first row atoms and Los Alamos ECP (which is a pseudo potential) on heavier elements, in this case both gallium and bromine.
| Summary | Convergence | Jmol | ||
|---|---|---|---|---|
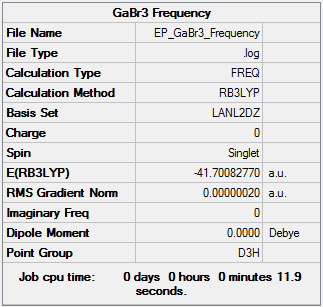 |
Item Value Threshold Converged? Maximum Force 0.000000 0.000450 YES RMS Force 0.000000 0.000300 YES Maximum Displacement 0.000003 0.001800 YES RMS Displacement 0.000002 0.001200 YES |
Here is the link to my log file File:EP GaBr3 pp opt1.log
BBr3
In this case, the molecule is made up of boron, which is a light atom, and bromine, which is a heavy atom; this means that a mixture of basis sets and pseudo potentials are needed. For boron the 6-31G(d,p) basis set was used and for bromine the LanL2DZ basis set was used. The method used was B3LYP.
| Summary | Convergence | Jmol | ||
|---|---|---|---|---|
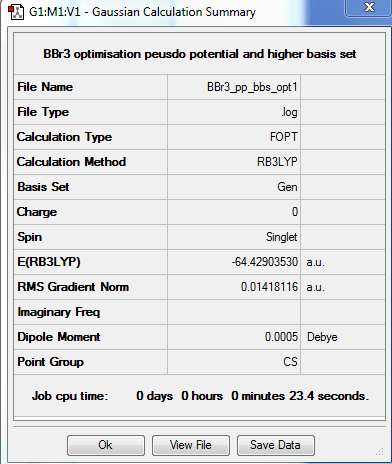 |
Item Value Threshold Converged? Maximum Force 0.000012 0.000450 YES RMS Force 0.000007 0.000300 YES Maximum Displacement 0.000048 0.001800 YES RMS Displacement 0.000032 0.001200 YES |
The link to my log file is here File:EP BBr3 pp bbs opt1.log
Structure Comparison
| BH3 | BBr3 | GaBr3 | |
|---|---|---|---|
| r(E-X) Å | 1.19 | 2.02 | 2.39 |
| θ(X-E-X) degrees (°) | 120.0 | 120.0 | 120.0 |
It can be seen that changing the ligand or the central element has no effect on the bond angle; the table above shows that all three molecules have a bond angle of 120° and hence a trigonal planar arrangement.
However changing the ligand and the central atom does have an effect on the bond length. It can be seen that changing the ligand from hydrogen to bromine increases the bond length, indicating that the bond is weaker; this can be seen by comparing the bond lengths of BH3 and BBr3. Both hydrogen and bromine can form only one bond with the central atom but bromine is much larger than hydrogen. Hydrogen only has one electron where as bromine had 35 electrons, this means the nucleus is much more shielded in bromine and so less able to attract electrons from boron hence making a weaker bond. In addition, the orbital overlap between hydrogen and boron is better than the orbital overlap between boron and bromine because bromine is much larger and hence the orbitals are more diffuse and so the bonding is weaker.
Furthermore changing the central atom also changes the bond length; the bond length increases when the central atom is changed from boron to gallium as can be seen when comparing BBr3 and GaBr3. Both gallium and boron are in group 3 so have 3 valence electrons which can be used to form three covalent bonds. However gallium has 31 electrons where as boron has only 5 and so the gallium nucleus is much more shielded and so the attraction to bromide's electrons is less and hence the bond is weaker. Also the valence electrons in gallium are in the 4s and 4p orbitals which are more diffuse than the 2s and 2p orbitals that the boron's valence electrons are in and so the gallium-bromine bond is going to be weaker than the boron-bromine bond.
A bond is an electrostatic attraction between the nuclei and electrons of two atoms. Bond energies vary depending on the strength of the attraction between the atoms. An example of a strong bond would be the carbon-nitrogen triple bond which has a bond energy of 890 kJ/mol.[1] A weak bond would be something like oxygen-oxygen single bond which has a bond energy of 146 kJ/mol.[1] A medium strength bond is therefore somewhere in the middle, for example carbon-carbon single bond which has a bond energy of 348 kJ/mol.[1] In gaussview some structures do not have bonds shown, this is because bonds are only drawn if atoms are within a certain distance of each other. This means that sometimes gaussview will show no bonds when actually there are bonds, bonds are based on attractions between nuclei and so although it is distance dependent, there is not a clearly defined cut off point in which after this distance no bonds form as it depends on the type of atoms and other factors.
Frequency Analysis
The frequency analysis is carried out in order to confirm that a minimum has been reached and so confirms the optimised geometry has been reached. This analysis basically calculates the second derivative of the potential energy surface and also gives us infra-red and Raman data which can be compared with experimental data. The low frequencies are much smaller values than the vibrations listed; this is because they represent the motions of the centre of mass in the molecule. The same method and basis set was used as for the optimisations shown above..
BH3
| Summary | Low Modes |
|---|---|
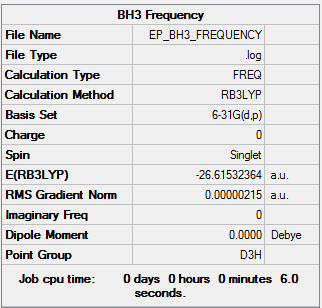 |
Low frequencies --- -11.7227 -11.7148 -6.6070 -0.0010 0.0278 0.4278 Low frequencies --- 1162.9743 1213.1388 1213.1390 |
The link to the frequency file is here File:EP BH3 FREQUENCY.LOG
| Wavenumber | Intensity | IR Active? | Type |
|---|---|---|---|
| 1163 | 93 | Yes | Bend |
| 1213 | 14 | Very slightly | Bend |
| 1213 | 14 | Very slightly | Bend |
| 2583 | 0 | No | Stretch |
| 2716 | 126 | Yes | Stretch |
| 2716 | 126 | Yes | Stretch |
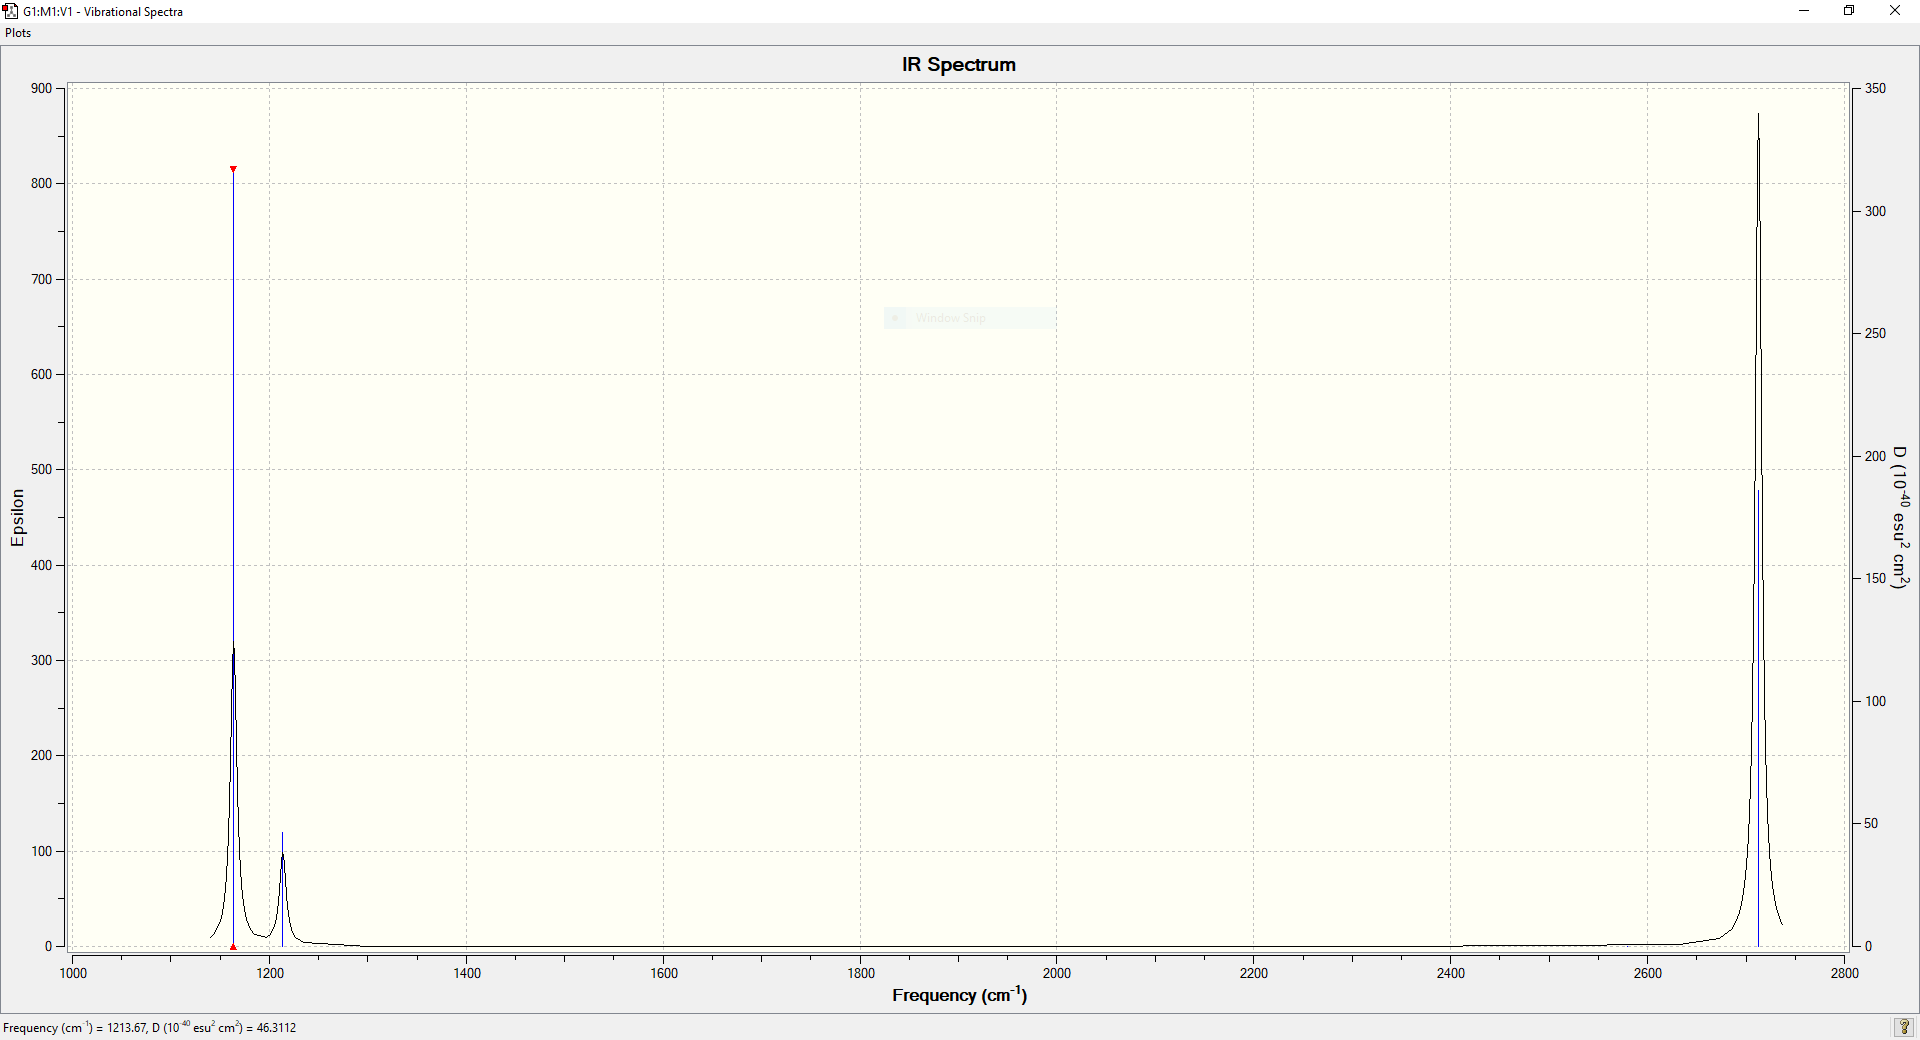
It can be seen that the number of peaks in the IR spectrum is less than the number of vibrations there are. This is because some of the vibrations are degenerate as they occur at the same energy and so they appear as one peak on the IR spectrum; this occurs for the vibrations at 1213 and 2716 cm-1. Also the vibration at 2583 cm-1 is at such low intensity that it is not observed and so does not appear on the IR spectrum. Therefore there are only 3 peaks in the IR spectrum, even though there are 6 vibrations.
GaBr3
| Summary | Low Modes |
|---|---|
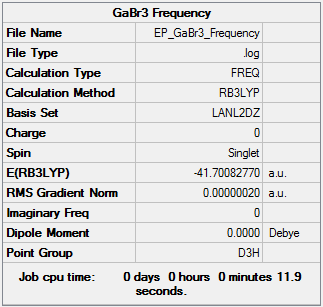 |
Low frequencies --- -1.4878 -0.0015 -0.0002 0.0096 0.6540 0.6540 Low frequencies --- 76.3920 76.3924 99.6767 |
The link to my frequency file is here File:EP GaBr3 Frequency.log
| Wavenumber | Intensity | IR Active? | Type |
|---|---|---|---|
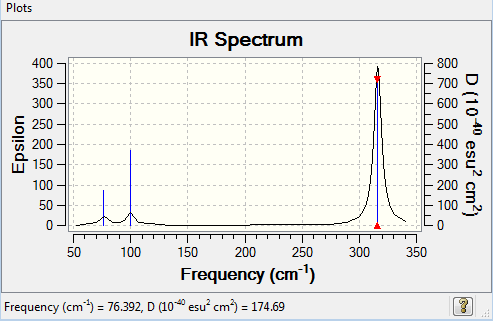
| 76 | 3 | Very slightly | Bend |
| 76 | 3 | Very slightly | Bend |
| 100 | 9 | Very slightly | Bend |
| 197 | 0 | No | Stretch |
| 316 | 57 | Yes | Stretch |
| 316 | 57 | Yes | Stretch |
If the bonds in a molecule are modelled as springs, the stretching frequencies can be determined from the following equation:
ν=1/2πc √((k(m1+m2))/(m1 m2 ))
where v = frequency, m1 = mass of atom 1, m2 = mass of atom 2, k = force constant, and c = speed of light
The frequencies for the BH3 molecule are much higher than for the GaBr3; this is due to two reasons. The first is that both gallium and bromine are much heavier atoms than boron and hydrogen and it can be seen from the above equation that the higher the mass of the two atoms the lower the frequency. The other reason is that the force constant k, is larger for stronger bonds and hence leads to a higher frequency; the B-H bonds are stronger than the Ga-Br bonds and so the force constant for the B-H bond is larger.
The A"2 mode is lowest mode for BH3 but is only the third lowest mode in GaBr3. In BH3 the displacement vectors show that only the H atoms moves and the boron remains stationary, however in GaBr3 both the bromine and gallium atoms move though in different directions. This is because the hydrogen atoms are so light that it is easy to move them and so it requires less energy, and it is easier to move the hydrogens further rather than move the boron. In GaBr3, the lowest energy form of this bend is achieved by moving both atoms rather than just moving the bromines a further distance.
Molecular Orbital Diagram of BH3
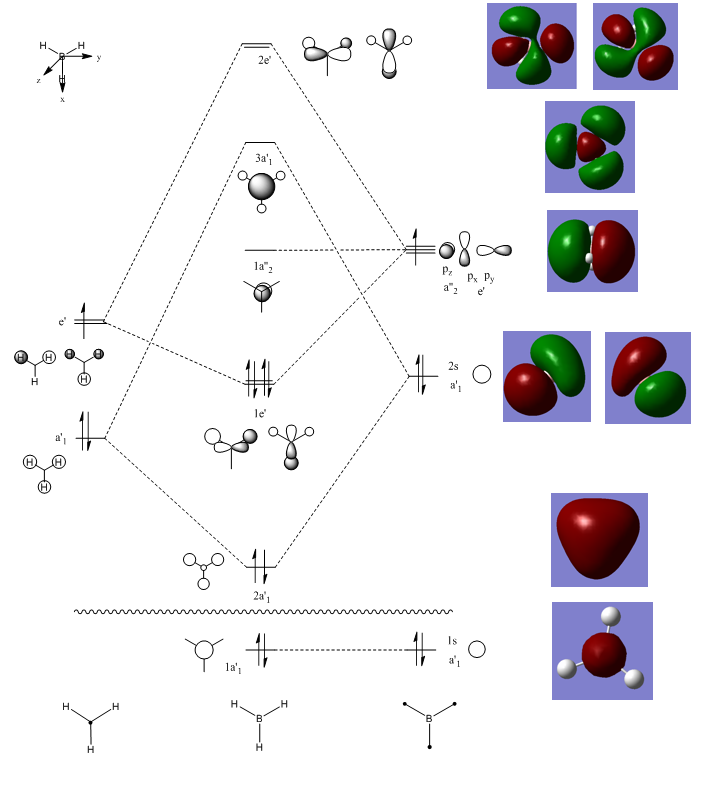
The molecular orbitals of a molecule can be calculated and then compared with molecular orbitals generated in a qualitative manner by the drawing of an molecular orbital diagram using the linear combination of atomic orbitals (LCAO). Below is shown the molecular orbital diagram of BH3 and the computed molecular orbitals are also shown on the right hand side next to the corresponding qualitative molecular orbitals.
In general the computed molecular orbitals are similar to the molecular orbitals generated by LCAO. The 1a'1, 1a"2 and 3a'1 molecular orbitals have a very good match between the LCAO and computed molecular orbitals. The other orbitals still have a fairly good match as the the phases are the same, even though there are slight differences in the shapes, particularly for 1e' and 2e" molecular orbitals. This shows that building molecular orbitals qualitatively by LCAO is a good approximation of the real molecular orbitals which can be calculated quantitatively and hence LCAO is very useful and easy way of predicting what molecular orbitals look like.
NH3
Optimisation
NH3 was optimised using the B3LYP method and the 6-31G(d,p) basis set.
| Summary | Convergence | Jmol | ||
|---|---|---|---|---|
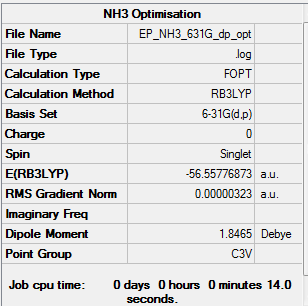 |
Item Value Threshold Converged? Maximum Force 0.000006 0.000450 YES RMS Force 0.000004 0.000300 YES Maximum Displacement 0.000012 0.001800 YES RMS Displacement 0.000008 0.001200 YES |
The link to the log file is here File:EP NH3 631G DP OPT.LOG
Frequency Analysis
| Summary | Low Modes |
|---|---|
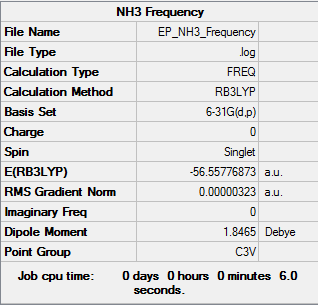 |
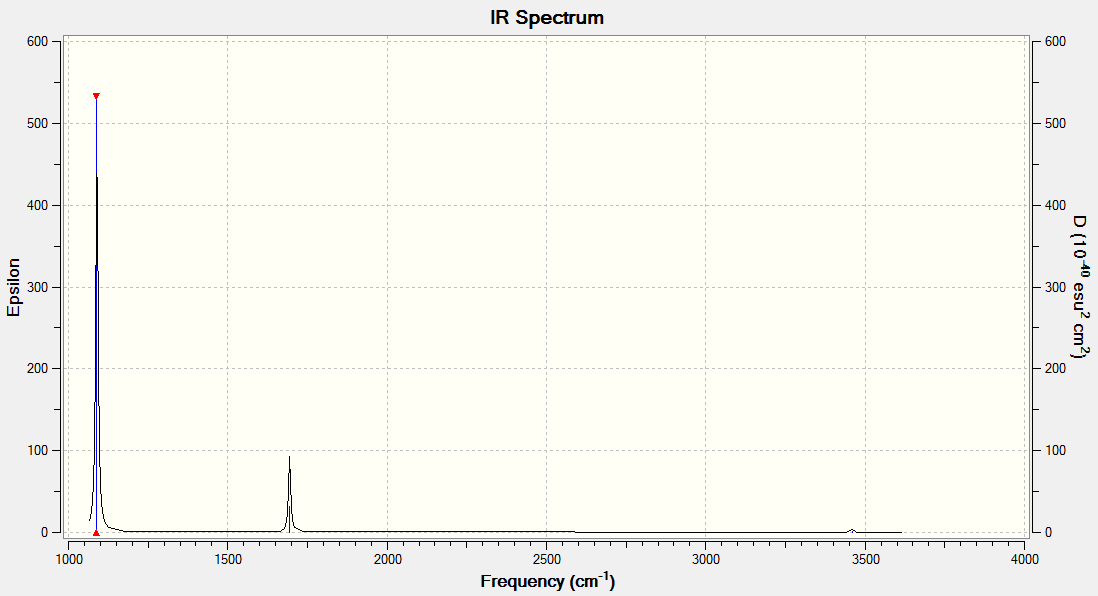
Low frequencies --- -0.0130 -0.0022 0.0001 7.0722 8.1014 8.1017 Low frequencies --- 1089.3849 1693.9369 1693.9369 |
The link to the log file is here File:EP NH3 FREQUENCY.LOG
| Wavenumber | Intensity | IR Active? | Type |
|---|---|---|---|
| 1089 | 145 | Yes | Bend |
| 1694 | 14 | Very slightly | Bend |
| 1694 | 14 | Very slightly | Bend |
| 3461 | 1 | Very, very slightly | Stretch |
| 3590 | 0 | No | Stretch |
| 3590 | 0 | No | Stretch |
Population Analysis
NBO Analysis
The NBO analysis means that a molecule can be looked at in terms of 2-centred, 2-electron bonds instead of as a delocalised molecular orbital. It gives information about the charges on the atoms, the contribution of each atom to the bonds and the orbitals on each atom that are used for bonding.
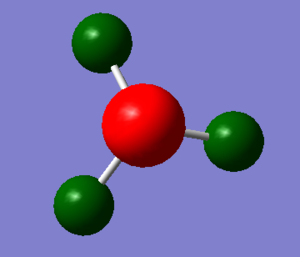
The picture below shows the charges on the molecule of NH3 using colour. The colour range is -1.125 to 1.125. the charge on the nitrogen is -1.125 and the charge on the hydrogen is 0.375.
Asscoiation Energies: Ammonia-Borane
Optimisation
BH3NH3 was optimised using the B3LYP method and the 6-31G(d,p) basis set.
| Summary Data | Convergence | Jmol | ||
|---|---|---|---|---|
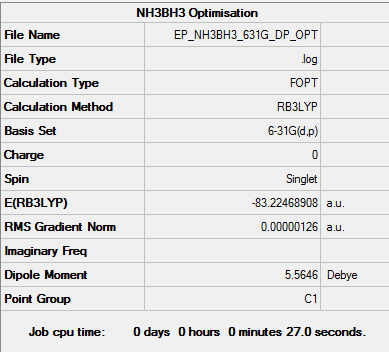 |
Item Value Threshold Converged? Maximum Force 0.000002 0.000015 YES RMS Force 0.000001 0.000010 YES Maximum Displacement 0.000011 0.000060 YES RMS Displacement 0.000003 0.000040 YES |
The link to the log file is here File:EP NH3BH3 631G DP OPT1.LOG
Frequency
| Summary Data | Low Modes |
|---|---|
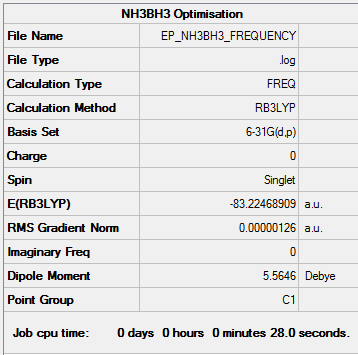 |
Low frequencies --- -2.0261 -0.0011 -0.0011 0.0002 1.9448 3.0966 Low frequencies --- 263.4674 632.9569 638.4417 |
The link to the frequency file is here File:EP NH3BH3 FREQUENCY.LOG
Dissociation Energy
E(NH3) = -56.5577687 au
E(BH3) = -26.6153236 au
E((NH3BH3) = -83.2246891 au
ΔE = E((NH3BH3) - (E(NH3) + E(BH3))
ΔE = -0.05159676 au
ΔE = -135.47 kJ/mol
Therefore it can be seen that the B-N dative bond is a weak bond as it has a similar energy to the oxygen-oxygen single bond (146 kJ/mol[1]).
Ionic Liquids
Introduction
The term ionic liquids are given to liquids that are made up only of ions and are liquid at room temperature or have a low melting point (generally below 100°C). Ionic liquids have the potential to be solvents for many different reactions and may in the future replace the volatile organic solvents that are currently used in many industrial processes. They also have potential as lubricants, as embalming fluids, in the desulfurization of fuels, and in ion drives for space travel. There is a huge range of ionic liquids and so it is not possible to analysis the properties of each experimentally. Computational chemistry can be used to understand these ionic liquid better and it is thought that at some point it will be able to be used to determine the properties of these ionic liquids. Ionic liquids are usually made up of a cation which is organic, bulky and has it's charge delocalised, and an anion which is inorganic. In this project several different cations are analysed using computational methods.[2]
[N(CH3)4]+
Optimisation
The method used was B3LYP and the basis set used was 6-31G(d,p).
| Summary Data | Convergence | Jmol | ||
|---|---|---|---|---|
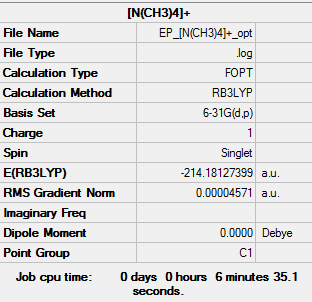 |
Item Value Threshold Converged? Maximum Force 0.000073 0.000450 YES RMS Force 0.000028 0.000300 YES Maximum Displacement 0.000502 0.001800 YES RMS Displacement 0.000127 0.001200 YES |
The link to the optimisation file: DOI:10042/153407
Frequency
| Summary Data | Low Modes |
|---|---|
 |
Low frequencies --- -6.5164 -0.0003 0.0010 0.0012 8.8444 14.4767 Low frequencies --- 185.2313 289.8325 290.1821 |
The link to the frequency file: DOI:10042/153418
MO and NBO Analysis
| MO 6 | MO 8 | MO 10 | MO 17 | MO 21 |
|---|---|---|---|---|
 |
 |
 |
 |
|
 |
 |
 |
 |

|
| Energy = -1.19651 au | Energy = -0.92555 au | Energy = -0.80744 au | Energy = -0.58031 au | Energy = -0.57934 au |
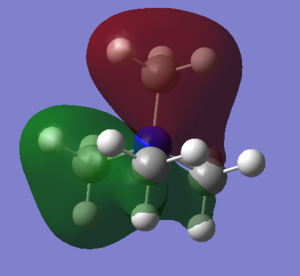
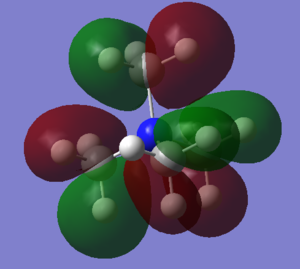
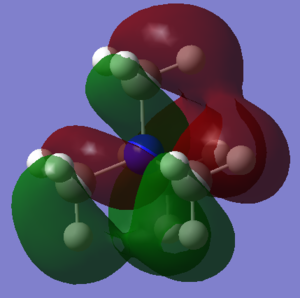
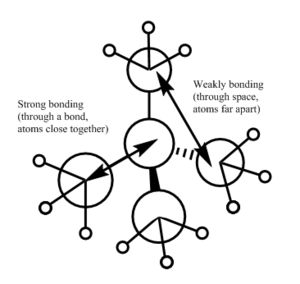
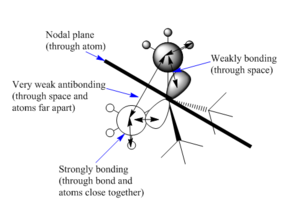
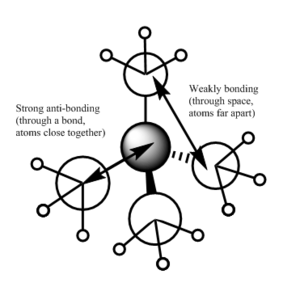
| There is a bonding interaction between the s orbital on the carbon and the s orbital on the nitrogen, this is a strong interaction as it is through a bond. The bonding interaction between the s orbitals on the carbons is weaker as it is through space and the atoms are further apart. There are no nodal planes in this MO as all orbitals are s orbitals and are of the same phase. Overall this is a strongly bonding orbital. | There is weak bonding interaction between the p orbital on nitrogen and the s orbital on two of the carbons. There is also a bonding interaction between the s orbital on the carbon and the s orbital on the hydrogen which is fairly strong as the interaction is through the bond and the atoms are close together. There is an antibonding interaction between the s orbitals on the carbons which is very weak, as its through space and the atoms are far apart. There is a nodal plane through the nitrogen atom; nodal planes through atoms are only weakly antibonding. Overall this is a bonding orbital, but a weaker bonding orbital than MO 6 due to the weaker bonding interactions and the presence of an antibonding component. | There is a strong antibonding interaction between the s orbital on the nitrogen and the s orbital on the carbon as the atoms are close together and the interaction is through the bond. There is also a weak bonding interaction between the carbon s orbitals but as this is through space and atoms are further apart it is much weaker than the bonding interaction. Overall this is an antibonding orbital as the antibonding interaction is much stronger than the bonding interaction. | This MO has weakly bonding and weakly antibonding interactions between the p orbitals on the carbons. The interactions are weak as the atoms are far apart and the interactions are through space. Overall this orbital is weakly antibonding as there are more antibonding interactions than bonding interactions. | There is a strong bonding interaction between the p orbital on nitrogen and one of the carbon p orbitals, which is through the bond. There is also weak bond interactions, through space, between the p orbital on nitrogen and the other carbon p orbitals. Overall this is a fairly weak bonding orbital; it is less bonding than MO 6 as interactions between p orbitals are weaker than interactions between s orbitals. |
[P(CH3)4]+
Optimisation
The method used was B3LYP and the basis set used was 6-31G(d,p).
| Summary Data | Convergence | Jmol | ||
|---|---|---|---|---|
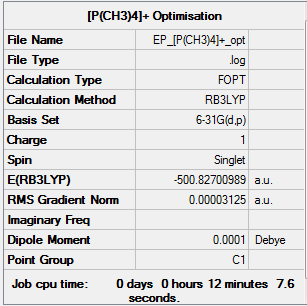 |
Item Value Threshold Converged? Maximum Force 0.000172 0.000450 YES RMS Force 0.000037 0.000300 YES Maximum Displacement 0.000946 0.001800 YES RMS Displacement 0.000358 0.001200 YES |
The link to the optimisation file: DOI:10042/153413
Frequency
| Summary Data | Low Modes |
|---|---|
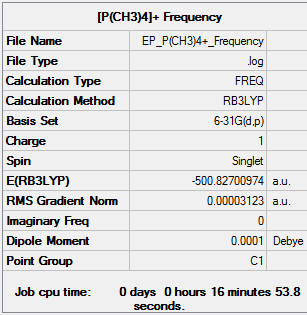 |
Low frequencies --- -12.7317 -10.4019 -8.4524 -0.0008 0.0024 0.0028 Low frequencies --- 155.4375 190.8681 191.4042 |
The link to the frequency file: DOI:10042/153424
MO and NBO Analysis
[S(CH3)3]+
Optimisation
The method used was B3LYP and the basis set used was 6-31G(d,p).
| Summary Data | Convergence | Jmol | ||
|---|---|---|---|---|
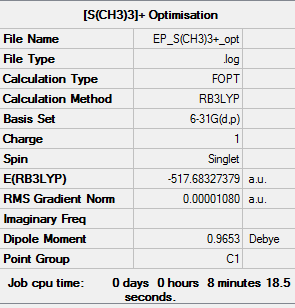 |
Item Value Threshold Converged? Maximum Force 0.000032 0.000450 YES RMS Force 0.000008 0.000300 YES Maximum Displacement 0.000127 0.001800 YES RMS Displacement 0.000050 0.001200 YES |
Frequency
| Summary Data | Low Modes |
|---|---|
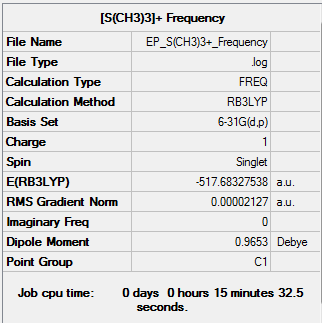 |
Low frequencies --- -0.0014 0.0026 0.0028 1.9577 9.1083 10.2340 Low frequencies --- 162.2214 199.9991 200.7846 |
MO and NBO Analysis
Geometry Comparisons of [N(CH3)4]+, [P(CH3)4]+ and [S(CH3)3]+
| [N(CH3)4]+ | [P(CH3)4]+ | [S(CH3)3]+ | |
|---|---|---|---|
| X-C Bond Length (Å) | 1.51 | 1.82 | 1.82 |
| C-X-C Angle (°) | 109.5 | 109.5 | 102.7 |
It can be seen from the bond angles above that [N(CH3)4]+ and [P(CH3)4]+ have tetrahedral geometries around the nitrogen or phosphorous atom as the bond angles are 109.5°. [S(CH3)3]+ appears to have a trigonal pyramidal structure but its bond angles are smaller than usual bond angles of 107° for this structure.
The bond lengths for phosphorus-carbon and sulphur-carbon bonds are the same which indicate that the bonds are of similar strength. This is as expected as phosphorous and sulphur are of similar size and so the orbital overlap with carbon would be nearly the same. The nitrogen-carbon bond length is shorter, which means that the bond is stronger. Carbon and nitrogen are of similar size and so the orbital overlap is much better than for phosphorous or sulphur, which have more diffuse orbitals. Also nitrogen is smaller than phosphorous and sulphur so has less electrons which means that there is a stronger attraction between the nitrogen nucleus and the electrons from carbon, due to less shielding, and so the bond is stronger.
Charge Distribution Comparisons of [N(CH3)4]+, [P(CH3)4]+ and [S(CH3)3]+
| [N(CH3)4]+ | [P(CH3)4]+ | [S(CH3)3]+ |
|---|---|---|
 |
 |
|
| Charge on: | [N(CH3)4]+ | [P(CH3)4]+ | [S(CH3)3]+ |
|---|---|---|---|
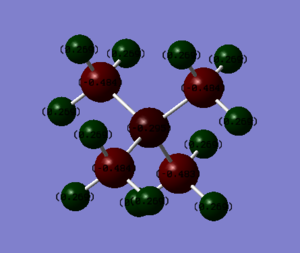
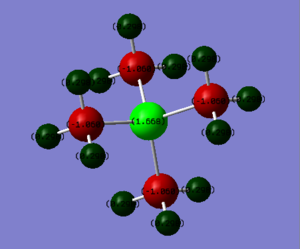
| Heteroatom | -0.295 | 1.668 | 0.917 |
| Carbon | -0.484 | -1.060 | -0.846 |
| Hydrogen | 0.269 | 0.298 | 0.297 (Up)
0.279 (Down) |
| Atom | Electronegativity Value (Pauling) |
|---|---|
| Carbon | 2.55 |
| Nitrogen | 3.04 |
| Phosphorous | 2.19 |
| Sulphur | 2.58 |
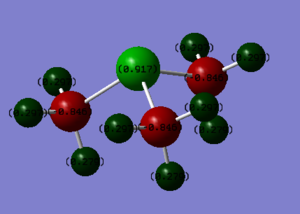
It can be seen that the charge distribution on the central atom changes depending on what the heteroatom is, despite the fact that all molecules have a 1+ charge on the central atom. Nitrogen is more electronegative than carbon and so pulls the electron density towards itself; this means that the charge distribution value is negative despite the formal positive charge on the nitrogen, but less negative than if the molecule had no charge. Phosphorous is less electronegative than carbon so electron density goes towards the carbon, and the phosphorous also has a positive charge. This can clearly be seen in the charge distribution as the phosphorous atom has a high positive value. Sulphur has a similar electronegativity to carbon and so the bond is not likely to be polarised. The charge distribution number is positive for sulphur as there is the positive charge on it but it is not as high as as for phosphorous due to it having the same electronegativity as carbon.
For [NR4]+ molecules, where R = an alkyl group, the positive charge is generally shown on the nitrogen. This is because the lone pair on the nitrogen is used to form a dative covalent bond with the alkyl group and so the nitrogen atom is positively charged. However looking at the charge distributions it can be seen that the only positive values for [N(CH3)4]+ is the hydrogens, indicating that the hydrogens are the atoms that the positive charge should be on. In spite of this, the positive charge could also be assigned to the nitrogen as although negative, it is much less negative than what would be expected for a neutral molecule and is also less negative than the carbon atoms.
NBO Analysis of [N(CH3)4]+, [P(CH3)4]+ and [S(CH3)3]+
| [N(CH3)4]+ | [P(CH3)4]+ | [S(CH3)3]+ | |
|---|---|---|---|
| Contribution of Carbon to C-X Bond | 34% | 60% | 49% |
| Orbitals on Carbon Used for Bonding | s (21%) | s (25%) | s (20%) |
| p (79%) | p (75%) | p (80%) | |
| Contribution of Heteroatom to C-X Bond | 66% | 40% | 51% |
| Orbitals on Heteroatom Used for Bonding | s (25%) | s (25%) | s (17%) |
| p (75%) | p (75%) | p (82%) | |
| d (1%) |
The NBO analysis shows that the contribution of the heteroatom to the C-X bond is as predicted from the electronegativity values. Nitrogen is more electronegative than carbon and so it contributes more to the C-N bond than carbon. Phosphorous is less electronegative than carbon and so contributes less to the C-X compared to carbon. Sulphur has a similar electronegativity to carbon and so both the sulphur and carbon contribute almost equally to the bond.
For the nitrogen it can be seen that it forms four sp3 orbitals which are used to bond to the carbons. The phosphorous also has four sp3 bonds which are used to bond to the sp3 orbitals on the carbon atoms. The sulphur atom's orbitals has a s contribution of 17% and a p contribution of 82% (and the d orbital contributes 1%) and so the orbitals on sulphur are not sp3, sp2 or sp and so cannot be describe by the usual hybridisation model. This may explain why the bond angles are slightly smaller than the usual trigonal pyramidal bond angles.
[N(CH3)3(CH2OH)]+
Optimisation
The method used was B3LYP and the basis set used was 6-31G(d,p).
| Summary Data | Convergence | Jmol | ||
|---|---|---|---|---|
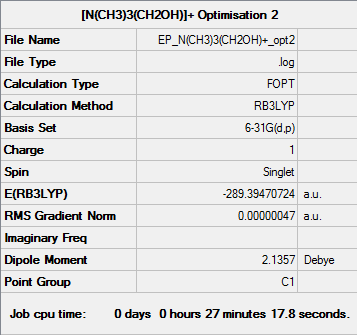 |
Item Value Threshold Converged? Maximum Force 0.000000 0.000015 YES RMS Force 0.000000 0.000010 YES Maximum Displacement 0.000033 0.000060 YES RMS Displacement 0.000008 0.000040 YES |
Frequency
| Summary Data | Low Modes |
|---|---|
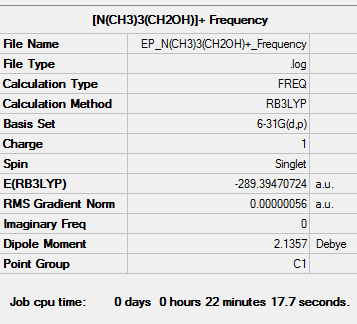 |
Low frequencies --- -8.4574 -5.0336 -1.0455 -0.0008 -0.0004 0.0002 Low frequencies --- 131.1030 213.4626 255.7133 |
MO and NBO Analysis
[N(CH3)3(CH2CN)]+
Optimisation
The method used was B3LYP and the basis set used was 6-31G(d,p).
| Summary Data | Convergence | Jmol | ||
|---|---|---|---|---|
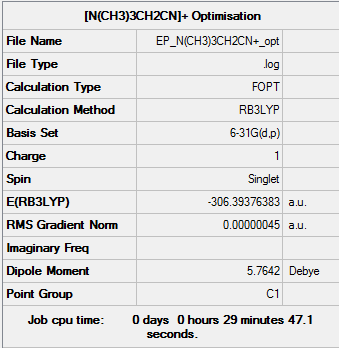 |
Item Value Threshold Converged? Maximum Force 0.000001 0.000015 YES RMS Force 0.000000 0.000010 YES Maximum Displacement 0.000013 0.000060 YES RMS Displacement 0.000004 0.000040 YES |
Frequency
| Summary Data | Low Modes |
|---|---|
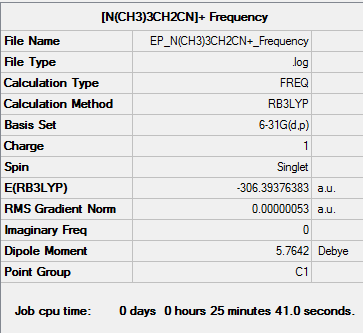 |
Low frequencies --- -2.6366 0.0002 0.0005 0.0006 7.1458 9.6621 Low frequencies --- 91.7739 154.0282 210.9299 |
MO and NBO Analysis
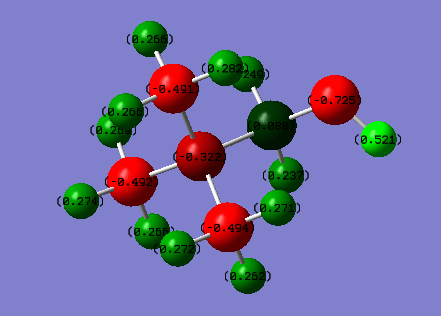
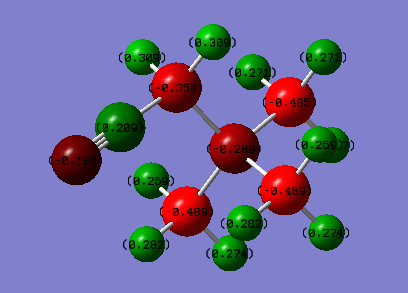
Charge Distribution Comparison of [N(CH3)3(CH2OH)]+ and [N(CH3)3(CH2CN)]+
| [N(CH3)3(CH2OH)]+ | [N(CH3)3(CH2CN)]+ | ||
|---|---|---|---|
| Colour range: -0.5 to 0.5 | |||
 |
| ||
| Atom | Charge | Atom | Charge |
| N | -0.322 | N(central) | -0.289 |
| C(H3) | -0.491 to -0.494 | C(H3) | -0.485 and -0.489 |
| H3 | 0.262 to 0.282 | H3 | 0.269 to 0.282 |
| C(H2OH) | 0.088 | C(H2CN) | 0.358 |
| (C)H2(OH) | 0.237 and 0.249 | (C)H2(CN) | 0.309 |
| O | -0.725 | (CH2)C(N) | 0.209 |
| (O)H | 0.521 | (CH2C)N | -0.186 |
It can be seen from the charge distributions that OH is an electron donating group and CN is an electron withdrawing group. The charge on the central nitrogen is more negative when the OH group is there as electron density is pushed onto the central nitrogen but when the CN group is present the charge on the central nitrogen is more positive as the CN group pulls electrons away from the central nitrogen.
Comparing the HOMO and LUMO of [N(CH3)4]+, [N(CH3)3(CH2OH)]+ and [N(CH3)3(CH2CN)]+
| [N(CH3)4]+ | [N(CH3)3(CH2OH)]+ | [N(CH3)3(CH2CN)]+ | |
|---|---|---|---|
| Picture of HOMO | 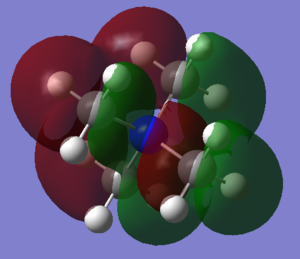 |
 |

|
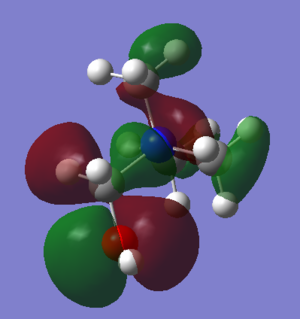
| Energy (au) | -0.57934 | -0.48763 | -0.50048 |
The HOMO for [N(CH3)4]+ is large and encompasses the whole of the molecule. There is a nodal plane down the middle so the shape is symmetrical; this is expected as the molecule itself is very symmetrical. The HOMO for [N(CH3)3(CH2OH)]+ covers less of the molecule and is mostly dominated by the p orbitals on the CH2OH fragment. The HOMO for [N(CH3)3(CH2CN)]+ is similar to that of [N(CH3)3(CH2OH)]+ as it is dominated by the antibonding p orbitals on the CN fragment, but the are far fewer orbitals over the rest of the molecule, only two small p orbitals on two of the carbons.
| [N(CH3)4]+ | [N(CH3)3(CH2OH)]+ | [N(CH3)3(CH2CN)]+ | |
|---|---|---|---|
| Picture of LUMO |  |
 |
|
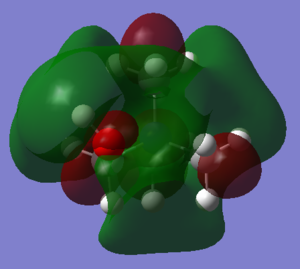
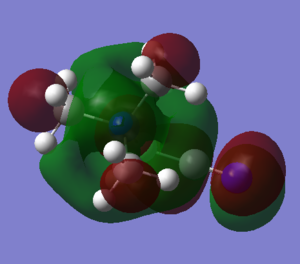
| Energy (au) | -0.13301 | -0.12459 | -0.18183 |
It can be seen that the LUMO for [N(CH3)4]+ is very large and encompasses the whole molecule and it is also very symmetrical. The LUMO for [N(CH3)3(CH2OH)]+ is very similar, it just has been extended for the OH group. The LUMO for [N(CH3)3(CH2CN)]+ is similar to the other two, almost identical for the main part of the molecule, but has extra antibonding p orbitals on the CN fragment. The antibonding p orbitals on CN are much larger than the p orbital on oxygen and s orbital on hydrogen of the OH fragment on [N(CH3)3(CH2OH)]+, which are weakly antibonding, and this explains why the LUMO energy of [N(CH3)3(CH2CN)]+ is larger.
| [N(CH3)4]+ | [N(CH3)3(CH2OH)]+ | [N(CH3)3(CH2CN)]+ | |
|---|---|---|---|
| Energy (au) | 0.44633 | 0.36304 | 0.31865 |
| Energy (kJ/mol) | 1171.84 | 953.16 | 836.62 |
The HOMO-LUMO gap is largest for [N(CH3)4]+, which indicates that it is more stable and hence likely to be less reactive than [N(CH3)3(CH2OH)]+ and [N(CH3)3(CH2CN)]+. This makes sense chemically as the CH2OH group is electron donating and the CH2CN is electron withdrawing so electronically activates the molecule making it more reactive.
Conclusion
It can be seen that changing the central atom in the cations or changing some of the substituents results in the cation having different charge distributions and molecular orbitals and hence different chemical reactivities. Therefore ionic liquids with different properties can be created by using these different types of cations and it should be possible to tune the properties of the ionic liquid by careful selection of the cation.

