Rep:Mod:EllynII
Ellyn Junker 00602040
Bonding (ab initio and density functional molecular orbitals)
BH3
Geometry Optimisation
Firstly a molecule of BH3 was formed in GaussView with trigonal planar geometry. Each B-H bond length was set to 1.5 Å and the molecule was optimised using the B3LYP method and 3-21+G basis set. Although the basis set had a low accuracy (and therefore the benefit of the calculations being quick), as the molecule was quite simple the inaccuracies generated should be insignificant. The optimised geometry had B-H bond lengths of 1.19 Å which correlates with data found in literature[1] and perfect sp2 hybridised bond angles of 120°.
 |
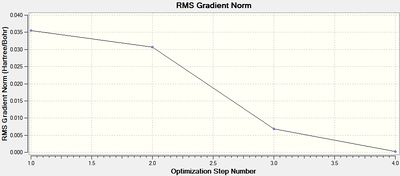 |
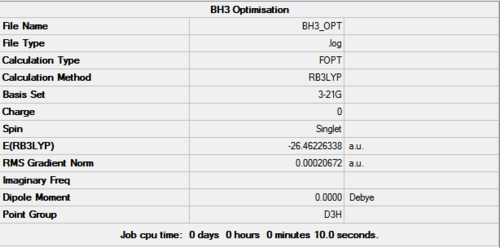
By setting the initial bond lengths to a length that is fairly high for a bond involving a hydrogen atom (1.5 Å), it can be assumed that the molecule would be in a relatively high energy state. Then during the optimisation the program may traverse the calculated potential energy surface of the BH3 molecule and rapidly find the minimum of the curve (where the gradient is zero), minimising the energy and optimising the geometry. It can be seen from the optimisation results that this was completed in four iterations and that the root mean square was very close to zero (0.000207 Hartree/Bohr) (figure 1 and 2) indicating that the optimisation was successful. This is supported in the information produced in the .log file as shown in some extracts below.
Item Value Threshold Converged?
Maximum Force            0.000413     0.000450     YES
RMS     Force            0.000271     0.000300     YES
Maximum Displacement     0.001610     0.001800     YES
RMS     Displacement     0.001054     0.001200     YES
Predicted change in Energy=-1.071764D-06
Optimization completed.
   -- Stationary point found.
                          !   Optimized Parameters   !
                          ! (Angstroms and Degrees)  !
--------------------------                            --------------------------
! Name  Definition              Value          Derivative Info.                !
--------------------------------------------------------------------------------
! R1    R(1,2)                  1.1935         -DE/DX =    0.0004              !
! R2    R(1,3)                  1.1935         -DE/DX =    0.0004              !
! R3    R(1,4)                  1.1935         -DE/DX =    0.0004              !
! A1    A(2,1,3)              120.0            -DE/DX =    0.0                 !
! A2    A(2,1,4)              120.0            -DE/DX =    0.0                 !
! A3    A(3,1,4)              120.0            -DE/DX =    0.0                 !
! D1    D(2,1,4,3)            180.0            -DE/DX =    0.0                 !
--------------------------------------------------------------------------------
The optimisation summary reported that the molecule had a D3h point group which agrees with literature and a dipole moment of zero which is due to its high symmetry (figure 3).
Frequency Analysis
The optimisation calculations in GaussView finds the minimum energy of a potential energy surface by finding the point at which the first derivative of the function is zero (i.e. the gradient is zero). This however can be potentially problematic as the maximum of a curve also has a gradient of zero which would correspond to a transition state. The second derivative of a function indicates whether the critical point is a maximum (negative value) or minimum (positive value). The frequency analysis gives the second derivative, therefore if a frequency has a negative value, this indicates that a transition state has been found and if more than one frequencies are negative then the molecule has not been optimised.
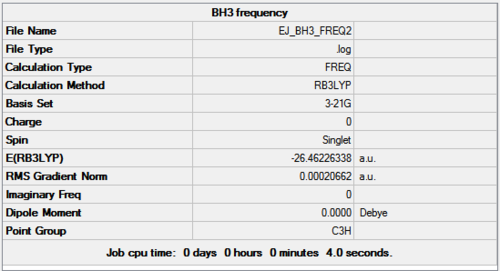
The optimised molecule from section 1 was used to find the frequencies, the total energy was checked in the Summary panel to ensure the same value was obtained as for the original optimisation (figure 4). The vibrational frequencies found are displayed in table 1.
| Symmetry Label | Frequency ( Experimental Literature value[2]) / cm-1 | Intensity | Pictorial representation | Description |
|---|---|---|---|---|
| A2 | 1144 (1132) | 93 |  |
Umbrella deformation: All hydrogens simultaneously bending above and below the plane |
| E' | 1204 (1610) | 12 |  |
Symmetric B-H scissoring: One hydrogen (2H) remains 'stationary' whilst the other two move symmetrically, rocking backward and forward within the plane of the molecule. |
| E' | 1204 (1610) | 12 |  |
Asymmetric B-H rock: All hydrogens rock back and forth, the magnitude of 3H and 4H's rock is less than 2H. |
| A1' | 2598 (-) | 0 |  |
Symmetric B-H stretch: All B-H bonds stretch and compress simultaneously. |
| E' | 2737 (2820) | 104 |  |
Asymmetric B-H stretch: 2H remains stationary whilst the other B-H bonds stretch asymmetrically. |
| E' | 2737 (2820) | 104 |  |
Asymmetric B-H stretch: B-(3)H and B-(4)H bonds stretch symmetrically with respect to each other whilst the B-(2)H bond stretches asymmetrically with respect to these. |
It can be seen from the table none of the frequencies are negative indicating that the most stable state has been found. The computations found 6 vibrational modes for BH3, however the IR spectrum (figure 5) exhibits only 3 absorptions. The vibration of A1' symmetry has an intensity of zero, therefore it does not appear on the spectrum, the asymmetric B-H stretches have the same vibrational frequencies therefore only 1 peak is shown for both of these motions. The case is the same for the symmetric B-H scissoring and asymmetric B-H rock. The calculated values correlate well with the experimental values found in literature, with the exception of the values calculated for the vibrations of E' symmetry at 1210 cm-1 which were reported in literature as 1610 cm-1.

The low frequencies in the .log file were close to zero, indicating that the calculations are fairly accurate.
Low frequencies ---   -0.3355   -0.0330   -0.0046   28.9406   30.1703   30.1722
Low frequencies --- 1152.7700 1209.6407 1209.6430
Molecular Orbitals Analysis
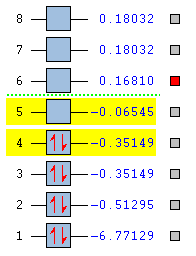
The already optimised BH3 molecule was then used to compute the molecular orbitals using Gaussian. The natural bonding orders were specified as full. The calculations produced the energies seen in figure 6, only the 8 lowest energy molecular orbitals are shown.
The molecular orbitals were visualised in GaussView. An MO diagram may be generated by employing the Linear Combination of Atomic Orbitals (LCAO) method. BH3 may be split into two fragments, the central element B and an H3 fragment in a trigonal planar arrangement. The H3 fragment itself forms three molecular obitals, two of them being degenerate. B is electropositive with respect to H, therefore it is slightly higher in energy than the H3 fragment. The MO diagram is shown in figure 7 with the corresponding MO representations generated in GaussView.
It can be seen from the diagram that the simple MO cartoons drawn in ChemDraw deduced from the LCAO correspond well with the images calculated by Gaussian. This suggests that the Gaussian calculations provide an excellent method for generating MO's pictorially for small molecules like BH3, however for larger molecules, the computations may become very complicated making computational times very long.
A qualitative analysis of the 2e' and 3a1' orbitals makes it difficult to predict their order in terms of energy. The a1 energy levels are lower in energy than e', however the 3a1' orbital has s-s interactions (which are stronger than the s-p interactions in 2e' orbitals) therefore 3a1' could be higher in energy. The quantitative analysis carried out by Gaussian dictates that the 3a1' orbitals are in fact lower in energy (0.16810 Hartrees) than the 2e' orbitals (0.18032 Hartrees).

Charge Distribution and NBO Analysis
The .log file from the optimisation run for the MO analysis was used to assess the NBOs. The charge distribution is depicted by GaussView in a colour-coded fashion, green represents an area of the molecule that is highly positively charged and red represents a strong negative charge. Figure 8 shows that boron is highly positively charged which is expected due to boron's electropositivity and electron deficiency. The numeric charges are also shown, with each hydrogen having the same charge (-0.093) due to the molecule's symmetry. The sum of the charges on the hydrogens cancel out the charge on the boron giving an overall neutral molecule.

The data generated in the .log file is shown below. The data shows that there are 3 B-H bonds, in each bond 45.36% of electron density is contributed by the boron atom and the remaining 54.64% is from the hydrogen. The data also details that the boron atom has 33.33% s-character and 66.66% p-character (from 2 x p-orbitals), indicating that the boron is sp2 hybridised. The hydrogens on the other hand have a 100% contribution from an s-orbital. The core 1s atom of boron is also accounted for (orbital 4). The lone pair should have 100% p-character, however in these calculations it has been defined as 100% s-character, instead it appears that orbital 6 corresponds to the empty p-orbital.
(Occupancy)   Bond orbital/ Coefficients/ Hybrids
---------------------------------------------------------------------------------
    1. (1.99854) BD ( 1) B   1 - H   2
               ( 45.36%)   0.6735* B   1 s( 33.33%)p 2.00( 66.67%)
                                           0.0000  0.5774  0.0000  0.0000  0.0000
                                           0.8165  0.0000  0.0000  0.0000
               ( 54.64%)   0.7392* H   2 s(100.00%)
                                           1.0000  0.0001
    2. (1.99854) BD ( 1) B   1 - H   3
               ( 45.36%)   0.6735* B   1 s( 33.33%)p 2.00( 66.67%)
                                           0.0000  0.5774  0.0000  0.7071  0.0000
                                          -0.4082  0.0000  0.0000  0.0000
               ( 54.64%)   0.7392* H   3 s(100.00%)
                                           1.0000  0.0001
    3. (1.99854) BD ( 1) B   1 - H   4
               ( 45.36%)   0.6735* B   1 s( 33.33%)p 2.00( 66.67%)
                                           0.0000  0.5774  0.0000 -0.7071  0.0000
                                          -0.4082  0.0000  0.0000  0.0000
               ( 54.64%)   0.7392* H   4 s(100.00%)
                                           1.0000  0.0001
    4. (1.99954) CR ( 1) B   1           s(100.00%)
                                           1.0000  0.0000  0.0000  0.0000  0.0000
                                           0.0000  0.0000  0.0000  0.0000
    5. (0.00000) LP*( 1) B   1           s(100.00%)
    6. (0.00000) RY*( 1) B   1           s(  0.00%)p 1.00(100.00%)
Summary of Natural Population Analysis:

                                      Natural Population
               Natural  -----------------------------------------------
   Atom  No    Charge         Core      Valence    Rydberg      Total
-----------------------------------------------------------------------
     B    1    0.27816      1.99954     2.72230    0.00000     4.72184
     H    2   -0.09272      0.00000     1.09256    0.00015     1.09272
     H    3   -0.09272      0.00000     1.09256    0.00015     1.09272
     H    4   -0.09272      0.00000     1.09256    0.00015     1.09272
=======================================================================
  * Total *    0.00000      1.99954     6.00000    0.00046     8.00000
The Second Order Perturbation Theory Analysis of Fock Matrix in the NBO Basis shows that there is little mixing of orbitals in BH3 as all E(2) values are low (0.7 kcal mol-1).
TlBr3
Like BH3, TlBr3 has trigonal planar geometry. However, it is far more complex due to the increased number of electrons, TlBr3 has 186 compared to borotrihydride's 8 electons. Thus, the computations required are more demanding as TlBr3's electrons exhibit relativistic character and the computations, which utilised Schrödinger's equation, used in the calculations for BH3 are no longer sufficient. It may be assumed for systems such as TlBr3 that it is only the valence electrons that participate in bonding and the core electrons may be modelled using pseudo-potentials. A larger basis set must also be used to cope with heavier elements, therefore LanL2DZ was used, which also incorporates the afore mentioned pseudo-potentials.
Geometry Optimisation
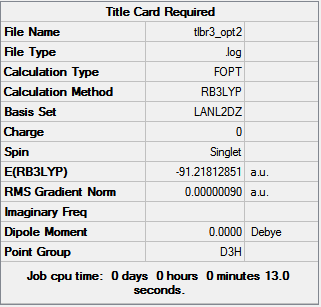
The geometry of TlBr3 was optimised with Gaussian using the method DFT/B3LYP and the basis set LanL2DZ which uses pseudo potentials suitable for heavier atoms such as Thallium. The molecule's geometry was restricted to the D3h point group. The optimised molecule had Tl-Br bond lengths of 2.65 Å and bond angles of 120.0° which is a perfect sp2 hybridised bond angle. The summary of the optimisation is shown in figure 9.
 |
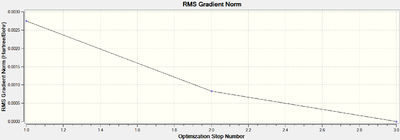 |
The total energy profile (figure 10) shows that the optimisation was achieved in 3 iterations and the root mean square graph (figure 11) shows that optimisation was achieved as the final value for the RMS was 8.98 x 10⁻⁷ Hartree/Bohr. This was supported in the .log[3] file which shows that a stationary point was found (below).
Item               Value     Threshold  Converged?
Maximum Force            0.000002     0.000450     YES
RMS     Force            0.000001     0.000300     YES
Maximum Displacement     0.000022     0.001800     YES
RMS     Displacement     0.000014     0.001200     YES
Predicted change in Energy=-6.082801D-11
Optimization completed.
   -- Stationary point found.
 ----------------------------
                          !   Optimized Parameters   !
                          ! (Angstroms and Degrees)  !
--------------------------                            --------------------------
! Name  Definition              Value          Derivative Info.                !
--------------------------------------------------------------------------------
! R1    R(1,2)                  2.651          -DE/DX =    0.0                 !
! R2    R(1,3)                  2.651          -DE/DX =    0.0                 !
! R3    R(1,4)                  2.651          -DE/DX =    0.0                 !
! A1    A(2,1,3)              120.0            -DE/DX =    0.0                 !
! A2    A(2,1,4)              120.0            -DE/DX =    0.0                 !
! A3    A(3,1,4)              120.0            -DE/DX =    0.0                 !
! D1    D(2,1,4,3)            180.0            -DE/DX =    0.0                 !
--------------------------------------------------------------------------------
Frequency Analysis
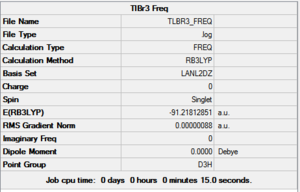
The same method for calculating the frequencies that was used for BH3 was used for TlBr3, but the LanL2DZ basis set was used. The summary for the calculations is shown in figure 12.
| Symmetry Label | Frequency ( Experimental Literature value[4]) / cm-1 | Intensity | Pictorial representation | Description |
|---|---|---|---|---|
| E' | 46 (1132) | 4 |  |
Symmetric Tl-Br Scissoring: Two bromines move symmetrically, rocking backward and forward within the plane of the molecule. |
| E' | 46 (1610) | 4 |  |
Asymmetric Tl-Br rock:All bromines rock back and forth, the magnitude of 2 bromines rock is less than the other. |
| A2 | 52 (1610) | 6 |  |
Umbrella deformation: All bromines bend simultaneously in and out of the plane, with the Tl moving in the opposite direction. |
| A1' | 165 (-) | 0 |  |
Symmetric Tl-Br stretch: All Tl-Br bonds stretch and compress simultaneously. |
| E' | 210 (2820) | 24 |  |
Asymmetric Tl-Br stretch: One bromine remains stationary whilst the other Tl-Br bonds stretch asymmetrically. |
| E' | 210 (2820) | 24 |  |
Asymmetric Tl-Br stretch: Two Tl-Br bonds stretch symmetrically with respect to each other whilst the other Tl-Br bond stretches asymmetrically with respect to these. |
Like BH3, TlBr3 has 6 vibrations. None of these vibrations are negative, suggesting a energetically stable state has been found rather than a transition state. The vibrations are very similar to BH3, however they all occur at a much lower frequency, this is credited to its increased mass.
The IR spectrum (figure 13) shows only 3 peaks, with 2 of these peaks (at 52 and 46 cm-1) merged into one broad peak. As seen for BH3, the asymmetric Tl-BR stretches have the same frequency, therefore only one peak is present for these two vibrational modes. This is again the case for the symmetric Tl-Br scissoring and asymmetric Tl-Br rock at 46 cm-1. The a2 vibration has an intensity of zero, so it is not present in the spectrum.

The low frequencies taken from the .log file are shown below.
Low frequencies --- -3.4213 -0.0026 -0.0004 0.0015 3.9367 3.9367
The largest low frequency (3.9367 cm-1) is an order of magnitude smaller than the lowest molecular vibration, therefore the calculations can be considered as fairly accurate.
What is a bond?
Gaussview has a predefined list of bond lengths, occasionally when the optimised bond lengths of a molecule exceed these values, GaussView does not draw the bond between the two atoms. In inorganic chemistry, bond lengths can often be longer than those that occur in organic molecules, especially where heavier atoms are concerned therefore they are not recognised by GaussView. It therefore must be established what constitutes as a bond. There are 3 main types of bonding in chemistry: metallic, covalent and ionic. Metallic bonding may be considered as a lattice of positively charged ions bound by their delocalised electrons. Covalent bonding arises as a result of orbital overlap between 2 (or more) atoms. And ionic bonding occurs between ions of opposite charge which have an electrostatic interaction. Therefore precautions have to be taken when analysing the optimised molecules, chemical knowledge needs to be used in conjunction with the GaussView output.
Mo(CO)4L2
The metal complex Mo(CO)4L)2 can exist as two geometric isomers, the cis- and trans- form. Infra-red spectroscopy is a useful tool in inorganic chemistry as geometry and ligands can have diverse effects on the stretching frequencies of some key ligands, for example the carbonyl ligand. By observing IR spectra, the geometry of a complex may be deduced. This effect is going to be modelled in this section using cis- and trans- Mo(CO)4(PCl3)2. The PCl3 ligands will be used as they incorporate some degree of steric bulk without incorporating too many electrons (which would make the calculations far more complex).
Geometry Optimisation
The geometry of cis- and trans-Mo(CO)4(PCl3)2 was optimised using the DFT/B3LYP method and LanL2MB basis set (which incorporates pseudo-potentials that cope with heavy atoms) under a loose convergence keyword (allowing the limits to be large enough for the first derivative to converge). The output .log files (cis-[5] and trans-[6]) confirmed that a minimum energy had been found (below).
        Item               Value     Threshold  Converged?
Maximum Force            0.000164     0.002500     YES
RMS     Force            0.000054     0.001667     YES
Maximum Displacement     0.004642     0.010000     YES
RMS     Displacement     0.001568     0.006667     YES
Predicted change in Energy=-7.870871D-07
Optimization completed.
   -- Stationary point found.
Trans- optimisation
       Item               Value     Threshold  Converged?
Maximum Force            0.000282     0.002500     YES
RMS     Force            0.000083     0.001667     YES
Maximum Displacement     0.005699     0.010000     YES
RMS     Displacement     0.001408     0.006667     YES
Predicted change in Energy=-1.577924D-06
Optimization completed.
   -- Stationary point found.
Cis- optimisation
The summaries for the optimisations are shown in figure 14.
 |
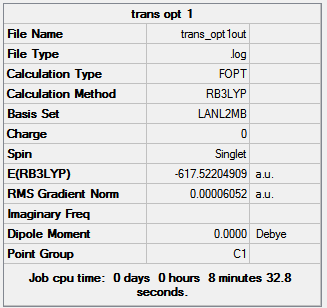 | |||
| Figure 14: Summaries of the first geometry optimisation of cis- and trans- Mo(CO)4(PCl3)2 | ||||
In the case of metal complexes such as the ones being studied, it may be the case that there is more than one minimal point on the potential energy surface diagram, therefore although a minimum has been found, it may not be the desired minimum. Therefore the dihedral angles of the phosphorus ligands must be optimised.
The output from the Gaussian calculation was visualised on GaussView and the geometry of the PCl3 ligands were optimised manually by changing the dihedral angle of the Cl-P-Mo-C bonds. The cis- form was arranged so that one chlorine on one phosphorus ligand has a dihedral angle of 0° with respect to an axial carbonyl ligand and the other phosphorus ligand has one chlorine with a dihedral angle of 180° with respect to that same carbonyl ligand. The trans- form was adjusted so that the chlorines were eclipsed and and Cl of each ligand was parallel to an Mo-C bond.
The method was kept the same, however the basis was changed to LanL2DZ and the convergence criteria was tightened using the keywords: int=ultrafine scf=conver=9. Again the output .log files (cis-[7] and trans-[8]) confirmed that a minimum point had been found.
        Item               Value     Threshold  Converged?
Maximum Force            0.000014     0.000450     YES
RMS     Force            0.000004     0.000300     YES
Maximum Displacement     0.001680     0.001800     YES
RMS     Displacement     0.000397     0.001200     YES
Predicted change in Energy=-4.377245D-09
Optimization completed.
   -- Stationary point found.
cis- 2nd optimisation
        Item               Value     Threshold  Converged?
Maximum Force            0.000077     0.000450     YES
RMS     Force            0.000023     0.000300     YES
Maximum Displacement     0.001665     0.001800     YES
RMS     Displacement     0.000276     0.001200     YES
Predicted change in Energy=-1.064895D-07
Optimization completed.
   -- Stationary point found.
trans- 2nd optimisation
The summaries are shown in figure 15. It can be seen that the energies of the isomers after the second optimisation are far lower than those after the first optimisation by approximately 15880 kJ mol-1. Thus suggesting that the initial structure was not the true minimum.
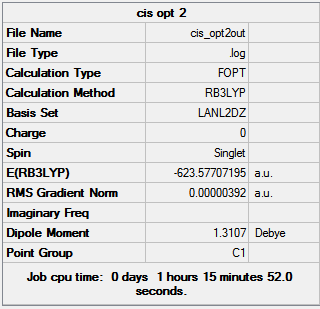 |
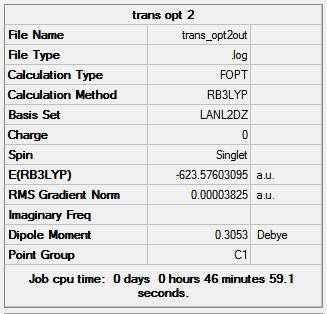 | |||
| Figure 15: Summaries of the second geometry optimisation of cis- and trans- Mo(CO)4(PCl3)2 | ||||
Advanced Optimisation
The calculations set up by Gaussian does not take into account phosphorus's low-lying d-orbitals which may be used for bonding. In the case of metal complexes, phosphorus based ligands use these orbitals in bonding to the metal center, making it hypervalent. Extra terms needed to be incorporated into the .gjf file manually, adding the d-function to the phosphorus atoms. The output .log files (cis-[9] and trans-[10]) again confirmed that a stationary point was found.
        Item               Value     Threshold  Converged?
Maximum Force            0.000140     0.000450     YES
RMS     Force            0.000045     0.000300     YES
Maximum Displacement     0.001122     0.001800     YES
RMS     Displacement     0.000415     0.001200     YES
Predicted change in Energy=-2.462818D-07
Optimization completed.
   -- Stationary point found.
cis- 3rd optimisation
        Item               Value     Threshold  Converged?
Maximum Force            0.000017     0.000450     YES
RMS     Force            0.000007     0.000300     YES
Maximum Displacement     0.001686     0.001800     YES
RMS     Displacement     0.000383     0.001200     YES
Predicted change in Energy=-2.058800D-08
Optimization completed.
   -- Stationary point found.
trans- 3rd optimisation
The summaries for cis- and trans- optimisations are shown in figure 16.
 |
 | |||
| Figure 16: Summaries of the final geometry optimisation of cis- and trans- Mo(CO)4(PCl3)2 | ||||
| cis- Bond lengths / Å | trans- bond lengths / Å | |||||
| Bond | Calculated (Visualise) | Literature[11] | Error / % | Calculated (Visualise) | Literature[12] | Error / % |
|---|---|---|---|---|---|---|
| Mo-C | 2.055a 2.021b | 2.01 | 2.2 | 2.057 | 1.87 | 9.1 |
| C-O | 1.175a 1.176b | 1.15 | 2.1 | 1.174 | 1.15 | 2.0 |
| Mo-P | 2.476 | 2.58 | -4.1 | 2.422 | 2.37 | 2.1 |
| P-Cl | 2.119 | 2.06[13] | 2.9 | 2.119 | 2.06[13] | 2.9 |
a Carbonyl groups that are trans to another carbonyl b Carbonyl groups that are trans to PCl3
The calculated bond lengths have been compared to those found in literature for the cis- and trans- form of Mo(CO)4(PPh3)2 and the P-Cl bond lengths are quoted from an organophosphorus compound. Despite this the bond lengths calculated correlate well with those reported in literature.
Generally the bond lengths are very similar for both complexes, however in the cis- isomer there are two different Mo-C and C-O bond lengths present. The Mo-C bond lengths for carbonyls trans- to the phosphorus groups are shorter than those that are trans- to another carbonyl; this is a result of the trans-effect. The phosphorus ligands are able to donate electron density to the metal center which can then exert a greater degree of back-bonding to the carbonyl ligand, strengthening the Mo-C bond (making it shorter) and also slightly increasing the length of the C-O bond due to the added electron density into the π*C-O orbital.
Frequency Analysis
The frequency calculations were run keeping the method, basis set and keywords the same as for the geometry optimisation and also the inclusion of the extra basis term run in the advanced optimisation. The resulting output .log files (cis-[14] and trans-[15]) produced the spectra shown in figure 17 and 18.
 |
 |
| Symmetry Label | Frequency ( Experimental Literature value[16]) / cm-1 | Intensity | Pictorial representation | Description |
|---|---|---|---|---|
| - | 12 (-) | 0.016 |  |
Rotation of PCl3 groups: The PCl3 groups twist around the Mo-P bond symmetrically causing the Mo(CO)4 plane to twist asymmetrically to the phosphorus ligands. |
| - | 20 (-) | 0.004 |  |
Rotation of PCl3 groups: The PCl3 groups twist around the Mo-P bonds asymmetrically. |
| Eu | 1938 (1986) | 1605 |  |
Asymmetric C-O stretch: The carbonyls trans to each other stretch asymmetrically. |
| Eu' | 1942 (1994) | 813 |  |
Asymmetric C-O stretch: The other carbonyl groups trans to each other stretch asymmetrically. |
| B1g' | 1952 (2004) | 588 |  |
Asymmetric C-O stretch (all): The carbonyls trans to each other stretch symmetrically with respect to each other but asymmetrically with respect to the other two carbonyls. |
| A1g' | 2019 (2072) | 104 |  |
Symmetric C-O stretch (all): All carbonyl groups strecth symmetrically with respect to each other. |
| Symmetry Label | Frequency ( Experimental Literature value[17]) / cm-1 | Intensity | Pictorial representation | Description |
|---|---|---|---|---|
| - | 4 (-) | 0.055 |  |
Rotation of PCl3 groups: The PCl3 groups twist around the Mo-P bond symmetrically. |
| - | 7 (-) | 0.000 |  |
Rotation of PCl3 groups: The PCl3 groups twist around the Mo-P bond asymmetrically. |
| B2 | 1939 (1896 vs) | 1606 |  |
Asymmetric C-O stretch: The carbonyls trans to each other stretch asymmetrically. |
| B2' | 1940 (1896 vs) | 1606 |  |
Asymmetric C-O stretch: The carbonyl groups trans to the PCl3 groups stretch asymmetrically. |
| A1' | 1967 (1953 m) | 6 |  |
Asymmetric C-O stretch (all): The carbonyls trans to each other stretch symmetrically with respect to each other but asymmetrically with respect to the other two carbonyls. |
| A1' | 2026 (-) | 5 |  |
Symmetric C-O stretch (all): All carbonyl groups stretch symmetrically with respect to each other. |
The computationally predicted frequencies of cis-Mo(CO)4(PCl3)2 correlate with the experimental results reported in literature. No reported infrared vibrations for trans-Mo(CO)4(PCl3)2 could be found, therefore the vibrations were compared with an IR spectrum of trans-Mo(CO)4(PPh3)2, despite this the values were fairly similar with the greatest percentage difference being 2.3%, suggesting the computationally simpler PCl3 model provides a fairly accurate alternative model for PPh3.
The IR spectrum of the cis- form (figure 16) shows 3 peaks in the carbonyl stretching region even though there are 4 carbonyl stretching modes. This is because two of the asymmetric stretches have very similar stretching frequencies (1938 and 1942 cm-1), however this causes the peak to seem quite broad. The IR spectrum for the trans- form (figure 17) shows just 1 peak in the carbonyl stretching region. Due to the complex's high symmetry, two of the vibrational modes (asymmetric stretches) are almost identical, therefore they produce just one sharp peak. The vibrational modes that correspond to all the carbonyls stretching (asymmetrically and symmetrically) have very low intensities as they cause very little change in the complex's dipole - also attributed to its high symmetry.
The point group recorded by Gaussian for both the cis- and trans- forms was C1, however it is known that cis- has the point group C2v and trans- D4h. The low frequency vibrations for cis- (12 and 20 cm-1) and trans- (4 and 7 cm-1) correspond to the twisting of the PCl3 groups about the P-Mo bonds. They disrupt the overall symmetry of the complexes, and therefore Gaussian considers their symmetry to be lower than it is when it is stationary.
Energies Analysis
The energy of the trans- isomer after the final optimisation was lower than that of the cis- isomer by 3.266 kJ mol-1, thus suggesting that the trans isomer is more thermodynamically stable than the cis. It is known[18] that upon heating the cis isomer it converts to the trans thus supporting that it is the most stable isomer. This stability is also reflected in the melting temperature of the two isomers with the melting point of the cis- isomer (148-150 °C[19]) being lower that that of the trans (163-168 °C[20]).
The cis isomer is higher in energy due to the steric clash between the large phosphorus chloride groups. Metal complexes are highly important in catalytic cycles and one isomer may be more active than the other. The effect of changing the size of the ligands on the stability of different isomers may be modelled using the techniques employed in this section, giving a chemist an idea of which ligands may be most effective, and therefore avoiding the waste of chemicals and time in the lab experimenting with different ligands.
Mini Project - Geometrical isomers of [ZrF7]3-
Ziconium, a group IV metal, commonly exists in its +4 oxidation state, due to the instability of the lower oxidation states[21]. It is capable of high coordination, with oxygen-donor ligands and hard fluoride ligands being favoured. Charged ziconium fluoride clusters exist as salts, the ziconium may extend its coordination number from 4 to 8 with the general formula for this series being [ZrFn]n-4[22]. The zirconium fluoride clusters may exist as several geometric isomers depending on the counter-ion it is coupled with. The subject of this study, [ZrF7]3-, exists as two different geometric isomer - pentagonal bipyramidal and monocapped trigonal prismatic. The geometry, energies, vibrational frequencies and molecular orbitals of these two isomers will be studied.
Geometry Optimisation of [ZrF7]3-
The structures were drawn in GaussView and then initially optimised using B3LYP as the method and the basis set 3-21+G. The were then treated with a more accurate basis set by introducing pseudo-potentials to accommodate the additional effects of having a heavy atom - zirconium. LanL2DZ was used for zirconium and 6-311+G(d,p) for the flourine atoms.
Pentagonal bipyramidal [ZrF7]3-
After the second optimisation[23] (visualise) the frequencies were calculated[24], keeping the basis set the same. Two of the frequencies were negative (-42 and -32 cm-1) indicating that a transition state had been found. The negative vibrations showed the equatorial fluorines bending in and out of the plane (figure 19), indicating that these planar deformations were associated with the transition state. Therefore the positioning of the equatorial flourine atoms were adjusted so that 3 were bent above the plane and 2 below. The new geometry was re-optimised using the same pseudo potentials and basis sets as before[25] and the frequencies[26] were calculated. There were no negative frequencies thus indicating that the optimisation was successful and the optimum geometry (visualise) had been found. The structure has been reported in literature[21] as having the equatorial fluorine atoms in one plane, making the point group D5h, however the point group of the optimised geometry is C1 due to the equatorial fluorines being bent out of the plane. When the geometry is computed it is considered as an isolated molecule in the gas phase, however this ion exists as a solid salt - therefore the differences in geometry compared to those in literature may be because the interactions with the counter-ion and surrounding molecules are not taken into account.
 |
 |
| Figure 19: Vibrations associated with the transition state of the pentagonal bipyramidal form of [ZrF7]3- | |
The equatorial Zr-F bonds are similar in length, ranging from 2.126-2.130 Å. The axial bonds are shorter at 2.097 Å. The distances between the equatorial fluorines is approximately 2.5 Å, which is shorter than the sum of their van der Waal's radii, thus suggesting there is some repulsion between the fluorines. This hence explains the longer bond distance from the zirconium (c.f. the axial bonds) in order to avoid excessive repulsion from close contact. The bond lengths correlate well with those found in literature for similar compounds (Zr-F ~2.1 Å[27]).
Monocapped trigonal prismatic [ZrF7]3-
Use of the LanL2DZ basis set posed problems for this isomer as Gaussian optimised it into the pentagonal bipyramidal form. Therefore a different basis set was used for the ziconium (MWB28) and the optimisation was successful[28] (visualise).
The bond lengths in the optimised geometry range from 2.128-2.154 Å, they are generally longer than as seen for the pentagonal bipyramidal form. Again the point group for this molecule is C1, whereas it is reported in literature[21] as C2v, this is most probably, as explained above, due to the lack of interactions with surrounding molecules.
The difference in energy between the two isomers is 937.1 kJ mol-1 with the pentagonal bipyramidal isomer being lower in energy - indicating it is more thermodynamically stable.
Vibrational Analysis [ZrF7]3-
The vibrational spectra for both isomers are shown in figure 20.
| Figure 20: IR spectra of the isomers. | ||||
Literature[29] states that the monocapped trigonal prismatic isomer should have 15 infrared vibrational frequencies due to its symmetry. However 17 vibrational frequencies were calculated for this molecule, the strongest frequencies are depicted in figure 21. This may be due to the symmetry being lower thus additional vibrational modes result.
It is also stated in literature[29] that the pentagonal bipyramidal isomer should have 10 vibrational modes however 18 were calculated, again this is probably attributed to the decreased symmetry. It has strong absorptions at approximately 245, 270, 440 and 464 cm-1, it has been reported in literature[27] that Zr-F stretching frequencies occur at 510 cm-1 and bending at 428 and 325 cm-1 for similar structures. The calculated vibrations are in the same region as those reported in literature. The differences in the spectra lie in the stretching region where for the monocapped trigonal prismatic isomer the vibrations are at a slightly lower frequency (377-393 cm-1).
Molecular Orbital Analysis [ZrF7]3-
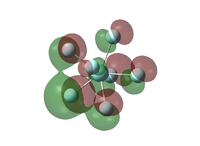
The molecular orbitals for both isomers were calculated by specifying the natural bonding orbitals as full. The filled orbitals were visualised in GaussView. The seven orbitals lowest in energy for both isomers correspond to the core 1s orbitals of the fluorine atoms and orbital 8 is the core s orbital of zirconium. Generally, the molecular orbitals lowest in energy show strongly bonding interactions between the zirconium and the fluorines. For example the low energy 2p-orbitals of zirconium form a bonding interaction with the 2s orbitals of the flourine atoms in the pentagonal bipyramidal form forming orbitals 9-11 (figure 23).
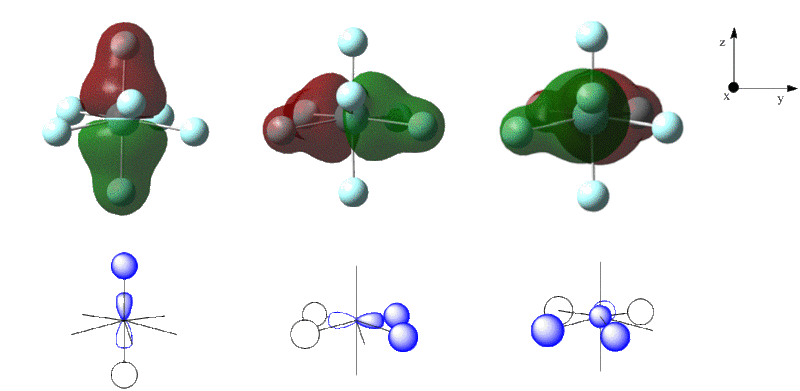
The zirconium d-orbitals form bonding interactions with the p-orbitals of the fluorines - this results bonding interactions that spread over the whole cluster - thus the bonding is generally the same between each fluorine and the central zirconium. Some examples from the pentagonal bipyramidal isomer are shown in figure 24.
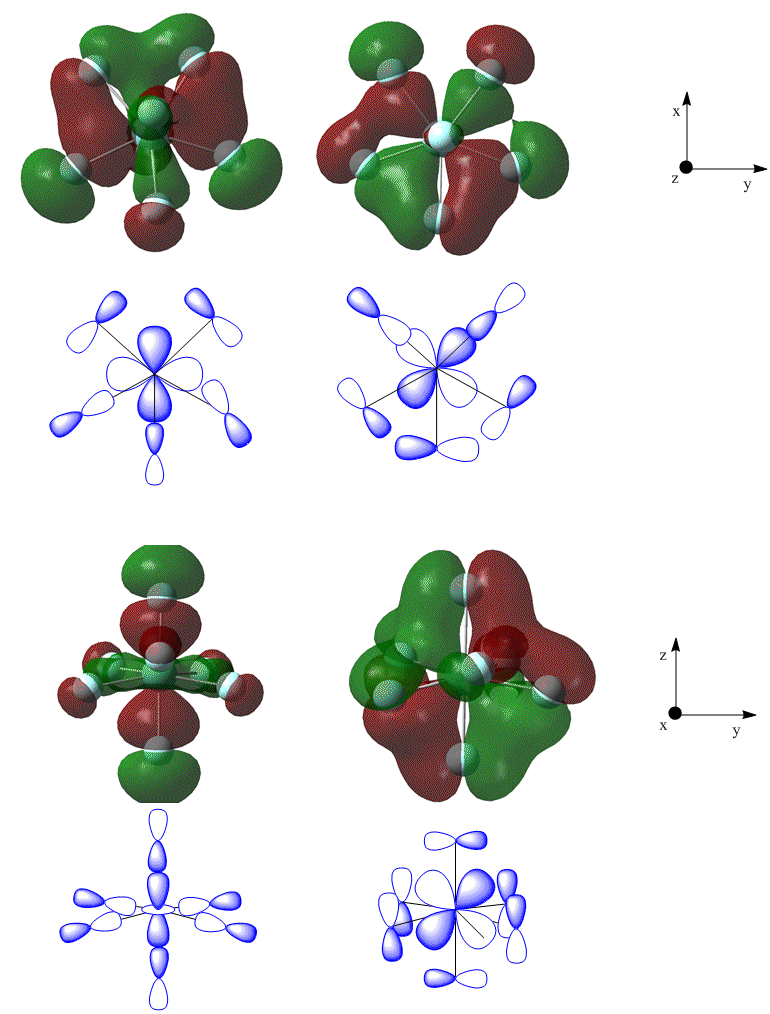
It may also be seen from the molecular orbital representations that there are bonding interactions between adjacent fluorine atoms.
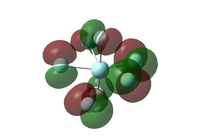
The low energy bonding interactions for the monocapped trigonal prismatic form are for the most part very similar to those in the pentagonal bipyramidal isomer. The main differences lie in the higher energy orbitals close to the HOMO. The HOMO for both isomers consists of antibonding interactions between the p-orbitals of the fluorine atoms (figure 25). The bonding interactions may contribute towards the increased stability of the pentagonal bipyramidal isomer.
 |
 |
| Figure 25: The HOMO of both isomers | |
The 4 orbitals below the HOMO for the monocapped trigonal prismatic form are very similar to the HOMO, with antibonding interactions between the non-bonded fluorine atoms with much of the electron density evenly spread. The orbitals that are below the HOMO in the pentagonal bipyramidal form exhibit some bonding interactions between fluorines which have their phases correctly orientated.
 |
 |
 |
 |
| Figure 26: Molecular orbitals of the pentagonal bipyramidal isomer | |||
 |
 |
 |
 |
| Figure 27: Molecular orbitals of the monocapped trigonal prismatic isomer | |||
Natural Bond Orbital Analysis [ZrF7]3-
The .out files from the MO analysis provided information about the NBOs of each isomer. For both the pentagonal bipyramidal and monocapped trigonal prismatic isomer, the central zirconium atom is positively charged and the negative charge is localised on the fluorine atoms, therefore indicating that the electron density is localised on the fluorine atoms. This is expected at fluorine is highly electronegative (4.0) compared to zirconium (1.4).
The axial fluorines (atoms 6 and 7) in the pentagonal bipyramidal isomer have a slightly more negative charge than the equatorial fluorines (figure 28). This is reflected in its small dipole moment of 0.1974 Debye.
The negative charge in the monocapped trigonal prismatic isomer is also not spread evenly between the fluorine atoms - however there seems to be no correlation as to why in this isomer, this and the lower symmetry (c.f. pentagonal bipyramidal isomer) results in this isomer having a higher dipole of 0.3178 Debye.
 |
 |
Pentagonal bipyramidal [ZrF7]3-
An extract from the bond orbital analysis of the seven Zr-F bonds is shown below.
      (Occupancy)   Bond orbital/ Coefficients/ Hybrids
---------------------------------------------------------------------------------
    1. (1.99438) BD ( 1)Zr   1 - F   2
               (  6.52%)   0.2554*Zr   1 s( 13.61%)p 2.76( 37.51%)d 3.59( 48.88%)
                                           0.0000  0.3690 -0.0004  0.0000  0.3074
                                          -0.1983  0.0001  0.4085 -0.2681  0.0000
                                           0.0442 -0.0245  0.6039  0.0862  0.1689
                                           0.0290  0.1083  0.0122 -0.1137 -0.0135
                                          -0.2478 -0.0294
               ( 93.48%)   0.9668* F   2 s( 50.41%)p 0.98( 49.59%)d 0.00(  0.01%)
                                           0.0000  0.7100 -0.0055  0.0001 -0.4217
                                          -0.0041  0.0003 -0.5568 -0.0051  0.0004
                                          -0.0892 -0.0009  0.0001  0.0065  0.0010
                                           0.0015 -0.0017 -0.0034
    2. (1.99596) BD ( 1)Zr   1 - F   3
               (  6.65%)   0.2578*Zr   1 s( 13.67%)p 2.48( 33.87%)d 3.84( 52.46%)
                                           0.0000  0.3697 -0.0014 -0.0001 -0.4712
                                           0.3077  0.0000 -0.1158  0.0739  0.0000
                                           0.0515 -0.0209  0.3026  0.0461 -0.2783
                                          -0.0454 -0.0830 -0.0143  0.5206  0.0769
                                          -0.2570 -0.0358
               ( 93.35%)   0.9662* F   3 s( 49.40%)p 1.02( 50.59%)d 0.00(  0.01%)
                                           0.0000  0.7028 -0.0055  0.0001  0.6846
                                           0.0064 -0.0005  0.1715  0.0017 -0.0001
                                          -0.0879 -0.0011  0.0001  0.0032 -0.0019
                                          -0.0005  0.0059 -0.0033
    3. (1.99482) BD ( 1)Zr   1 - F   4
               (  6.55%)   0.2559*Zr   1 s( 13.83%)p 2.61( 36.10%)d 3.62( 50.07%)
                                           0.0000  0.3718 -0.0004  0.0000 -0.0590
                                           0.0430 -0.0001 -0.4972  0.3225  0.0000
                                          -0.0600  0.0304  0.0489  0.0030 -0.0304
                                          -0.0090  0.2835  0.0429 -0.5948 -0.0851
                                          -0.2308 -0.0286
               ( 93.45%)   0.9667* F   4 s( 50.24%)p 0.99( 49.75%)d 0.00(  0.01%)
                                           0.0000  0.7088 -0.0055  0.0001  0.0713
                                           0.0004 -0.0001  0.6923  0.0065 -0.0005
                                           0.1143  0.0012 -0.0001  0.0011  0.0003
                                           0.0023 -0.0066 -0.0032
    4. (1.99436) BD ( 1)Zr   1 - F   5
               (  6.52%)   0.2554*Zr   1 s( 13.47%)p 2.81( 37.79%)d 3.62( 48.75%)
                                           0.0000  0.3670 -0.0003  0.0001  0.4746
                                          -0.3111  0.0000 -0.1962  0.1299  0.0000
                                           0.0192 -0.0110 -0.4279 -0.0605  0.1026
                                           0.0170  0.0336  0.0102  0.4620  0.0668
                                          -0.2641 -0.0314
               ( 93.48%)   0.9668* F   5 s( 50.26%)p 0.99( 49.73%)d 0.00(  0.01%)
                                           0.0000  0.7089 -0.0055  0.0001 -0.6500
                                          -0.0061  0.0005  0.2703  0.0024 -0.0002
                                          -0.0406 -0.0004  0.0000 -0.0048  0.0007
                                          -0.0005  0.0049 -0.0035
    5. (1.99001) BD ( 1)Zr   1 - F   6
               (  6.03%)   0.2455*Zr   1 s( 15.85%)p 3.01( 47.66%)d 2.30( 36.49%)
                                           0.0000  0.3981  0.0039  0.0000 -0.0205
                                           0.0168  0.0000 -0.0378  0.0220  0.0001
                                           0.6109 -0.3175 -0.0292 -0.0044  0.0876
                                           0.0152 -0.0436 -0.0026 -0.0412 -0.0062
                                           0.5923  0.0402
               ( 93.97%)   0.9694* F   6 s( 58.11%)p 0.72( 41.88%)d 0.00(  0.01%)
                                           0.0000  0.7623 -0.0057  0.0000  0.0113
                                          -0.0001  0.0000  0.0288  0.0003  0.0000
                                          -0.6464 -0.0061  0.0009 -0.0001  0.0000
                                          -0.0006 -0.0002  0.0078
    6. (1.99000) BD ( 1)Zr   1 - F   7
               (  6.03%)   0.2455*Zr   1 s( 15.68%)p 3.05( 47.89%)d 2.32( 36.43%)
                                           0.0000  0.3959  0.0030  0.0000  0.0743
                                          -0.0391  0.0000  0.0375 -0.0219 -0.0001
                                          -0.6082  0.3163  0.0340  0.0046 -0.1937
                                          -0.0216 -0.0424 -0.0026  0.0421  0.0057
                                           0.5659  0.0369
               ( 93.97%)   0.9694* F   7 s( 58.19%)p 0.72( 41.80%)d 0.00(  0.01%)
                                           0.0000  0.7628 -0.0057  0.0000 -0.0608
                                          -0.0008  0.0001 -0.0293 -0.0003  0.0000
                                           0.6430  0.0060 -0.0009  0.0002 -0.0015
                                          -0.0006  0.0002  0.0077
    7. (1.99538) BD ( 1)Zr   1 - F   8
               (  6.60%)   0.2569*Zr   1 s( 13.81%)p 2.52( 34.83%)d 3.72( 51.36%)
                                           0.0000  0.3716 -0.0008  0.0000 -0.2850
                                           0.1894  0.0000  0.4008 -0.2582  0.0000
                                          -0.0565  0.0260 -0.5310 -0.0754  0.1298
                                           0.0179 -0.2667 -0.0434 -0.2736 -0.0430
                                          -0.2411 -0.0317
               ( 93.40%)   0.9665* F   8 s( 49.83%)p 1.01( 50.16%)d 0.00(  0.01%)
                                           0.0000  0.7059 -0.0055  0.0001  0.3970
                                           0.0035 -0.0003 -0.5771 -0.0055  0.0004
                                           0.1042  0.0012 -0.0001 -0.0062  0.0013
                                          -0.0018 -0.0026 -0.0032
The bonds to the equatorial fluorine atoms exhibit contributions from the zirconium atoms as a 1:2.7:3.7 s:p:d ratio on average. The axial bonds (fluorine 6 and 7) sees less contribution from the d-orbitals of zirconium with a 1:3:2.3 s:p:d ratio, this is mainly due to the symmetry of the d-orbitals as only the dz2, dyz and dxz orbitals may bond to the axial fluorines, whereas all five d-orbitals exhibit bonding to the equatorial fluorines. The hybridisation overall may be approximated as sp3d3. The equatorial fluorine atoms have 1:1 contribution from the s and p-orbitals for bonding - thus suggesting they are sp hybridised. Where as the axial fluorines have less contribution from the p-orbitals with a 1:0.7 ratio.
The Second Order Perturbation Theory Analysis of Fock Matrix shows that mixing is insignificant as the E(2) values are small.
Monocapped trigonal prismatic [ZrF7]3-
An extract from the bond orbital analysis of the seven Zr-F bonds is shown below.
      (Occupancy)   Bond orbital/ Coefficients/ Hybrids
---------------------------------------------------------------------------------
    1. (1.99368) BD ( 1)Zr   1 - F   2
               (  6.46%)   0.2542*Zr   1 s( 14.20%)p 2.68( 37.99%)d 3.37( 47.81%)
                                           0.0000  0.3768  0.0004  0.0000  0.1769
                                          -0.1030  0.0001  0.4570 -0.2830  0.0000
                                           0.1913 -0.1115  0.4104  0.0568  0.2579
                                           0.0411  0.3819  0.0456 -0.2838 -0.0344
                                          -0.0924 -0.0089
               ( 93.54%)   0.9672* F   2 s( 49.84%)p 1.01( 50.16%)d 0.00(  0.01%)
                                           0.0000  0.7059 -0.0054  0.0001 -0.2279
                                          -0.0025  0.0002 -0.5946 -0.0054  0.0005
                                          -0.3099 -0.0029  0.0003  0.0039  0.0018
                                           0.0048 -0.0037 -0.0014
    2. (1.99652) BD ( 1)Zr   1 - F   3
               (  6.74%)   0.2596*Zr   1 s( 13.95%)p 2.26( 31.50%)d 3.91( 54.55%)
                                           0.0000  0.3736 -0.0007  0.0000 -0.3544
                                           0.2308  0.0000  0.3113 -0.1882  0.0000
                                          -0.0547  0.0275 -0.6072 -0.0927  0.1512
                                           0.0237 -0.1941 -0.0334 -0.0847 -0.0189
                                          -0.3101 -0.0476
               ( 93.26%)   0.9657* F   3 s( 47.03%)p 1.13( 52.96%)d 0.00(  0.01%)
                                           0.0000  0.6858 -0.0053  0.0001  0.5293
                                           0.0047 -0.0004 -0.4895 -0.0048  0.0004
                                           0.0991  0.0011 -0.0001 -0.0065  0.0014
                                          -0.0013  0.0002 -0.0033
    3. (1.99698) BD ( 1)Zr   1 - F   4
               (  6.78%)   0.2604*Zr   1 s( 13.71%)p 2.27( 31.06%)d 4.03( 55.23%)
                                           0.0000  0.3702 -0.0020  0.0000 -0.4252
                                           0.2724  0.0000 -0.1982  0.1176  0.0000
                                           0.0446 -0.0208  0.5426  0.0885 -0.1813
                                          -0.0308 -0.1185 -0.0214  0.3019  0.0440
                                          -0.3257 -0.0517
               ( 93.22%)   0.9655* F   4 s( 46.69%)p 1.14( 53.31%)d 0.00(  0.01%)
                                           0.0000  0.6833 -0.0053  0.0001  0.6530
                                           0.0060 -0.0005  0.3168  0.0032 -0.0002
                                          -0.0792 -0.0009  0.0001  0.0053 -0.0014
                                          -0.0007  0.0039 -0.0034
    4. (1.99174) BD ( 1)Zr   1 - F   5
               (  6.23%)   0.2496*Zr   1 s( 15.20%)p 2.77( 42.07%)d 2.81( 42.73%)
                                           0.0000  0.3899  0.0021  0.0000  0.0021
                                           0.0077  0.0000 -0.2280  0.1335  0.0001
                                           0.5185 -0.2863 -0.0791 -0.0109  0.1828
                                           0.0296 -0.3269 -0.0315 -0.0824 -0.0096
                                           0.5188  0.0525
               ( 93.77%)   0.9684* F   5 s( 53.09%)p 0.88( 46.90%)d 0.00(  0.01%)
                                           0.0000  0.7286 -0.0056  0.0000 -0.0093
                                          -0.0005  0.0000  0.2348  0.0022 -0.0003
                                          -0.6432 -0.0060  0.0007 -0.0004  0.0005
                                          -0.0042 -0.0009  0.0063
    5. (1.99387) BD ( 1)Zr   1 - F   6
               (  6.48%)   0.2545*Zr   1 s( 14.45%)p 2.56( 37.05%)d 3.36( 48.50%)
                                           0.0000  0.3802  0.0007  0.0000  0.0189
                                          -0.0032 -0.0001 -0.4798  0.2953  0.0000
                                          -0.1988  0.1146 -0.1807 -0.0289 -0.1319
                                          -0.0254  0.4722  0.0615 -0.4467 -0.0578
                                          -0.0612 -0.0048
               ( 93.52%)   0.9671* F   6 s( 49.68%)p 1.01( 50.32%)d 0.00(  0.01%)
                                           0.0000  0.7048 -0.0054  0.0001 -0.0355
                                          -0.0008  0.0000  0.6303  0.0058 -0.0006
                                           0.3233  0.0030 -0.0003 -0.0010 -0.0003
                                           0.0053 -0.0052 -0.0012
    6. (1.99167) BD ( 1)Zr   1 - F   7
               (  6.22%)   0.2495*Zr   1 s( 14.92%)p 2.86( 42.64%)d 2.85( 42.45%)
                                           0.0000  0.3862  0.0015  0.0000  0.1186
                                          -0.0622  0.0000  0.2220 -0.1306 -0.0001
                                          -0.5115  0.2837  0.1314  0.0157 -0.3307
                                          -0.0434 -0.2902 -0.0260 -0.0175 -0.0015
                                           0.4568  0.0440
               ( 93.78%)   0.9684* F   7 s( 53.14%)p 0.88( 46.85%)d 0.00(  0.01%)
                                           0.0000  0.7290 -0.0056  0.0000 -0.1217
                                          -0.0016  0.0001 -0.2257 -0.0021  0.0003
                                           0.6346  0.0058 -0.0007  0.0011 -0.0025
                                          -0.0040 -0.0004  0.0060
    7. (1.99440) BD ( 1)Zr   1 - F   8
               (  6.57%)   0.2564*Zr   1 s( 13.46%)p 2.76( 37.10%)d 3.67( 49.44%)
                                           0.0000  0.3669 -0.0003  0.0001  0.5048
                                          -0.3246  0.0000 -0.0865  0.0561  0.0000
                                           0.0122 -0.0075 -0.2092 -0.0303  0.0438
                                           0.0069  0.0479  0.0118  0.6082  0.0891
                                          -0.2581 -0.0291
               ( 93.43%)   0.9666* F   8 s( 48.22%)p 1.07( 51.77%)d 0.00(  0.01%)
                                           0.0000  0.6944 -0.0053  0.0001 -0.7074
                                          -0.0065  0.0006  0.1295  0.0011 -0.0001
                                          -0.0229 -0.0002  0.0000 -0.0023  0.0004
                                          -0.0002  0.0061 -0.0037
The orbitals contributions from the zirconium to fluorines 3 and 4 has a ratio of 1:2.3:4.0 s:p:d; to fluorines 2 and 6 it is 1:2.8:3.4; and to fluorines 5 and 7 it is 1:2.8:2.8. The orbitals contribution to the 'cap' fluorine (8) is 1:2.8:2.9. Compared to the orbital contributions in the pentagonal bipyramidal isomer, the ratios are much more varied, however the hybridisation may still be regarded as sp3d3.
The orbital contributions from the fluorine were again approximately 1:1 s:p.
The Second Order Perturbation Theory Analysis of Fock Matrix again showed insignificant mixing of the orbitals.
Conclusions
As exhibited for BH3, TlBr3 and the molybdenum complexes the ab initio quantum chemistry methods are sufficient for calculating physical properties as well as spectra that corresponded well with data reported in literature. It may be used to compare the relative stabilities of two inorganic isomers, and therefore could prove useful in predicting reaction outcomes. The method was also used to calculate and visualise the molecular orbitals of the inorganic molecules which may give some insight into the reactivities of different molecules.
For more complex compounds such as [ZrF7]3- where it usually exists as a solid with a counterion, the method starts to break down. This is mainly due to the fact that the calculations are for a single molecule in the gaseous phase - therefore the stabilising effects of the counterion are not taken into account, producing deviations from the geometries reported in literature. Including the counter-ions in this study would have been highly time consuming. Despite this the models gave some insight into the relative energies of the two isomers and the bonding within the cluster.
References and Citations
- ↑ M. S. Schuurman, W. D. Allen and H. F. Schaeffer III, J. Comput. Chem., 2005, 26 DOI:10.1002/jcc.20238
- ↑ A. Kaldor and R. F. Porter, J. Am. Chem. Soc., 1971, 93, 2140-2145DOI:10.1021/ja00738a008
- ↑ DOI:10042/to-13190
- ↑ A. Kaldor and R. F. Porter, J. Am. Chem. Soc., 1971, 93, 2140-2145DOI:10.1021/ja00738a008
- ↑ DOI:10042/to-12927
- ↑ DOI:10042/to-12926
- ↑ DOI:10042/to-12928
- ↑ DOI:10042/to-12929
- ↑ DOI:10042/to-12930
- ↑ DOI:10042/to-12931
- ↑ F. A. Cotton, D. J. Darensbourg, S. Klein and B. W. S. Kolthammer, Inorg. Chem., 1982, 21, 294-299 DOI:10.1021/ic00131a055
- ↑ D. W. Bennett, T. A. Siddiquee, D. T. Haworth, S. E. Kabir and F. K. Camellia, J. Chem. Cryst., 2004, 34, 353-359 DOI:10.1023/B:JOCC.0000028667.12964.28
- ↑ 13.0 13.1 R. J. Wehmschulte, M. A. Khan, and S. I. Hossain, Inorg. Chem., 2001, 40, 2756-2762 DOI:10.1021/ic0014538
- ↑ DOI:10042/to-12933
- ↑ DOI:10042/to-12932
- ↑ E. C. Alyea and S. Song, Inorg. Chem., 1995, 34, 2864-3873DOI:10.1021/ic00119a006
- ↑ M. Ardon, G. Hogartha and D. T. W. Oscrofta, J. Organ. Chem., 2004, 689, 2429-2435DOI:10.1016/j.jorganchem.2004.04.030
- ↑ K. E. Mooney and A. A. Bengali, J. Chem. Edu., 2003, 80, 1044 DOI:10.1021/ed080p1044
- ↑ A. Allen, P. F. Barrett, Can. J. Chem., 1968, 46, 1649-1653 DOI:10.1139/v68-276
- ↑ N. M. Xiang, et. al, Universiti Teknologi Malaysia, Identification of Stereochemical Isomers by Infrared Spectroscopy, 2010, pp 15 DOI:10.1139/v68-276
- ↑ 21.0 21.1 21.2 C. E. Housecroft and A. G. Sharpe, in Inorganic Chemistry, Pearson Education Ltd., 3rd edn, 2008
- ↑ A. V. Voit, E. I. Voit, and V. I. Sergienko, J. Structr. Chem., 1999, 40
- ↑ DOI:10042/to-13093
- ↑ DOI:10042/to-13094
- ↑ DOI:10042/to-13090
- ↑ DOI:10042/to-13092
- ↑ 27.0 27.1 A. Rahten, I. Leban, S. Milićev and B. Žemva, J. Crystallogr. Spectrosc. Res., 1990, 20, 9-15 DOI:10.1007/BF01181669
- ↑ DOI:10042/to-13095
- ↑ 29.0 29.1 A. Beuter, W. Kuhlmann and W. Sawodny, J. Fluorine Chem., 1975, 6, 367 DOI:10.1016/S0022-1139(00)85313-0


