Rep:Mod:EM23416
EX3
Molecules
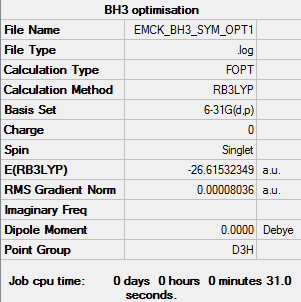
BH3
RB3LYP/6-31G(d,p) level
 Item               Value     Threshold  Converged?
 Maximum Force            0.000161     0.000450     YES
 RMS     Force            0.000105     0.000300     YES
 Maximum Displacement     0.000638     0.001800     YES
 RMS     Displacement     0.000417     0.001200     YES
Frequency analysis log file EMCK_BH3_FREQ1.log
 Low frequencies ---   -0.1187   -0.0049   -0.0009   42.2482   42.2484   43.3387
 Low frequencies --- 1163.5889 1213.5519 1213.5521
optimised BH3 molecule |
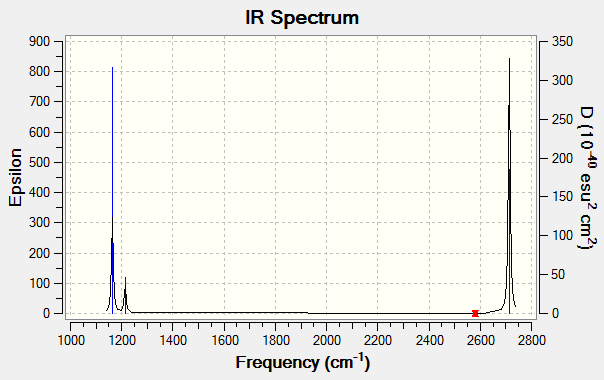
Vibrational Spectrum for BH3
| wavenumber (cm-1) | Intensity (arbitrary units) | symmetry | IR active? | type |
| 1164 | 93 | A2 | yes | out-of-plane bend |
| 1214 | 14 | E | very slight | in-plane bend |
| 1214 | 14 | E | very slight | in-plane bend |
| 2580 | 0 | A1 | no | symmetric stretch |
| 2713 | 126 | E | yes | asymmetric stretch |
| 2713 | 126 | E | yes | asymmetric stretch |
Although there are 6 vibrations for this molecule, as predicted by the 3N-6 rule (N=4), the vibrational spectrum for BH3 only shows 3 peaks. This is due to the two degenerate vibrations at both 1214 and at 2713 cm-1, which thus show only one peak at each frequency. The vibration at 2580 cm-1 is not IR active, and so doesn't show a peak on the spectrum.
Reference: Molecular Orbitals in Inorganic Chemistry, P. Hunt, Imperial College London, URL: http://www.huntresearchgroup.org.uk/teaching/year2_mos.html, [date accessed: 11/05/18]
Answer these questions: Are there any significant differences between the real and LCAO MOs? What does this say about the accuracy and usefulness of qualitative MO theory?
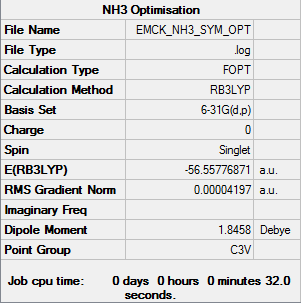
NH3
B3LYP/6-31G(d,p) level
 Item               Value     Threshold  Converged?
 Maximum Force            0.000059     0.000450     YES
 RMS     Force            0.000040     0.000300     YES
 Maximum Displacement     0.000174     0.001800     YES
 RMS     Displacement     0.000082     0.001200     YES
Frequency analysis log file EMCK_NH3_FREQ.log
 Low frequencies ---  -30.2465  -30.2464  -27.9012   -0.0012    0.0012    0.0033
 Low frequencies --- 1088.3845 1693.7755 1693.7755
optimised NH3 molecule |
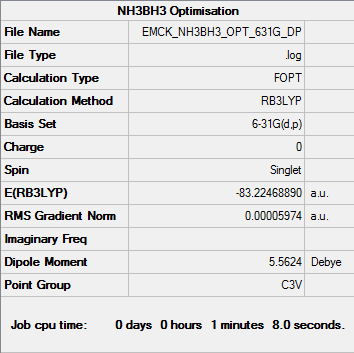
NH3BH3
B3LYP/6-31G(d,p) level
 Item               Value     Threshold  Converged?
 Maximum Force            0.000272     0.000450     YES
 RMS     Force            0.000060     0.000300     YES
 Maximum Displacement     0.001497     0.001800     YES
 RMS     Displacement     0.000379     0.001200     YES
Frequency analysis log file EMCK_NH3BH3_FREQ.log
 Low frequencies ---  -12.2521   -0.0251   -0.0056    0.0213    9.9744   10.0237
 Low frequencies ---  262.7785  631.1507  638.0575
optimised NH3BH3 molecule |
B-N Dative Bond Energy
Total energies, a.u. E(NH3)= -56.55776 E(BH3)=-26.61532 E(NH3BH3)= -83.22468
Calculation for association energy
ΔE= E(NH3BH3)-[E(NH3)+E(BH3)] = -83.22468-(-56.55776 + -26.61532) = -0.05159 a.u.
NB conversion factor: 1 a.u. = 2625.5 kJ/mol
B-N dative bond strength = -135.4671 kJ/mol
This bond is stronger than the B-H bond, but weaker than the B-C bond.
BBr3
B3LYP/6-31G(d,p)LANL2DZ level
File:Emck bbr3 opt summary.png
 Item               Value     Threshold  Converged?
 Maximum Force            0.000008     0.000450     YES
 RMS     Force            0.000005     0.000300     YES
 Maximum Displacement     0.000036     0.001800     YES
 RMS     Displacement     0.000024     0.001200     YES
Frequency analysis log file (via DSpace) DOI:10042/202393
 Low frequencies ---   -2.3055   -0.0029   -0.0018    0.0774    0.7534    0.7534
 Low frequencies ---  155.9402  155.9405  267.6894
optimised BBr3 molecule |
Project Section: Aromaticity
Molecules
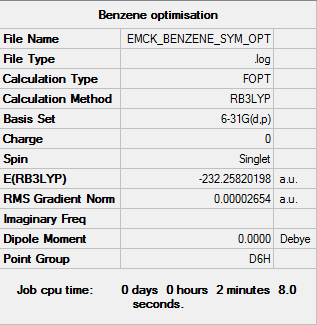
Benzene
B3LYP/6-31G(d,p) level
 Item               Value     Threshold  Converged?
 Maximum Force            0.000045     0.000450     YES
 RMS     Force            0.000016     0.000300     YES
 Maximum Displacement     0.000097     0.001800     YES
 RMS     Displacement     0.000036     0.001200     YES
Frequency analysis log file EMCK_BENZENE_FREQ.log
 Low frequencies ---  -11.2122   -7.2552   -7.2552   -0.0055   -0.0054    0.0002
 Low frequencies ---  414.4981  414.4981  621.0619
optimised benzene molecule |
Borazine
B3LYP/6-31G(d,p) level
NOTE TO MARKER: My log file for borazine has been uploaded before the deadline, but the link is as follows : File:EMCK BORAZINE FREQ.LOG
 Item               Value     Threshold  Converged?
 Maximum Force            0.000028     0.000450     YES
 RMS     Force            0.000011     0.000300     YES
 Maximum Displacement     0.000105     0.001800     YES
 RMS     Displacement     0.000037     0.001200     YES
 Low frequencies ---   -5.3732   -5.3575   -5.1081   -0.0036    0.0013    0.0113
 Low frequencies ---  289.6801  289.6807  404.4817
optimised borazine molecule |
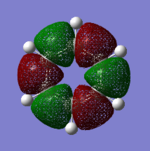
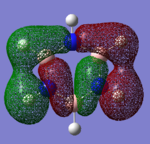
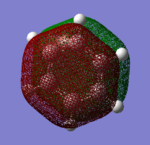
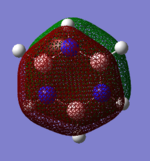
Molecular Orbitals
Smf115 (talk) 00:25, 23 May 2018 (BST)Good attempt at comparing the MOs. However, energies are not comparable between the MOs and it was the shape of the orbitals which needed to be considered when selecting two to compare. MO 14 from benzene is instead comparable to MO 15 from borazine which should have been noticed. The comparison for the remaining MOs could be improved with inclusion of details such as pi- or sigma-orbitals/interactions and to the symmetries.
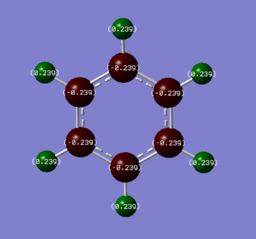
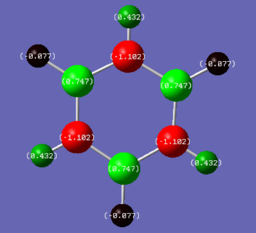
Charge Distributions
Smf115 (talk) 00:27, 23 May 2018 (BST)Good charge analysis with a clear explaination due to electronegativies and the same colour range has been used for the charge distribution across both molecules.
Aromaticity
discuss in your wiki (2-3 paragraphs) the concept of aromaticity, the simple ideas and also the more complex descriptions.
   how do the real MOs relate to the common (very basic) conceptions of aromaticity?
   you are expected to explain why the concept of overlapping pz AOs is NOT a good description for aromaticity.
Smf115 (talk) 00:30, 23 May 2018 (BST)Overall, a good attempt in places but a disapointing, unfinished project section and broken log file links throughout the report. Where the questions have been given time and thought, such as the charge analysis, then the answers are good.

