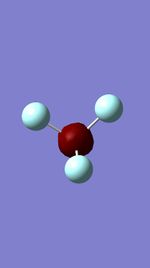
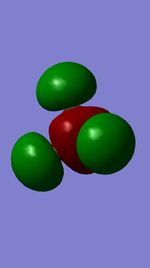
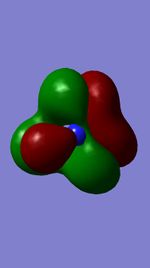
Rep:Mod:ED2618
NH3 Molecule
Results Summary
Molecule: NH3
Calculation Method: RB3LYP
Basis Set: 6-31G(d.p)
Final Energy E(RB3LYP): -56.57603584 a.u.
RMS Gradient: 0.00000431
Point Group: C3V
N-H Bond Length: 1.01579 +/- 0.01Å
H-N-H Bond Angle: 106 +/- ≈ 1°
Item Table:
         Item               Value     Threshold  Converged?
 Maximum Force            0.000005     0.000450     YES
 RMS     Force            0.000003     0.000300     YES
 Maximum Displacement     0.000075     0.001800     YES
 RMS     Displacement     0.000037     0.001200     YES
Jmol Dynamic Image of NH3
NH Optimised Molecule |
The optimisation file is linked to here
Vibrations
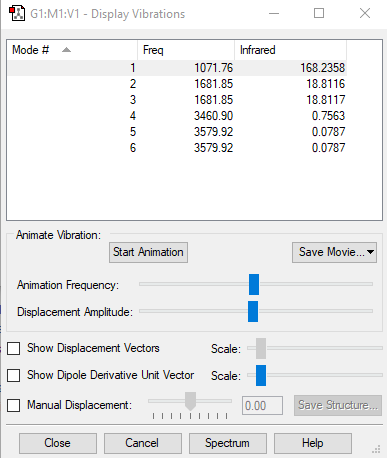
Below shows an image displaying the vibrations for the NH3 molecule from the Gaussian software:
Below shows a table of data taken from the log book for the optimised NH3 molecule:
| Vibration | Wavenumber (cm-1) | Symmetry | Intensity of Vibrations (KM/Mole) | Image |
|---|---|---|---|---|
| 1 | 1071.76 | A1 | 168.24 | 
|
| 2 | 1681.85 | E | 18.81 | 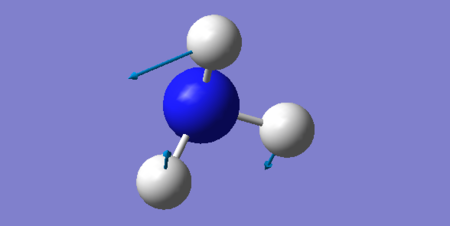
|
| 3 | 1681.85 | E | 18.81 | 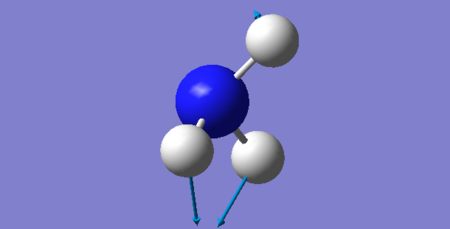
|
| 4 | 3460.90 | A1 | 0.76 | 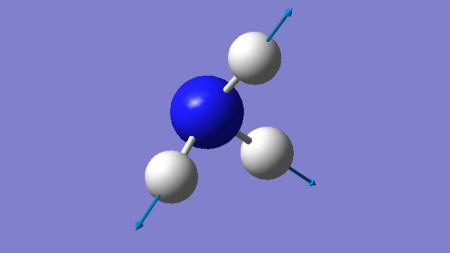
|
| 5 | 3579.92 | E | 0.079 | 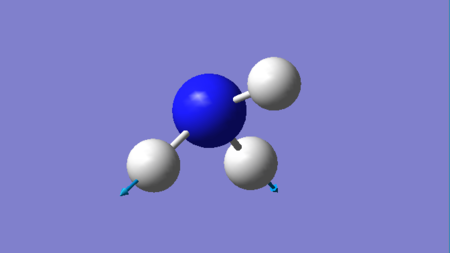
|
| 6 | 3579.92 | E | 0.079 | 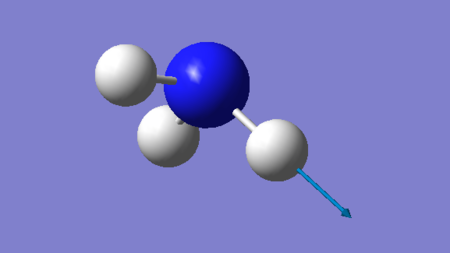
|
Questions
1. How many modes do you expect from the 3N-6 rule?
Answer: We would expect 3(4)-6 = 6 nodes.
2. Which modes are degenerate (i.e. have the same energy)?
Answer: There are two sets of degenerate modes with wavenumbers of 1681.85cm-1 and 3579.92-1.
3. Which modes are "bending" vibrations and which are "bond stretch" vibrations?
Answer: Bending = 1071.76 cm-1, 1681.85 cm-1 (both) Bond Stretch = 3460.90 cm-1, 3579.92 cm-1 (both).
4. Which mode is highly symmetric?
Answer: Both A1 modes are highly symmetric. These have the wavenumbers 1071.76 cm-1 and 3460.90.
5. One mode is known as the "umbrella" mode, which one is this?"
Answer: The mode with the wavenumber of 1071.76 is known as the "umbrella" mode.
6. How many bands would you expect to see in an experimental spectrum of gaseous ammonia?
Answer: We would expect to see 2 bands in an experimental spectrum of gaseous ammonia as although we have 6 vibrations, we only have three distinct wavenumbers and two of these wavenumbers have a negligible intensity. The size of the peaks is proportional to the relative intensities of the vibrations. An image of the IR spectrum is shown below:
Charge Analysis
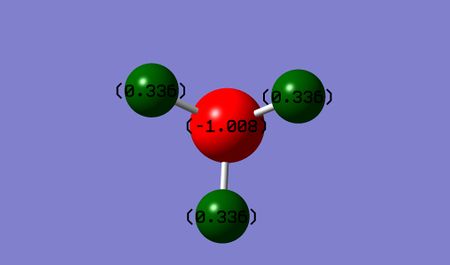
Below shows an image of the charge distribution of the NH3 molecule:
Charge of N-atom: = -1.008 D Charge of H-atoms: = 0.336 D
As nitrogen is more electronegative than Hydrogen we would expect the electron density to be focused on it. This is true from the negative charge seen above.
N2 Molecule
Results Summary
Molecule: N2
Calculation Method: RB3LYP
Basis Set: 6-31G(d.p)
Final Energy E(RB3LYP): -109.52412868 a.u.
RMS Gradient: 0.00000060
Point Group: D*H (D Infinity H)
N-N Bond Length: 1.11 +/- 0.01Å
Item Table:
         Item               Value     Threshold  Converged?
 Maximum Force            0.000001     0.000450     YES
 RMS     Force            0.000001     0.000300     YES
 Maximum Displacement     0.000000     0.001800     YES
 RMS     Displacement     0.000000     0.001200     YES
Jmol Dynamic Image of N2
N2 Optimised Molecule |
The optimisation file is linked to here
Vibrations
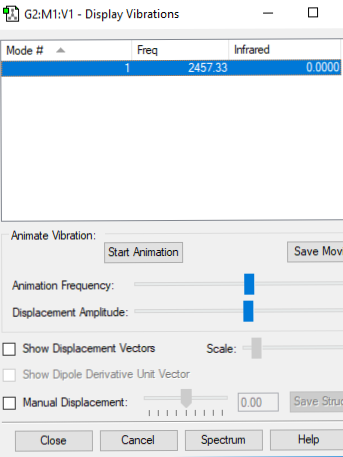
Below shows an image displaying the vibrations for the N2 molecule from the Gaussian software:
Below shows a table of data taken from the log book for the optimised N2 molecule:
| Vibration | Wavenumber (cm-1) | Symmetry | Intensity of Vibrations (KM/Mole) | Image |
|---|---|---|---|---|
| 1 | 2457.33 | SGG | 0.00 | 
|
Questions
1. How many modes do you expect from the 3N-5 rule?
Answer: As we have a linear molecule we use the 3N-5 rule. Thus we would expect 3(2)-5 = 1 mode. To be IR active a molecule must have a change in dipole moment. As N2 is homo-nuclear and linear it does not have a change in dipole moment and thus no peaks would show on its IR spectrum.
Charge Analysis
Below shows an image showing the charge distribution for the N2 molecule. The colour and charge labels are both in black and thus it is not visible to see the labels.
Charge of N Atoms = 0.00 D
N2 is a homo-nuclear, linear molecule and thus has an equal charge distribution with no change in dipole moment.
Mono-Metallic TM Complex Coordinating N2
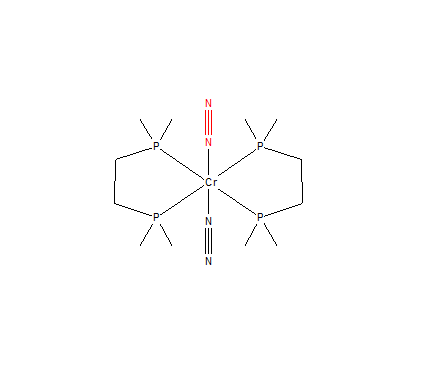
Below shows the structure of a mono-metallic transition metal complex that coordinates N2:
This structure is called trans-bis(1,2-bis(Dimethylphosphino)ethane)-bis(dinitrogen)-chromium(0) and has the unique identifier CAMVOB10.
The file to this structure is linked to [1]
The original N-N bond distance obtained from Gaussian (as reported above) is 1.10550 +/- 0.01Å
The N-N bond distance obtained from Avogadro for this structure is 1.122 Å.
Comparison of bond distances: The computationally calculated bond distance (1.10550 Å) was found to be shorter than the experimentally calculated bond distance (1.122 Å). Experimentally, the N2 is bonded to Chromium. This transition metal pulls the electron density away from the N≡N bond. This causes a reduction in the bond strength and thus causes the bond to lengthen. Computational manipulation and calculation of bond lengths also plays an important role in the difference of the two lengths. Computational methods use the molecule in the gas phase whereas experimentally the molecule is in the solid state. Computational molecular optimisation methods also change the bond length distances, causing a variation between computationally calculated distances and between experimentally calculated distances.
Comparison to literature: The journal article that this molecule was reported in, the N(2)-N(1)-Cr bond angle was found to be 178.2o. From using Avogadro to analyse this TM complex, the N(2)-N(1)-Cr bond angle was found to also be 178.2o.[1]
H2 Molecule
Results Summary
Molecule: H2
Calculation Method: RB3LYP
Basis Set: 6-31G(d.p)
Final Energy E(RB3LYP): -1.17853936 au
RMS Gradient: 0.00000017
Point Group: D*H (D infinity H)
H-H Bond Length: 0.74 +/- 0.01Å
Item Table:
      Item               Value     Threshold  Converged?
 Maximum Force            0.000000     0.000450     YES
 RMS     Force            0.000000     0.000300     YES
 Maximum Displacement     0.000000     0.001800     YES
 RMS     Displacement     0.000001     0.001200     YES
Jmol Dynamic Image of H2
H2 Optimised Molecule |
The optimisation file is linked to here
Vibrations
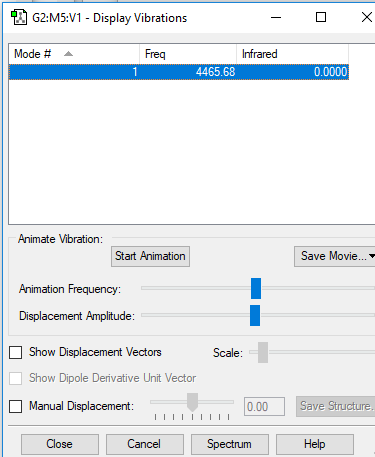
Below shows an image displaying the vibrations for the H2 molecule from the Gaussian software:
Below shows a table of data taken from the log book for the optimised H2 molecule:
| Vibration | Wavenumber (cm-1) | Symmetry | Intensity of Vibrations (KM/Mole) | Image |
|---|---|---|---|---|
| 1 | 4465.68 | SGG | 0.00 | 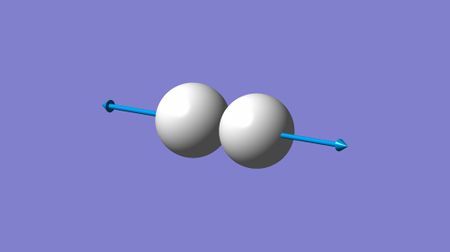
|
Questions
1. How many modes do you expect from the 3N-5 rule?
Answer: As we have a linear molecule we use the 3N-5 rule. Thus we would expect 3(2)-5 = 1 mode. To be IR active a molecule must have a change in dipole moment. As N2 is homo-nuclear and linear it does not have a change in dipole moment and thus no peaks would show on its IR spectrum.
Charge Analysis
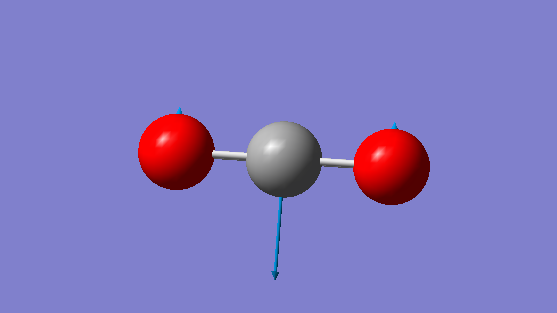
Below shows an image showing the charge distribution for the H2 molecule. The colour and charge labels are both in black and thus it is not visible to see the labels.
Charge of H Atoms on H2 molecule= 0.00 D
Haber-Bosch Process
The Haber-Bosch process is given by the formula: N2 + 3H2 → 2NH3
Using the following data the energy change of this reaction can be determined:
E(NH3) = -56.57603584 a.u.
2*E(NH3) = -113.1520717 a.u.
E(N2) = -109.52412868 a.u.
E(H2) = -1.17853936 a.u.
3*E(H2) = -3.53561808 a.u.
ΔE=2*E(NH3)-[E(N2)+3*E(H2)]= -0.09232494 a.u.
1 a.u. = 2625.5 kJ/mol
-0.09232494 a.u. = -242.4 kJ/mol
The energy change for this reaction is negative, thus the reaction is exothermic and this indicates that ammonia is more stable.
Mono-Metallic TM Complex Coordinating H2
Below shows the structure of a mono-metallic transition metal complex that coordinates H2:
This structure is called (σ2-Dihydrogen)-tricarbonyl-bis(tri-isopropylphosphine)-tungsten and has the unique identifier CEJDEA.
The file to this structure is linked to [2]
The original H-H bond distance obtained from Gaussian (as reported above) is 0.74 +/- 0.01Å
The H-H bond distance obtained from Avogadro for this structure is 0.755 Å.
Comparison of bond distances: These bond distances are fairly similar although are not the same. This is due to the difference in experimental and computational methods to calculate bond distances as discussed above for N2.
NF3 Molecule (Own Choice)
Results Summary
Molecule: NF3
Calculation Method: RB3LYP
Basis Set: 6-31G(d.p)
Final Energy E(RB3LYP): -354.07131058
RMS Gradient: 0.00010256
Point Group: C3V
N-F Bond Length: 1.38 +/- 0.01Å
F-N-F Bond Angle: 102 +/- ≈ 1°
Item Table:
         Item               Value     Threshold  Converged?
 Maximum Force            0.000164     0.000450     YES
 RMS     Force            0.000108     0.000300     YES
 Maximum Displacement     0.000612     0.001800     YES
 RMS     Displacement     0.000296     0.001200     YES
Jmol Dynamic Image of NF3
NH Optimised Molecule |
The optimisation file is linked to here
Vibrations
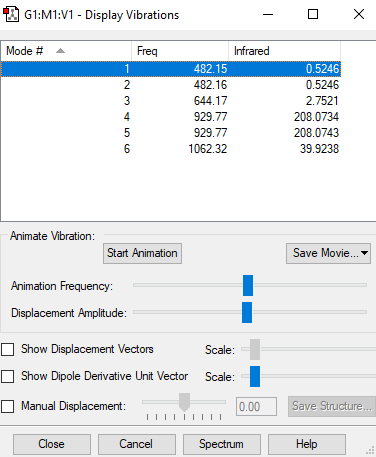
Below shows an image displaying the vibrations for the NF3 molecule from the Gaussian software:
Below shows a table of data taken from the log book for the optimised NH3 molecule:
| Vibration | Wavenumber (cm-1) | Symmetry | Intensity of Vibrations (KM/Mole) | Image |
|---|---|---|---|---|
| 1 | 482.15 | E | 0.52 | 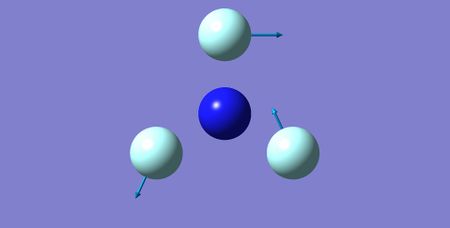
|
| 2 | 482.16 | E | 0.52 | 
|
| 3 | 644.17 | A1 | 2.75 | 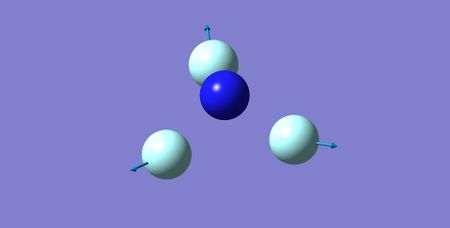
|
| 4 | 929.77 | E | 208.07 | 
|
| 5 | 929.77 | E | 208.07 | 
|
| 6 | 1062.32 | A1 | 39.92 | 
|
Charge Analysis
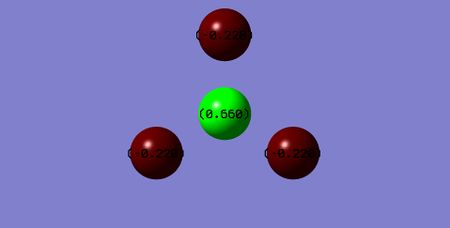
Below shows an image of the charge distribution of the NF3 molecule:
Charge of N-atom: = 0.660 Charge of F-atoms: = -0.220
Molecular Orbitals
Independence
In this wiki page I have included both TM complexes for N2 and H22 and have compared data to literature values for N2.
References
- ↑ J. Chem. Soc., Dalton Trans., 1985,0, 685-692 .
Marking
Note: All grades and comments are provisional and subject to change until your grades are officially returned via blackboard. Please do not contact anyone about anything to do with the marking of this lab until you have received your grade from blackboard.
Wiki structure and presentation 1/1
Is your wiki page clear and easy to follow, with consistent formatting?
YES
Do you effectively use tables, figures and subheadings to communicate your work?
YES
NH3 1/1
Have you completed the calculation and given a link to the file?
YES
Have you included summary and item tables in your wiki?
YES
Have you included a 3d jmol file or an image of the finished structure?
YES
Have you included the bond lengths and angles asked for?
YES
Have you included the “display vibrations” table?
YES
Have you added a table to your wiki listing the wavenumber and intensity of each vibration?
YES
Did you do the optional extra of adding images of the vibrations?
YES
Have you included answers to the questions about vibrations and charges in the lab script?
YES - excellent explanations and formatting, well done.
N2 and H2 0.5/0.5
Have you completed the calculations and included all relevant information? (summary, item table, structural information, jmol image, vibrations and charges)
YES
Crystal structure comparison 0.5/0.5
Have you included a link to a structure from the CCDC that includes a coordinated N2 or H2 molecule?
YES
Have you compared your optimised bond distance to the crystal structure bond distance?
YES
Haber-Bosch reaction energy calculation 0/1
Have you correctly calculated the energies asked for? ΔE=2*E(NH3)-[E(N2)+3*E(H2)]
No, the answer is around -147 kJ/mol for a single mole of NH3 or double that if you use the equation for 2 moles. Your answer is wrong because you used the basis set 6-311G(d,p) on your NH3 calculation instead of 6-31G(d,p).
Have you reported your answers to the correct number of decimal places?
YES
Do your energies have the correct +/- sign?
YES
Have you answered the question, Identify which is more stable the gaseous reactants or the ammonia product?
YES
Your choice of small molecule 4/5
Have you completed the calculation and included all relevant information?
YES
Have you added information about MOs and charges on atoms?
YES - you could have explained the charges in terms of relative electronegativities of the elements however.
Independence 1/1
If you have finished everything else and have spare time in the lab you could: Check one of your results against the literature, or
YES
Do an extra calculation on another small molecule, or Do some deeper analysis on your results so far

