Rep:Mod:ECN0511
Name: Estella Chin Ning
CID: 00697238
Optimising a BH3 Molecule
3-21G Calculation
The results of the BH3 3-21G optimisation are summarised in Table 1 below.
| Link to log file of 3-21G Optimised BH3 Molecule | |
|---|---|
| File Type | .log |
| Calculation type | FOPT |
| Calculation method | RB3LYP |
| Basis set | 3-21G |
| Final energy | -26.46226429 a.u. |
| RMS gradient norm | 0.00008851 a.u. |
| Dipole moment | 0.00 D |
| Point group | CS |
| Time taken for calculation | 18.0 seconds |
The expected point group symmetry of D3h is not attained in the optimisation calculation above. This is because higher accuracy calculations are required to attain the correct point group symmetry of the BH3 molecule. In addition, the gradient is less than 0.0001 (expected gradient = 0 for a stationary point), indicating that the molecule has indeed been optimised.
  Item               Value     Threshold  Converged?
 Maximum Force            0.000220     0.000450     YES
 RMS     Force            0.000106     0.000300     YES
 Maximum Displacement     0.000940     0.001800     YES
 RMS     Displacement     0.000447     0.001200     YES
 Predicted change in Energy=-1.672479D-07
 Optimization completed.
    -- Stationary point found.
The table above shows that the forces have converged, meaning that for a small displacement, the energy does not change. This further confirms the successful optimisation of the molecule.
The total energy and RMS Gradient of each optimisation step is shown in Figure 1 and 2 respectively.
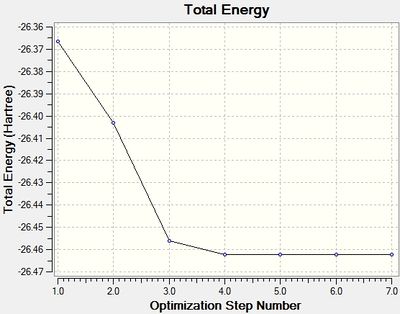
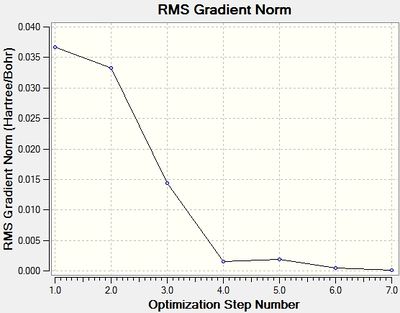
The last structure of the optimisation step has the most negative energy and the smallest gradient, suggesting that it is the energy minima structure.
6-31G (d,p) Calculation
The results of the 6-31G (d,p) optimisation are summarised in Table 2 below.
| Link to log file of 6-31G (d,p) Optimised BH3 Molecule | |
|---|---|
| File Type | .log |
| Calculation type | FOPT |
| Calculation method | RB3LYP |
| Basis set | 6-31G(d,p) |
| Final energy | -26.61532360 a.u. |
| RMS gradient norm | 0.00000009 a.u. |
| Dipole moment | 0.00 D |
| Point group | CS |
| Time taken for calculation | 11.0 seconds |
The expected point group symmetry of D3h is not attained in the optimisation calculation above. This is because higher accuracy calculations are required to attain the correct point group symmetry of the BH3 molecule. In addition, the gradient is less than 0.0001 (expected gradient = 0 for a stationary point), indicating that the molecule has indeed been optimised.
Item               Value     Threshold  Converged?
 Maximum Force            0.000000     0.000002     YES
 RMS     Force            0.000000     0.000001     YES
 Maximum Displacement     0.000001     0.000006     YES
 RMS     Displacement     0.000001     0.000004     YES
 Predicted change in Energy=-2.827323D-13
 Optimization completed.
    -- Stationary point found.
The table above shows that the forces have converged, meaning that for a small displacement, the energy does not change. This further confirms the successful optimisation of the molecule.
Optimised B-H Bond Distance:
1.19 Å
Literature B-H Bond Distance[1] : 1.19 Å
Optimised H-B-H Bond Angle:
120.0 °
There is good corroboration between the calculated B-H bond distance and that found in literature. In addition, the H-B-H bond angle is 120.0 ° as would be expected for a BH3 molecule which has the D3h point group, confirming the accuracy of the optimisation calculations.
Total energy for the 3-21G Optimised Structure: -26.46226429 a.u.
Total energy for the 6-31G (d,p) Optimised Structure: -26.61532360 a.u.
Note that the energies of the 3-21G and 6-31G (d,p) optimised structure cannot be compared as different basis sets were used.
Optimising a GaBr3 Molecule
LanL2DZ Calculation
The results of the LanL2DZ optimisation are summarised in Table 3 below.
| Link to log file of LanL2DZ Optimised GaBr3 Molecule | |
|---|---|
| Link to D-Space | |
| File Type | .log |
| Calculation type | FOPT |
| Calculation method | RB3LYP |
| Basis set | LANL2DZ |
| Final energy | -41.70082783 a.u. |
| RMS gradient norm | 0.00000016 a.u. |
| Dipole moment | 0.00 D |
| Point group | D3h |
| Time taken for calculation | 27.6 seconds |
The gradient is less than 0.0001 (expected gradient = 0 for a stationary point), indicating that the molecule has indeed been optimised.
 Item               Value     Threshold  Converged?
 Maximum Force            0.000000     0.000450     YES
 RMS     Force            0.000000     0.000300     YES
 Maximum Displacement     0.000003     0.001800     YES
 RMS     Displacement     0.000002     0.001200     YES
 Predicted change in Energy=-1.282690D-12
 Optimization completed.
    -- Stationary point found.
The table above shows that the forces have converged, meaning that for a small displacement, the energy does not change. This further confirms the successful optimisation of the molecule.
Optimised Ga-Br Bond Distance:
2.35 Å
Literature Ga-Br Bond Distance[2] :
2.3525 Å
Optimised Br-Ga-Br Bond Angle: 120.0 °
There is good corroboration between the calculated Ga-Br bond distance and that found in literature. In addition, the Br-Ga-Br bond angle is 120.0 ° as would be expected for a GaBr3 molecule which has the D3h point group, confirming the accuracy of the optimisation calculations.
Optimising a BBr3 Molecule
6-31G (d,p) and LanL2DZ Calculation
The results of the 6-31G (d,p) and LanL2DZ optimisation are summarised in Table 4 below.
| Link to log file of Optimised BBr3 Molecule | |
|---|---|
| Link to D-Space | |
| File Type | .log |
| Calculation type | FOPT |
| Calculation method | RB3LYP |
| Basis set | GEN (6-31G (d,p) and LanL2DZ) |
| Final energy | -64.43645388 a.u. |
| RMS gradient norm | 0.00000943 a.u. |
| Dipole moment | 0.00 D |
| Point group | CS |
| Time taken for calculation | 39.3 seconds |
The expected point group symmetry of D3h is not attained in the optimisation calculation above. This is because higher accuracy calculations are required to attain the correct point group symmetry of the BBr3 molecule. In addition, the gradient is less than 0.0001 (expected gradient = 0 for a stationary point), indicating that the molecule has indeed been optimised.
      Item               Value     Threshold  Converged?
 Maximum Force            0.000016     0.000450     YES
 RMS     Force            0.000010     0.000300     YES
 Maximum Displacement     0.000067     0.001800     YES
 RMS     Displacement     0.000040     0.001200     YES
 Predicted change in Energy=-1.574159D-09
 Optimization completed.
    -- Stationary point found.
The table above shows that the forces have converged, meaning that for a small displacement, the energy does not change. This further confirms the successful optimisation of the molecule.
Optimised B-Br Bond Distance: 1.93 Å
Literature B-Br Bond Distance [3]: 1.893 Å
There is good corroboration between the calculated B-Br bond distance and that found in literature. In addition, the Br-B-Br bond angle is 120.0 ° as would be expected for a BBr3 molecule which has the D3h point group, confirming the accuracy of the optimisation calculations.
Comparing the Bond Distances of BH3, BBr3 & GaBr3
The summary of the different bond distances between BH3, BBr3 & GaBr3 is shown in Table 5 below.
| Molecule | Bond Distance (Å) |
|---|---|
| BH3 | 1.19 |
| BBr3 | 1.93 |
| GaBr3 | 2.35 |
The bond distances increase in the order: B – H (1.19 Å) > B – Br (1.93 Å) > Ga – Br (2.35 Å).
Comparing the bond distances of B – H and B – Br where the central atom (B) is kept constant, when the ligand is changed from H to Br, the bond distance increases. Both H and Br have 1 unpaired electron; the electronic configuration of H is 1s1, while that of Br is [Ar] 4s23d104p5, which allows the formation of a covalent bond with B. However, this causes the B – H bond to have a larger s-character than the B – Br bond, where the unpaired electron from the Br is from the 4p orbital. In simpler terms, since the atomic size of the H ligand is smaller than that of the Br ligand, the Br atomic orbitals are more diffused, hence there is better orbital overlap between B and H as compared to B and Br, leading to the formation of stronger and shorter B – H bonds than B – Br bonds.
Similarly, by comparing the bond distances of B – Br and Ga – Br where the ligand (Br) is kept constant, when the central atom is changed from B to Ga, the bond distance increases. Both B and Ga belong to Group 13 of the periodic table and hence they have similar chemical bonding properties. However, B and Ga are found in Period 2 and 4 of the periodic table respectively, hence, B has a smaller atomic size and fewer atomic orbitals than Ga. This causes the B – Br bond to be shorter and stronger than the Ga – Br bond, as the Ga atomic orbitals are more diffused and hence the B – Br bond is formed closer to the central atom atomic nucleus than that of the Ga – Br bond.
A chemical bond can be defined as the attractive interactions between two atoms, which are normally attributed to electrostatic forces of attraction between the oppositely-charged induced dipoles of 2 atoms, or between 2 ions. In the optimisation process of the molecule, bonds are not observed between the central and ligand atoms in Gaussview. This does not indicate the absence of bonds between the atoms; it just shows that according to calculations, the atoms are too far apart as compared to a normal covalent bond length. In fact, since the atoms do not have the same electronegativities, one is bound to induce a dipole in the other, causing some form of interaction. The absence of the indicated bonds may just suggest that the atoms are too weakly bonded to be considered as sharing a covalent bond.
BH3 Frequency Analysis
Frequency Calculation
The results of the 6-31G (d,p) frequency calculations are summarised in Table 6 below.
| Link to log file of Frequency analysis of BH3 | |
|---|---|
| Link to D-Space | |
| File Type | .log |
| Calculation type | FOPT |
| Calculation method | RB3LYP |
| Basis set | 6-31G(d,p) |
| Final energy | -26.61532364 a.u. (Same (up to last 2 d.p.) as that recorded in optimisation step) |
| RMS gradient norm | 0.00000001 a.u. |
| Dipole moment | 0.00 D |
| Point group | D3h |
| Time taken for calculation | 5.0 seconds |
The gradient is less than 0.0001 (expected gradient = 0 for a stationary point), indicating that the molecule has indeed been optimised.
Item               Value     Threshold  Converged?
 Maximum Force            0.000000     0.000002     YES
 RMS     Force            0.000000     0.000001     YES
 Maximum Displacement     0.000000     0.000006     YES
 RMS     Displacement     0.000000     0.000004     YES
 Predicted change in Energy=-1.040964D-15
 Optimization completed.
    -- Stationary point found.
The table above shows that the forces have converged, meaning that for a small displacement, the energy does not change. This further confirms the successful optimisation of the molecule.
Low frequencies ---   -9.3484   -9.3330   -0.0724    0.0010    0.5365    2.5464
Low frequencies --- 1162.9903 1213.1496 1213.1498
The low frequencies are within the range of ± 15 cm-1 and close to 0, indicating that the method employed in the frequency calculations was sufficiently accurate.
Summary of BH3 Vibrations
The summary of BH3 vibrational modes can be found in Table 7 below.
Infrared (IR) Spectrum
The infrared spectrum of GaBr3 is illustrated in Figure 3 below.
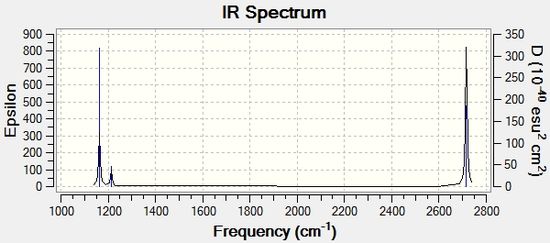
Although there are a total of 6 vibrational modes, only 3 corresponding peaks are present in the IR spectrum. This can be attributed to the fact that vibrational modes 2 and 3 vibrate at the same frequency (1213.15 cm-1) and vibrational modes 5 and 6 vibrate at the same frequency (2715.66 cm-1), giving rise to overlapping peaks in the infrared spectrum. Vibrational modes with the same frequency are called degenerate modes, as the vibrations are associated with the same energy. In addition, only vibrations that cause a change in the overall dipole moment of the molecule will give rise to peaks in the infrared spectrum. For the A1' totally symmetric mode, there is no change in overall dipole moment associated with the vibration and hence the intensity of the peak in the infrared spectrum is '0'. Thus, there are 3 infrared peaks in total.
GaBr3 Frequency Analysis
Frequency Calculation
The results of the GaBr3 LANL2DZ frequency analysis are summarised in Table 8 below.
| Link to log file of Frequency analysis of GaBr3 | |
|---|---|
| Link to D-space | |
| File Type | .log |
| Calculation type | FOPT |
| Calculation method | RB3LYP |
| Basis set | LANL2DZ |
| Final energy | -41.70082783 a.u. (Same (up to last 2 d.p.) as that recorded in optimisation step) |
| RMS gradient norm | 0.00000011 a.u. |
| Dipole moment | 0.00 D |
| Point group | D3h |
| Time taken for calculation | 21.9 seconds |
The gradient is less than 0.0001 (expected gradient = 0 for a stationary point) and close to 0, indicating that the molecule has indeed been optimised.
Item               Value     Threshold  Converged?
 Maximum Force            0.000000     0.000450     YES
 RMS     Force            0.000000     0.000300     YES
 Maximum Displacement     0.000002     0.001800     YES
 RMS     Displacement     0.000001     0.001200     YES
 Predicted change in Energy=-6.142862D-13
 Optimization completed.
    -- Stationary point found.
The table above shows that the forces have converged, meaning that for a small displacement, the energy does not change. This further confirms the successful optimisation of the molecule.
 Low frequencies ---   -0.5252   -0.5247   -0.0024   -0.0010    0.0235    1.2010
 Low frequencies ---   76.3744   76.3753   99.6982
The low frequencies are within the range of ± 15 cm-1, indicating that the method employed in the frequency calculations was sufficiently accurate.
The lowest "real" normal mode of GaBr3 is the E' mode at 76 cm-1.
Summary of Vibrations
The summary of GaBr3 vibrational modes can be found in Table 9 below.
Infrared (IR) Spectrum
The infrared spectrum of GaBr3 is illustrated in Figure 4 below.

Comparing Vibrational Frequencies
The comparison table between the vibrational frequencies of BH3 and GaBr3 is shown in Table 10 below.
As evident from the summary table, the frequency values for BH3 are much larger than that of GaBr3. As frequencies are directly proportional to the bond strength of the molecule, higher frequencies of BH3 suggests that the B – H bond is much stronger than the Ga – Br bond. This corresponds to the difference in the optimised calculated bond strength between B – Br and Ga –Br, as shown in Table 5 above.
There has been a reordering of modes between the A2” and 2 degenerate E’ modes. For BH3, the doubly degenerate E’ modes vibrate at higher frequency, while for GaBr3, the A2" mode vibrates at higher frequency.
Both the BH3 and GaBr3 infrared spectra have 3 peaks, despite having 6 vibrational modes. This is due to the presence of 2 degenerate (E’) vibrational modes and a totally symmetric A1’ vibrational mode which has an infrared peak at 0 intensity, reasons of which have been explained before.
For both spectra, the A2” and 2 degenerate E’ modes vibrate at similar lower frequencies, while the A1’ and the other 2 degenerate E’ modes vibrate at similar higher frequencies. This is because the A2” and the 2 degenerate E’ modes (No. 2 and 3 in the table above) are bending vibrational modes (wagging and scissoring respectively), which are relatively low energy vibrations and hence produce low frequencies. In contrast, the A1’ mode and the other 2 degenerate E’ modes (No. 5 and 6 in the table above) are high energy stretching modes, the former being a symmetrical stretching vibrational mode, while the latter 2 are asymmetrical stretching modes. Stretching vibrational modes are relatively higher in energy than the bending modes. Hence, the A1’ and E’ modes have higher energy frequencies as compared to the A2” and E’ modes.
The chosen method determines the type of approximations that are made in solving the Schrodinger equation, while the basis set determines the accuracy of the optimisation process. These provide the potential energy surface on which optimisation and frequency calculations are made on. Optimisation analysis calculations provide the stationary points of a potential energy surface of a particular molecule, that is, the Schrodinger equation is solved for the nuclear and electronic positions at different molecular coordinates to find the lowest energy configuration. Frequency analysis calculations provide the second derivative of that stationary point derived from the optimisation in the same potential energy surface. Hence, it is vital to use the same method and basis set since both the optimisation and frequency calculations are based on the same optimised potential energy surface; using a different set of method and basis sets will cause the frequency calculations to be inaccurate as it will now be based on a different potential energy surface.
A frequency analysis provides information whether the optimised stationary point is a minimum point, maximum point, or a point of inflection. Frequencies are the second derivatives of a stationary point; positive frequencies indicate a minimum stationary point, while negative frequencies indicate a maximum stationary point. Since we are looking for the lowest energy configuration, i.e. a minimum point, the frequencies should be positive.
The "Low frequencies" represent the translational and rotational degrees of freedom of a given molecule; they are the "-6" component in the "3n-6" calculations of vibrational degrees of freedom for a non-linear molecule, or the "-5" component in the "3n-5" calculations of vibrational degrees of freedom for a linear molecule, where "n" represents the number of atoms in the molecule.
Molecular Orbitals of BH3
The Molecular Orbital diagram of BH3 is shown in Figure 5 below, which shows the similarities between the real and expected LCAO MOs.
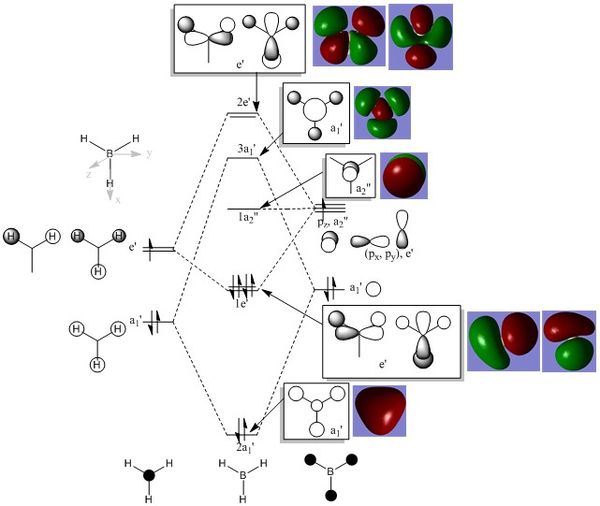
There are no significant differences between the real and expected LCAO MOs. As such, it can be inferred that qualitative MO theory is accurate in predicting the shapes, orientations and phases of actual molecular orbitals. This is especially useful as we now have a better picture of the electron density present in a given molecule.
N.B. The totally symmetric 1A1' molecular orbital was generated, although this is not seen in the MO diagram drawn which only depicts valence electrons.
NH3
Optimisation: 6-31G (d,p) Calculation
The results of the NH3 6-31G (d,p) Optimisation can be found in Table 11 below.
| Link to the log file of 6-31G(d,p) Optimised NH3 Molecule | |
|---|---|
| File Type | .log |
| Calculation type | FOPT |
| Calculation method | RB3LYP |
| Basis set | 6-31G(d,p) |
| Final energy | -56.55776872 a.u. |
| RMS gradient norm | 0.00000013 a.u. |
| Dipole moment | 1.85 D |
| Point group | C1 |
| Time taken for calculation | 9.0 seconds |
The expected point group symmetry of C3v is not attained in the optimisation calculation above. This is because higher accuracy calculations are required to attain the correct point group symmetry of the NH3 molecule. In addition, the gradient is less than 0.0001 (expected gradient = 0 for a stationary point), indicating that the molecule has indeed been optimised.
 Item               Value     Threshold  Converged?
 Maximum Force            0.000000     0.000002     YES
 RMS     Force            0.000000     0.000001     YES
 Maximum Displacement     0.000001     0.000006     YES
 RMS     Displacement     0.000001     0.000004     YES
 Predicted change in Energy=-2.600465D-13
 Optimization completed.
    -- Stationary point found.
The table above shows that the forces have converged, meaning that for a small displacement, the energy does not change. This further confirms the successful optimisation of the molecule.
Frequency Analysis
The results of the NH3 6-31G (d,p) frequency analysis can be found in Table 12 below.
| Link to log file of Frequency Analysis of NH3 | |
|---|---|
| Link to D-Space | |
| File Type | .log |
| Calculation type | FREQ |
| Calculation method | RB3LYP |
| Basis set | 6-31G(d,p) |
| Final energy | -56.55776872 a.u. (Same (up to last 2 d.p.) as that recorded in optimisation step) |
| RMS gradient norm | 0.00000020 a.u. |
| Dipole moment | 1.85 D |
| Point group | C1 |
| Time taken for calculation | 33.9 seconds |
The expected point group symmetry of C3v is not attained in the optimisation calculation above. This is because higher accuracy calculations are required to attain the correct point group symmetry of the NH3 molecule. In addition, the gradient is less than 0.0001 (expected gradient = 0 for a stationary point), indicating that the molecule has indeed been optimised.
       Item               Value     Threshold  Converged?
 Maximum Force            0.000000     0.000002     YES
 RMS     Force            0.000000     0.000001     YES
 Maximum Displacement     0.000002     0.000006     YES
 RMS     Displacement     0.000001     0.000004     YES
 Predicted change in Energy=-8.193705D-13
 Optimization completed.
    -- Stationary point found.
The table above shows that the forces have converged, meaning that for a small displacement, the energy does not change. This further confirms the successful optimisation of the molecule.
Low frequencies ---   -8.2887   -6.5533   -4.4302    0.0005    0.0008    0.0014
Low frequencies --- 1089.3394 1693.9228 1693.9270
The low frequencies are within the range of ± 15 cm-1 and close to 0, indicating that the method employed in the frequency calculations was sufficiently accurate.
MO Analysis
Link to the log file
Link to D-Space
NBO Analysis
The NH3 NBO charge distribution is illustrated in Figure 6 below.
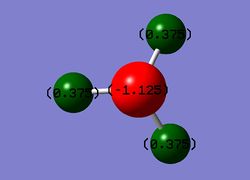
Charge Distribution: -1.125 - 1.125
Specific NBO charge for Nitrogen: -1.125
Specific NBO charge for Hydrogen: 0.375
NH3BH3
Optimisation: 6-31G (d,p) Calculation
The results of the NH3BH3 6-31G (d,p) Optimisation can be found in Table 13 below.
| Link to log file of 6-31G(d,p) Optimised NH3BH3 Molecule | |
|---|---|
| File Type | .log |
| Calculation type | FOPT |
| Calculation method | RB3LYP |
| Basis set | 6-31G(d,p) |
| Final energy | -83.22468911 a.u. |
| RMS gradient norm | 0.00000009 a.u. |
| Dipole moment | 5.56 D |
| Point group | C1 |
| Time taken for calculation | 44.0 seconds |
The gradient is less than 0.0001 (expected gradient = 0 for a stationary point), indicating that the molecule has indeed been optimised.
Item               Value     Threshold  Converged?
 Maximum Force            0.000000     0.000002     YES
 RMS     Force            0.000000     0.000001     YES
 Maximum Displacement     0.000000     0.000006     YES
 RMS     Displacement     0.000000     0.000004     YES
 Predicted change in Energy=-1.593712D-14
 Optimization completed.
    -- Stationary point found.
The table above shows that the forces have converged, meaning that for a small displacement, the energy does not change. This further confirms the successful optimisation of the molecule.
Frequency Analysis
The results of the NH3BH3 6-31G (d,p) frequency analysis can be found in Table 14 below.
| Link to log file of Frequency Analysis of NH3BH3 | |
|---|---|
| Link to D-Space | |
| File Type | .log |
| Calculation type | FREQ |
| Calculation method | RB3LYP |
| Basis set | 6-31G(d,p) |
| Final energy | -83.22468911 a.u. (Same (up to last 2 d.p.) as that recorded in optimisation step) |
| RMS gradient norm | 0.00000009 a.u. |
| Dipole moment | 5.56 D |
| Point group | C1 |
| Time taken for calculation | 153.9 seconds |
The gradient is less than 0.0001 (expected gradient = 0 for a stationary point), indicating that the molecule has indeed been optimised.
 Item               Value     Threshold  Converged?
 Maximum Force            0.000000     0.000002     YES
 RMS     Force            0.000000     0.000001     YES
 Maximum Displacement     0.000001     0.000006     YES
 RMS     Displacement     0.000000     0.000004     YES
 Predicted change in Energy=-6.087130D-13
 Optimization completed.
    -- Stationary point found.
The table above shows that the forces have converged, meaning that for a small displacement, the energy does not change. This further confirms the successful optimisation of the molecule.
  Low frequencies ---   -2.8702   -1.3787   -0.0007    0.0008    0.0009    3.5768
 Low frequencies ---  263.3606  632.9766  638.4460
The low frequencies are within the range of ± 15 cm-1 and close to 0, indicating that the method employed in the frequency calculations was sufficiently accurate.
Comparison of Reaction Energies
The comparison table of reaction energies between NH3, BH3, and NH3BH3 can be found in Table 15 below.
| E (NH3) / a.u. | - 56.55776872 |
|---|---|
| E (BH3) / a.u. | - 26.61532360 |
| E (NH3BH3) / a.u. | - 83.22468911 |
| Energy Difference/ a.u. | - 83.22468911 - ( - 26.61532360 - 56.55776872) = - 0.05159679 |
| Energy Difference = Association Energy / kJmol-1 | - 0.05159679 x 2625.50 = - 140 (Accuracy to 10 kJ/mol) |
| Dissociation Energy / kJmol-1 | 140 (Accuracy to 10 kJ/mol) |
As typical bond dissociation energies range from 100 kJmol-1 to 500 kJmol-1, the N - B bond dissociation energy in NH3BH3 of 140 kJmol-1 is a sensible value. In addition, since the bond present between NH3 and BH3 can be considered as a weak, dative interaction, the relatively low bond dissociation energy calculated seems reasonable.

