Rep:Mod:ECJ54953
Compulsory Section
Optimising and Analysing BH3
BH3 Optimisation
This was an optimisation job conducted on a molecule of BH3 in Gaussian. The method used was B3LYP and the basis set used was 3-21G. After the optimisation, the energy of the molecule was -26.46226429 au. It had a dipole moment of 3x10⁻⁴ D, with this effect arising from slight differences in the three B-H bond lengths - one was 1.53 Å, one was 1.54 Å and one was 1.55 Å. These differences also broke the symmetry of the molecule, causing the point group of the molecule to be CS rather than the more symmetrical D3h, the normal point group of a trigonal planar moleculular fragment. The gradient of the potential energy surface was 8.551x10⁻⁵. This value was very close to 0, which shows that the optimisation of the BH3 molecule was successful as the potential energy of the molecule was extremely close to its minimum and therefore the molecule was extremely close to its equilibrium state. The calculation took 21 seconds and the results file for the optimisation can be found here
Item table and optimised parameters:
         Item               Value     Threshold  Converged?
 Maximum Force            0.000220     0.000450     YES
 RMS     Force            0.000106     0.000300     YES
 Maximum Displacement     0.000709     0.001800     YES
 RMS     Displacement     0.000447     0.001200     YES
 Predicted change in Energy=-1.672478D-07
 Optimization completed.
    -- Stationary point found.
                           ----------------------------
                           !   Optimized Parameters   !
                           ! (Angstroms and Degrees)  !
 --------------------------                            --------------------------
 ! Name  Definition              Value          Derivative Info.                !
 --------------------------------------------------------------------------------
 ! R1    R(1,2)                  1.1947         -DE/DX =   -0.0002              !
 ! R2    R(1,3)                  1.1948         -DE/DX =   -0.0002              !
 ! R3    R(1,4)                  1.1944         -DE/DX =   -0.0001              !
 ! A1    A(2,1,3)              120.0157         -DE/DX =    0.0                 !
 ! A2    A(2,1,4)              119.9983         -DE/DX =    0.0                 !
 ! A3    A(3,1,4)              119.986          -DE/DX =    0.0                 !
 ! D1    D(2,1,4,3)            180.0            -DE/DX =    0.0                 !
 --------------------------------------------------------------------------------
After this, a new job was run using the 6-31G(d,p) basis set. This optimisation job gave a total energy for the molecule of -26.61532360 au and a new dipole moment of 1x10⁻⁴, due to reductions in the differences of the B-H bond lengths. The point group of the molecule is still CS, however. The new gradient is 7.07x10⁻⁶, which indicates that the 6-31G(d,p) optimised BH3 is closer to its energy minimum and equilibrium structure than the 3-21G optimised molecule. This optimisation took four seconds and the results file is found here.
Item table and optimised parameters:
         Item               Value     Threshold  Converged?
 Maximum Force            0.000012     0.000450     YES
 RMS     Force            0.000008     0.000300     YES
 Maximum Displacement     0.000061     0.001800     YES
 RMS     Displacement     0.000038     0.001200     YES
 Predicted change in Energy=-1.069855D-09
 Optimization completed.
    -- Stationary point found.
                           ----------------------------
                           !   Optimized Parameters   !
                           ! (Angstroms and Degrees)  !
 --------------------------                            --------------------------
 ! Name  Definition              Value          Derivative Info.                !
 --------------------------------------------------------------------------------
 ! R1    R(1,2)                  1.1923         -DE/DX =    0.0                 !
 ! R2    R(1,3)                  1.1923         -DE/DX =    0.0                 !
 ! R3    R(1,4)                  1.1923         -DE/DX =    0.0                 !
 ! A1    A(2,1,3)              120.0055         -DE/DX =    0.0                 !
 ! A2    A(2,1,4)              120.0007         -DE/DX =    0.0                 !
 ! A3    A(3,1,4)              119.9939         -DE/DX =    0.0                 !
 ! D1    D(2,1,4,3)            180.0            -DE/DX =    0.0                 !
 --------------------------------------------------------------------------------
The optimised B-H bond length is 1.1923 Å and the bond angles were about 120°, with about 0.5° of error. There is a good agreement with this bond length and one determined experimentally through FTIR spectroscopy, which was 1.190 Å.[1] The fact that the bond length calculated using the 6-31G(d,p) basis set was closer to the experimental value than the one that used the 3-21G basis set shows that the 6-31G(d,p) basis set is superior.
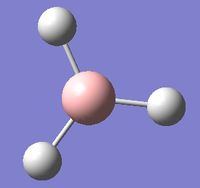
The optimised BH3 molecule is shown here:
Frequency Analysis of BH3
| File Type | .log |
| Calculation Type | FREQ |
| Calculation Method | RB3LYP |
| Basis Set | 6-31G(d,p) |
| Total Energy (hartrees) | -26.61532363 |
| RMS Gradient Norm (hartrees) | 0.00000284 |
| Dipole Moment | 0.0001 |
| Point Group | D3h |
| Job CPU Time | 4 seconds |
| Log File Location | file found here |
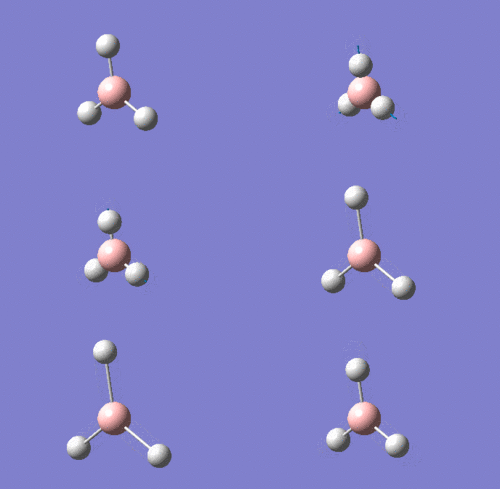
The BH3 molecule was constrained to D3h symmetry to ensure the low frequencies remained in the desired range of between -15 and +15 cm-1, because calculations in which the symmetry was not restricted resulted in low frequencies that were well outside the range. The low frequencies obtained were as follows:
 Low frequencies ---   -0.9382   -0.8426   -0.0053    5.8717   11.7883   11.8256
 Low frequencies --- 1162.9968 1213.1829 1213.1856
Item table:
         Item               Value     Threshold  Converged?
 Maximum Force            0.000006     0.000450     YES
 RMS     Force            0.000003     0.000300     YES
 Maximum Displacement     0.000022     0.001800     YES
 RMS     Displacement     0.000011     0.001200     YES
 Predicted change in Energy=-1.909158D-10
 Optimization completed.
    -- Stationary point found.
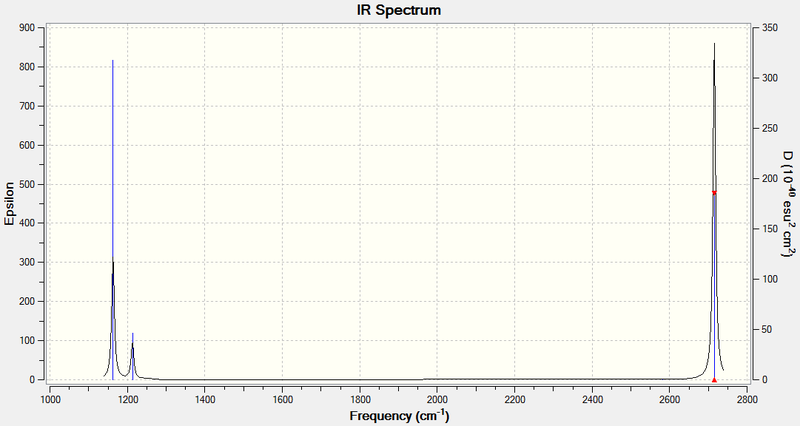
The IR spectrum of BH3 is shown below:
Vibration 4 has an intensity of 0, and hence doesn't appear in the IR spectrum, because it involves no change in the overall dipole of the molecule. The selection rules for IR spectroscopy stipulate that an IR active vibrational mode must involve a change in dipole moment, but vibration 4 has A1' symmetry and is therefore totally symmetric. Hence, it is an IR inactive mode and a peak at 2572.27 cm-1 will not be seen. This can also be seen from the character table - A1', the symmetry label of vibration 4, is not associated with an x, y or z function, which is a requirement for the band to show up in IR. Fewer than five peaks are seen because the vibrations 2 and 3 and the vibrations 5 and 6 have virtually identical wavenumbers and intensities and E' symmetry labels, making them two pairs of doubly degenerate vibrational modes. Therefore, each pair only shows up as one IR peak.
Optimising and Analysing GaBr3
GaBr3 Optimisation
The optimisation job was run in Gaussian using the B3LYP method with the LanL2DZ medium level basis set, which models heavy atoms like Ga and Br with Los Alamos ECP pseudopotentials. The calculated energy of the molecule was -41.70082873 au and the molecule had no dipole moment, as a result of the symmetry being restricted to ensure it keeps the D3h point group. The gradient of the potential surface was 1.6x10⁻⁷, which shows that the results produced by the optimisation are very close to the actual equilibrium structure and energy minimum. The log file for this optimisation operation can be found at DOI:10042/26892 .
Item table and optimised parameters:
        Item              Value      Threshold  Converged?
Maximum Force            0.000000     0.000450     YES
RMS     Force            0.000000     0.000300     YES
Maximum Displacement     0.000003     0.001800     YES
RMS     Displacement     0.000002     0.001200     YES
Predicted change in Energy=-1.282693D-12
Optimization completed.
-- Stationary point found.
                           ----------------------------
                           !   Optimized Parameters   !
                           ! (Angstroms and Degrees)  !
 --------------------------                            --------------------------
 ! Name  Definition              Value          Derivative Info.                !
 --------------------------------------------------------------------------------
 ! R1    R(1,2)                  2.3502         -DE/DX =    0.0                 !
 ! R2    R(1,3)                  2.3502         -DE/DX =    0.0                 !
 ! R3    R(1,4)                  2.3502         -DE/DX =    0.0                 !
 ! A1    A(2,1,3)              120.0            -DE/DX =    0.0                 !
 ! A2    A(2,1,4)              120.0            -DE/DX =    0.0                 !
 ! A3    A(3,1,4)              120.0            -DE/DX =    0.0                 !
 ! D1    D(2,1,4,3)            180.0            -DE/DX =    0.0                 !
 --------------------------------------------------------------------------------
The optimised Ga-Br distance is 2.35 Å and the optimised bond angle is exactly 120°. The bond length has previously been calculated as 2.35 Å using a B3LYP method and calculated experimentally using vapour phase electron diffraction as 2.22 Å, while the experimentally obtained bond angle is 120° ± 0.1°.[2] There is a very good agreement between the calculated and experimental bond angles and a reasonable agreement between the calculated and experimental bond lengths, with the excellent agreement with the literature value for the calculated bond length showing that errors in the calculated distance are due to the limitations of the method and basis set.
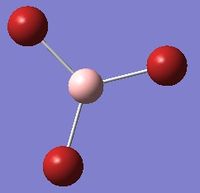
The optimised GaBr3 molecule is shown here:
Frequency Analysis of GaBr3
| File Type | .log |
| Calculation Type | FREQ |
| Calculation Method | RB3LYP |
| Basis Set | LanL2DZ |
| Total Energy (hartrees) | -41.70082783 |
| RMS Gradient Norm (hartrees) | 0.00000014 |
| Dipole Moment | 0.0000 |
| Job CPU Time | 16.8 seconds |
| Log File Location | DOI:10042/26947 |
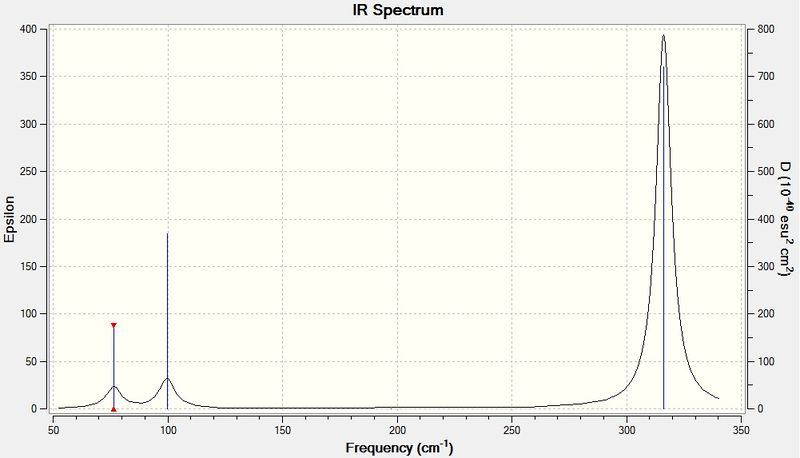
Low frequencies:
 Low frequencies ---   -0.5293   -0.5288   -0.0024   -0.0010    0.0233    1.1993
 Low frequencies ---   76.3744   76.3753   99.6981
Item table:
         Item               Value     Threshold  Converged?
 Maximum Force            0.000000     0.000450     YES
 RMS     Force            0.000000     0.000300     YES
 Maximum Displacement     0.000002     0.001800     YES
 RMS     Displacement     0.000001     0.001200     YES
 Predicted change in Energy=-9.780724D-13
 Optimization completed.
    -- Stationary point found.
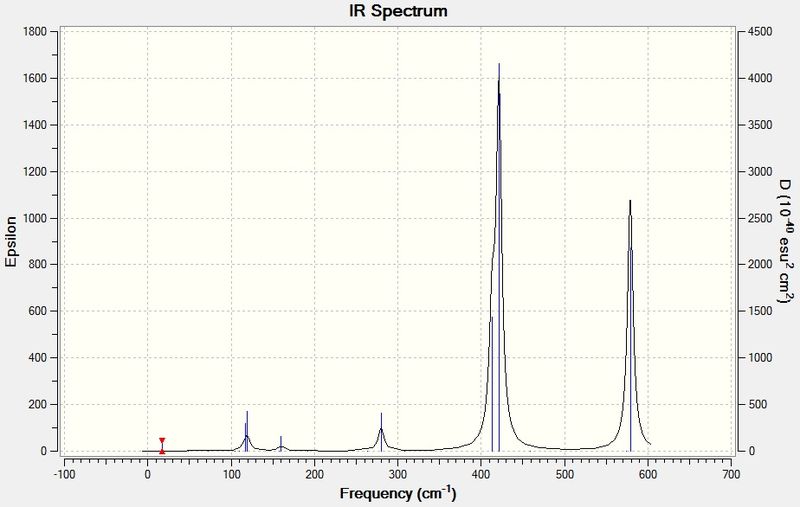
The IR spectrum of GaBr3 is shown below:
BBr3 Optimisation
The optimisation of the BBr3 molecule was carried out in Gaussian using the B3LYP method, as with BH3 and GaBr3, while the basis set used a mixture of a standard basis set and pseudopotentials. By editing the input file manually,the B atom was set to be modelled with the 6-31G(d,p) basis set while the Br atoms were modelled by pseudopotentials from the LanL2DZ set. The total energy of the molecule was found to be -64.43644651 au and the dipole moment was 2x10⁻⁴ D as a result of small deviations from planarity. The gradient of the potential energy surface was 9.41x10⁻⁶, a value very close to 0 which proves the success of the optimisation. The log file for this optimisation is located at DOI:10042/26909 .
Item table and optimised parameters:
        Item              Value      Threshold  Converged?
Maximum Force            0.000023     0.000450     YES
RMS     Force            0.000011     0.000300     YES
Maximum Displacement     0.000148     0.001800     YES
RMS     Displacement     0.000084     0.001200     YES
Predicted change in Energy=-2.424079D-09
Optimization completed.
-- Stationary point found.
                          ----------------------------
                          !   Optimized Parameters   !
                          ! (Angstroms and Degrees)  !
--------------------------                            --------------------------
! Name  Definition              Value          Derivative Info.                !
--------------------------------------------------------------------------------
! R1    R(1,2)                  1.9339         -DE/DX =    0.0                 !
! R2    R(1,3)                  1.934          -DE/DX =    0.0                 !
! R3    R(1,4)                  1.934          -DE/DX =    0.0                 !
! A1    A(2,1,3)              120.0027         -DE/DX =    0.0                 !
! A2    A(2,1,4)              119.9973         -DE/DX =    0.0                 !
! A3    A(3,1,4)              120.0            -DE/DX =    0.0                 !
! D1    D(2,1,4,3)            180.0            -DE/DX =    0.0                 !
--------------------------------------------------------------------------------
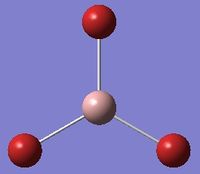
The optimised B-Br distance was, on average, about 1.934 Å while the bond angles were very close to 120°, with some small deviations from a perfect planar structure as a result of the fact the symmetry was not fixed.
The optimised BBr3 molecule is shown here:
Comparisons of Molecules
Structure Comparisons
| B-H | Ga-Br | B-Br |
|---|---|---|
| 1.192 | 2.350 | 1.934 |
The calculated bond lengths show a clear trend: larger elements produce longer bonds. The B-Br bond was considerably longer than the B-H bond because of the much larger covalent radius of Br, due to its greater number of filled orbitals. The different frontier orbitals also lead to differences in the B-H and B-Br bond strengths. The 4s and 4p orbitals of Br are much larger and more diffuse than the 2s and 2p orbitals of B, so they will not be able to overlap very much. This leads to less stabilisation of the bonding molecular orbital and a weaker bond. By contrast, the 1s orbitals of H are closer in energy to the B 2s and 2p, so will be able to overlap strongly for a more stabilised bonding orbital and a stronger bond. Electronegativity considerations also cause differences between the B-H and B-Br bonds. Br is considerably more electronegative than H (their Pauling electronegativities are 2.98 and 2.20 respectively[3]), which is already more electronegative than B (which has a Pauling electronegativity of 2.04[3]), so the electronegativity difference will be greater in the B-Br bond and the bond will be more polarised. The greater electronegativity difference also imparts some ionic character to the B-Br bond which is not present in the largely non-polar B-H bond, strengthening it and at least partially compensating for the weaker orbital overlap.
The bonds lengthen as B is changed to Ga for the same reason they lengthen when H is changed to Br. Ga is a Period 4 with a larger covalent radius than B because of the additional filled orbitals, so the Br atoms are unable to get as close to a Ga centre as to a B centre. Ga also has a Pauling electronegativity of 1.81[3], which is lower than B, so the electronegativity difference will be more significant and the Ga-Br bond will be even more polarised than the B-Br bond. This implies that there is a more significant ionic contribution to the Ga-Br bond than the B-Br bond, so the Ga-Br bond will be stronger than the B-Br bond.
B and Ga are similar in that they are both Group 13 elements that form trivalent compounds without a full octet that can act as Lewis acids, but their properties differ in some ways beyond that. Trivalent gallium compounds (particularly trihalides) are capable of dimerising to complete their octets whereas it is more difficult for boron compounds because of steric hindrance around the small central boron atom - hence, BH3 can dimerise whereas the larger BBr3 can't because there is not enough space to fit four bromine atoms around one boron. However, boron trihalides can be stabilised by the donation of a halogen lone pair into the empty p orbital. This effect is relatively weak for BBr3 because of the orbital size mismatch, but can be seen strongly in BF3. Trivalent boron compounds are more Lewis acidic because the empty p orbital on the boron is smaller and the nuclear charge is less shielded than the empty p orbital on a three-coordinate gallium; it will therefore be more attractive to lone pairs of electrons. This property and the stronger bonds formed by boron make it more useful for most practical applications.
The absence of a bond in Gaussview doesn't necessarily mean that there is no bond there. Gaussview only adds in bonds when they are shorter than a predefined length; for the B-H bond it can be inferred that this is when the distance approaches the experimentally determined bond length of 1.19 Å[1] because, in the first optimisation, it drew in the bonds for iterations with B-H distances shorter than 1.20 Å but not for the iteration with a B-H distance of 1.26 Å. That a lengthening of the B-H distance from the equilibrium bond length does not necessarily lead to the absence of a bond can be seen by looking at the potential energy surface. Lengthening the bond leads to an increase in the energy of the bond and the molecule from its most stable state but doesn't lead to the dissociation of the bond into its constituent atoms until the dissociation limit is reached, and an increase in bond length of 0.07 Å corresponds to a relatively small amount of energy so which is unlikely to have raised the molecule above its dissociation limit. Therefore, the absence of a bond cannot be determined just by looking at where the bonds are drawn in Gaussview.
A bond is, at its most simple, the attractive interaction of atoms due to the sharing of electrons between them. In simple compounds this usually presents as, for instance, an electron from an atom interacting with an electron from a different atom to form a pair, which results in attraction between the atoms and a covalent bond. But this picture is not able to adequately describe the bonding in a large number of compounds. A bond with a large enough electronegativity difference is polarised sufficiently that the pair of electrons is localised entirely on one of the atoms, forming an ionic bond held together by electrostatic interactions. The interactions between Lewis acids and Lewis bases are also different, with a standard covalent bond formed but the pair of electrons coming exclusively from one of the atoms. Other bonding interactions involve the delocalisation of electron density. The BH3 dimer diborane is seemingly electron deficient but the electrons are located in bonding molecular orbitals delocalised over the entire molecule, so it has enough electrons to stabilise the structure. Attractive intermolecular interactions also count as bonding and are caused by attractions between dipoles in other molecules. Bonds are, in other words, attractive interactions between atoms to mediate the formation of more complex structures.
Comparison of Frequencies
| Vibrational Mode | BH3 Frequency (cm-1) | GaBr3 Frequency (cm-1) |
|---|---|---|
| A2'' | 1163.00 | 99.70 |
| E' | 1213.18, 1213.19 | 77.37, 76.38 |
| A 1' | 2572.27 | 197.34 |
| E' | 2715.44, 2715.45 | 316.18, 316.19 |
The vibrational frequencies of GaBr3 are all lower than for BH3 because of the increased mass of the molecules. The vibrational frequency of a bond is proportional to √(k/μ), where k is the force constant and μ is the reduced mass. The reduced mass of GaBr3 is much larger because Ga and Br are more massive atoms than B and H, which then decreases the vibrational frequencies. The absorption peaks on the IR spectrum of GaBr3 also appear broader than the BH3 peaks because of the smaller range over which the spectrum is simulated and the intensities of the peaks are also lower. The quantity epsilon on the spectrum represents the molar extinction coefficient of each mode, which is proportional to its absorbance, and the fact that this is lower for every GaBr3 vibrational mode shows that GaBr3 absorbs less strongly in the IR range. This is because of the different spacing of its vibrational energy levels, with the low wavenumbers seen implying the vibrational energy levels are closely spaced.
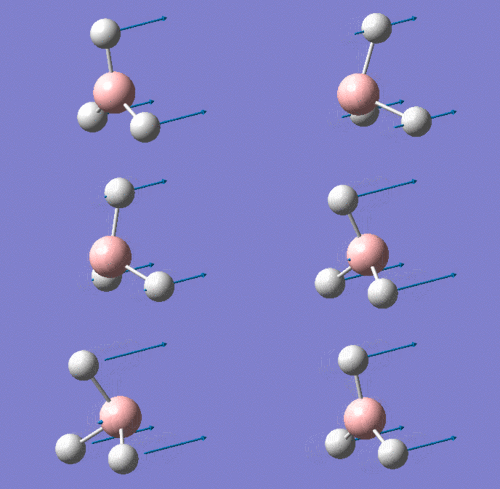
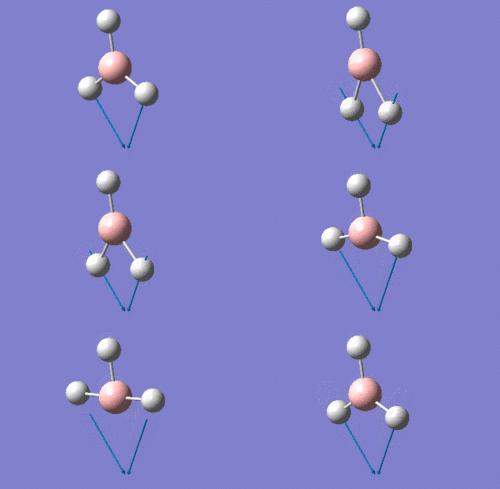
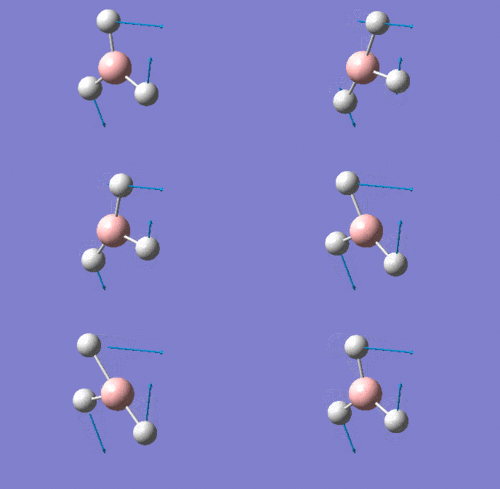
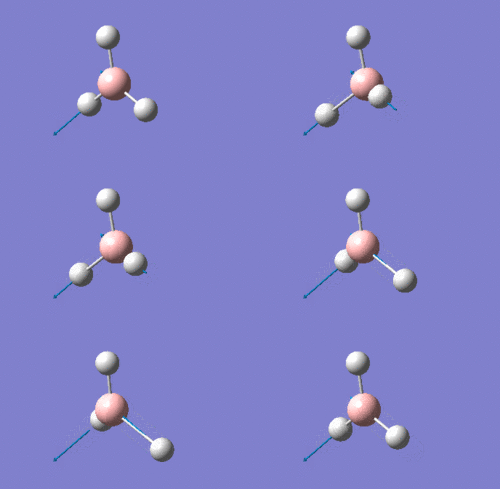
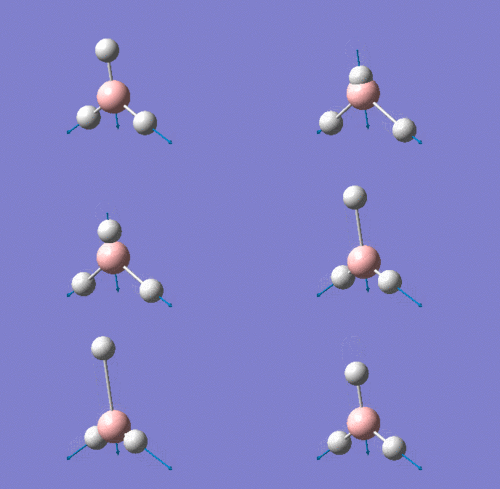
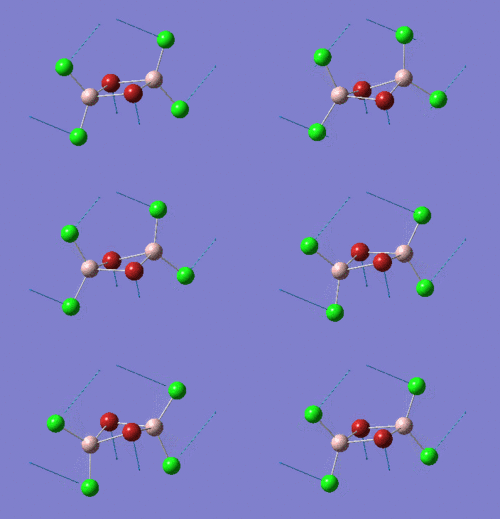
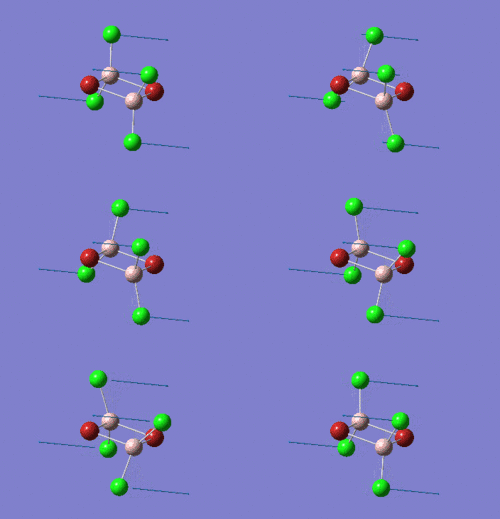
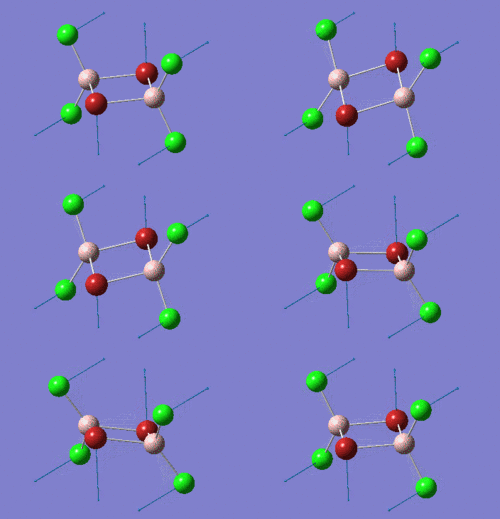
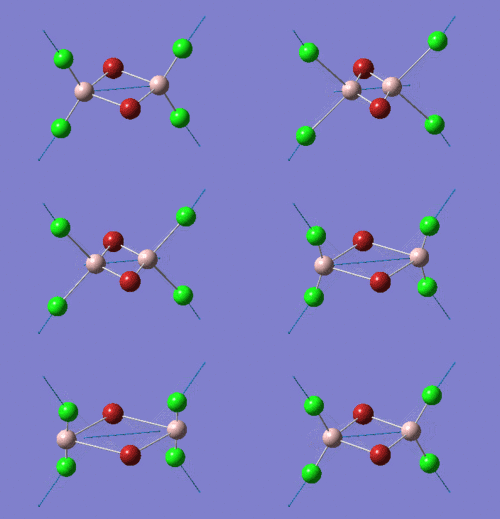
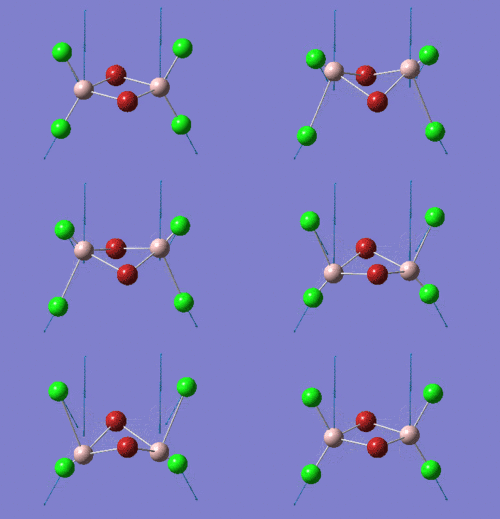
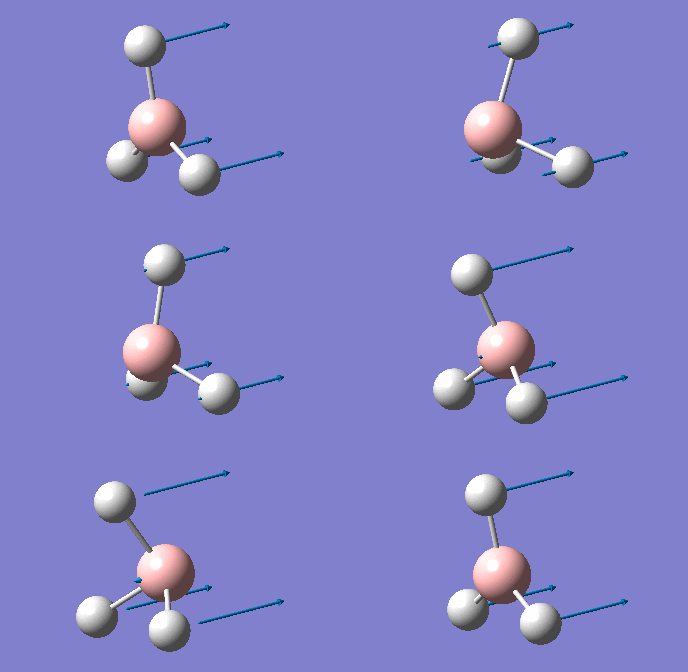
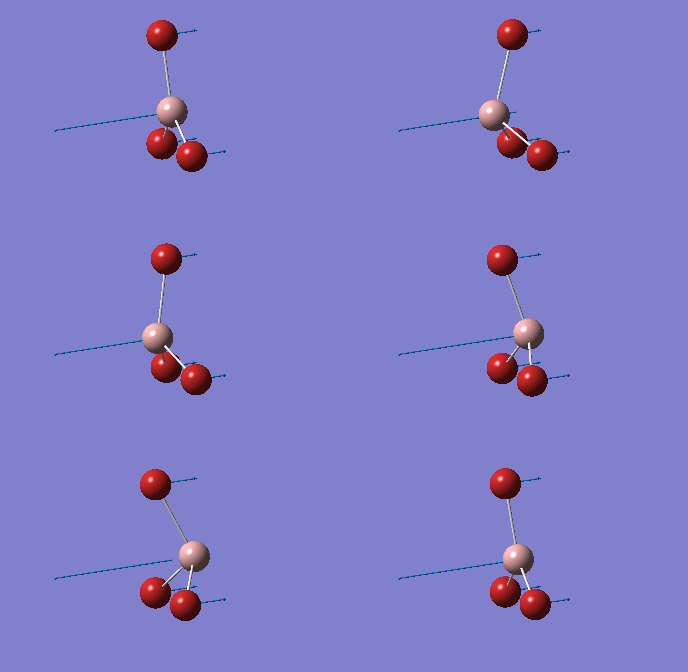
The A2'' and E' and A1' and E' modes form two pairs because the first two represent bends of the molecule while the latter two represent stretches. The stretches have higher wavenumbers because stretching a bond is more difficult than bending it, and consequently requires more energy. But because all the bonds in each molecule are identical, there is not much of an energy difference between each bend or stretch so they appear at similar wavenumbers. This applies to both spectra - even though all the vibrational modes in Gabr3 have lower wavenumbers, the bends have proportionally lower wavenumbers. In the IR spectrum of GaBr3, the A2'' bending mode has swapped with the E' bends so that it is higher in energy. The differences in the bends can be seen when the bending modes of GaBr3 and BH3 are visualised in Gaussview (this is shown below). The H atoms of BH3 are very light and can bend more easily, so in the out of plane bending mode the central B atom is largely stationary while the H atoms bend out of the plane of the molecule. However, Br is a larger atom than Ga so in the out of plane bend of GaBr3 it is the Br atoms that remain almost stationary while the central Ga atom moves more strongly. This form of the vibrational mode requires proportionally more energy than the one where the outer atoms are moving more, so the A2'' mode in GaBr3 has a higher energy than the E' bends while the A2'' mode in BH3 does not.
| BH3 | GaBr3 |
 |
|
It is important to use the same basis set and method for the optimisation and frequency analysis calculations because different methods and basis sets use different approximations when calculating the properties of a molecule. Different basis sets model the molecule to different degrees of accuracy - as noted above, modelling BH3 in the 3-21G and 6-31G(d,p) basis sets produced significantly different results, so running a frequency analysis calculation in a different basis set would provide no useful information about how effectively the structure had been optimised in its original basis set. Something similar applies for methods - B3LYP is a DFT method which computes the properties by numerical integration, so will produce different results to other methods that do not involve this. Using a different method will also expect differences in the structure and properties and so the low frequencies generated in this way will not give an accurate picture of the other method's optimisation and its effectiveness.
The low frequencies obtained by a Gaussian frequency analysis represent the rotational and translational motions of the molecule's centre of mass. In an ideally optimised structure, these should be very small because the geometry and position of the molecule should be essentially fixed. The low frequencies can therefore be used as an error in the optimisation of the molecule, and a frequency analysis is therefore necessary to ensure that the molecule is really optimised to a minimum. For a DFT method, getting the low frequencies into the region between +15 and -15 can be done by using a keyword like int=ultrafine to improve the accuracy of the numerical integration grid. Insufficiently low low frequencies also introduce errors into other properties of the molecule that can be computed, such as the vibrational frequencies and IR spectrum.[4]
Molecular Orbitals of BH3
| File Type | .fch |
| Calculation Type | SP |
| Calculation Method | RB3LYP |
| Basis Set | 6-31G(d,p) |
| Total Energy (hartrees) | -26.61532360 |
| RMS Gradient Norm (hartrees) | 0.00000000 |
| Dipole Moment | 0.0001 |
| Log File Location | DOI:10042/26979 |
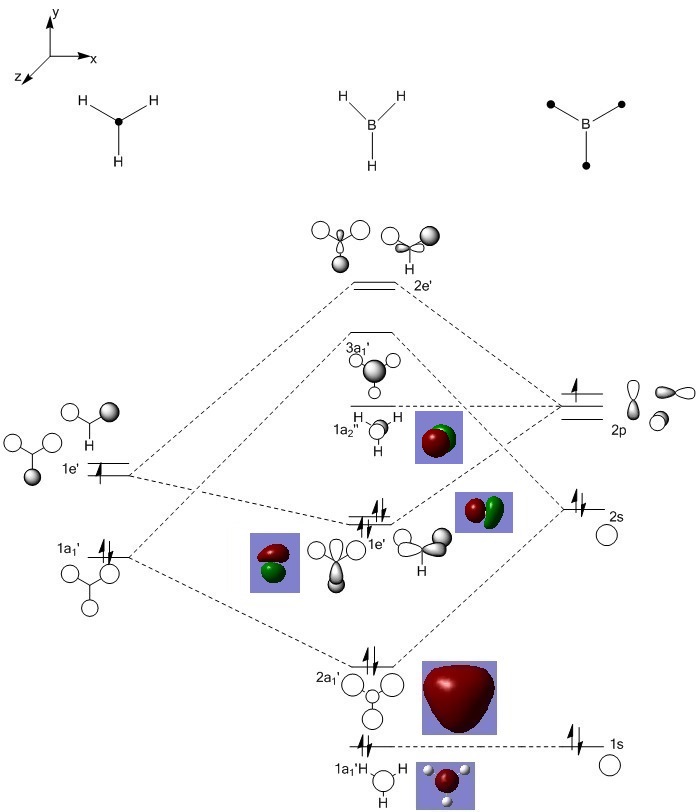
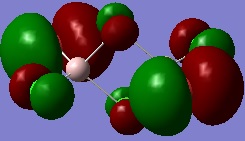
MO diagram using LCAO approximation, with Gaussian MOs overlaid:
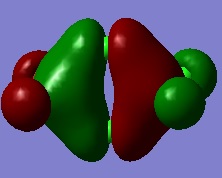
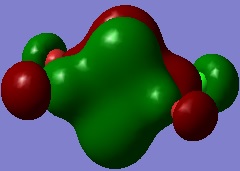
Several of the molecular orbitals calculated by Gaussian show good agreement with the MOs derived using the LCAO approximation. The lowest energy 1a1' MO is the same in both cases, being simply the 1s orbital of the central boron atom. This orbital is too low in energy to interact with any of the H atoms. The 2a1' orbital also agrees well, as in both models it is a region of uniform charge spread over the whole molecule, as does the 1e' with charge split between what in the pictures is the "upper and "lower" sections of the molecule. Differences are seen in MOs that in the LCAO approximation have atoms free of any charge density. The other 1e' orbital in the LCAO approximation has a node on the "lower" hydrogen atom, whereas the corresponding Gaussian MO has charge spread over this atom too. In fact, the two 1e' orbitals calculated by Gaussian have identical, if differently aligned, charge distributions, making it easier to see that the two levels are degenerate. The 1a2'' orbital is also different in both cases - the LCAO orbital is a free, non-bonding p orbital on boron whereas the Gaussian orbital has the same charge distribution as a p orbital but spread over the whole molecule. Generally, while the LCAO approximation can't completely approximate the real molecular orbitals it produces a workable approximation as even when there were differences between the LCAO MOs and real MOs there were also significant similarities in the charge distributions; the charge was just generally more delocalised in the real MOs.
Natural Bond Orbitals of NH3
Optimisation of NH3 molecule
The optimisation calculation was run twice, with the first one unsuccessful at producing an optimised NH3 molecule. To get around this, the keywords int=ultrafine and scf=conver=9 were added to the calculation setup.
| File Type | .log |
| Calculation Type | FOPT |
| Calculation Method | RB3LYP |
| Basis Set | 6-31G(d,p) |
| Total Energy (hartrees) | -56.55776872 |
| RMS Gradient Norm (hartrees) | 0.00000187 |
| Dipole Moment (D) | 1.8464 |
| Point Group | C3v |
| Job CPU Time | 4 seconds |
| Log File Location | file found here |
Item table and converged parameters:
         Item               Value     Threshold  Converged?
 Maximum Force            0.000003     0.000015     YES
 RMS     Force            0.000002     0.000010     YES
 Maximum Displacement     0.000026     0.000060     YES
 RMS     Displacement     0.000017     0.000040     YES
 Predicted change in Energy=-1.432666D-10
 Optimization completed.
    -- Stationary point found.
                           ----------------------------
                           !   Optimized Parameters   !
                           ! (Angstroms and Degrees)  !
 --------------------------                            --------------------------
 ! Name  Definition              Value          Derivative Info.                !
 --------------------------------------------------------------------------------
 ! R1    R(1,2)                  1.018          -DE/DX =    0.0                 !
 ! R2    R(1,3)                  1.018          -DE/DX =    0.0                 !
 ! R3    R(1,4)                  1.018          -DE/DX =    0.0                 !
 ! A1    A(2,1,3)              105.7462         -DE/DX =    0.0                 !
 ! A2    A(2,1,4)              105.7462         -DE/DX =    0.0                 !
 ! A3    A(3,1,4)              105.7462         -DE/DX =    0.0                 !
 ! D1    D(2,1,4,3)           -111.867          -DE/DX =    0.0                 !
 --------------------------------------------------------------------------------
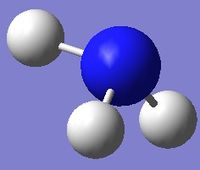
The optimised NH3 molecule is shown here:
Frequency Analysis of NH3
| File Type | .log |
| Calculation Type | FREQ |
| Calculation Method | RB3LYP |
| Basis Set | 6-31G(d,p) |
| Total Energy (hartrees) | -56.55776872 |
| RMS Gradient Norm (hartrees) | 0.00000187 |
| Dipole Moment (D) | 1.8464 |
| Point Group | C3 |
| Job CPU Time | 7 seconds |
| Log File Location | file found here |
The symmetry of the molecule was reduced from C3v to C3 when the frequency analysis was run. This will have affected the symmetry labels of the vibrational modes and molecular orbitals of the NH3 molecule, but it shouldn't make too much of a difference to the NBOs. And despite this, the low frequencies were very low indicating that the frequency analysis was successful.
Low frequencies:
 Low frequencies ---   -0.0411   -0.0145    0.0004    1.6412    1.6437    2.4682
 Low frequencies --- 1089.2851 1693.9239 1693.9239
Frequency table:
                      1                      2                      3
                     A1                      E                      E
 Frequencies --   1089.6629              1694.1733              1694.1737
 Red. masses --      1.1800                 1.0644                 1.0644
 Frc consts  --      0.8255                 1.8001                 1.8001
 IR Inten    --    145.4476                13.5570                13.5572
  Atom  AN      X      Y      Z        X      Y      Z        X      Y      Z
     1   7     0.00   0.00   0.12    -0.07   0.00   0.00     0.00   0.07   0.00
     2   1     0.00  -0.21  -0.53     0.76   0.00   0.00     0.00   0.15   0.26
     3   1     0.18   0.11  -0.53     0.08  -0.39   0.22     0.39  -0.53  -0.13
     4   1    -0.18   0.11  -0.53     0.08   0.39  -0.22    -0.39  -0.53  -0.13
                      4                      5                      6
                     A1                      E                      E
 Frequencies --   3461.0664              3589.5533              3589.5534
 Red. masses --      1.0272                 1.0883                 1.0883
 Frc consts  --      7.2500                 8.2622                 8.2622
 IR Inten    --      1.0589                 0.2701                 0.2702
  Atom  AN      X      Y      Z        X      Y      Z        X      Y      Z
     1   7     0.00   0.00  -0.04     0.00   0.08   0.00     0.08   0.00   0.00
     2   1     0.00  -0.55   0.18     0.00  -0.75   0.31     0.02   0.00   0.00
     3   1     0.47   0.27   0.18    -0.34  -0.17  -0.15    -0.56  -0.34  -0.27
     4   1    -0.47   0.27   0.18     0.34  -0.17  -0.15    -0.56   0.34   0.27
Item table:
         Item               Value     Threshold  Converged?
 Maximum Force            0.000004     0.000450     YES
 RMS     Force            0.000002     0.000300     YES
 Maximum Displacement     0.000038     0.001800     YES
 RMS     Displacement     0.000016     0.001200     YES
 Predicted change in Energy=-1.836576D-10
 Optimization completed.
    -- Stationary point found.
NBO Analysis of NH3
| File Type | .log |
| Calculation Type | SP |
| Calculation Method | RB3LYP |
| Basis Set | 6-31G(d,p) |
| Total Energy (hartrees) | -56.55776872 |
| RMS Gradient Norm (hartrees) | 0.00000000 |
| Dipole Moment | 1.8464 |
| Point Group | C3 |
| Log File Location | File located here |
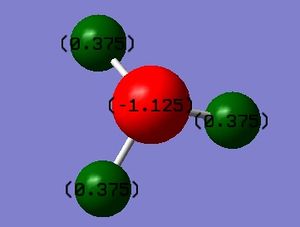
Charge distribution of NH3:
The colour scale goes from -1.125 (bright red) to +1.125 (bright green). The NBO charges of each atom are -1.125 on N and +0.375 on each H atom.
Association Energy of Ammonia-Borane
Optimisation of Ammonia-Borane
| File Type | .log |
| Calculation Type | FOPT |
| Calculation Method | RB3LYP |
| Basis Set | 6-31G(d,p) |
| Total Energy (hartrees) | -83.22469032 |
| RMS Gradient Norm (hartrees) | 0.00005935 |
| Dipole Moment (D) | 5.5648 |
| Point Group | C1 |
| Job CPU Time | 24 seconds |
| Log File Location | file located here |
The point group of C1 was seen because symmetry was disabled in Gaussview prior to running the calculation. This is not necessarily an accurate reflection of the symmetry of the ammonia-borane molecule, which ideally has a point group of C3v.
Item table and optimised parameters:
Item               Value     Threshold  Converged?
 Maximum Force            0.000121     0.000450     YES
 RMS     Force            0.000057     0.000300     YES
 Maximum Displacement     0.000508     0.001800     YES
 RMS     Displacement     0.000294     0.001200     YES
 Predicted change in Energy=-1.611643D-07
 Optimization completed.
    -- Stationary point found.
                           ----------------------------
                           !   Optimized Parameters   !
                           ! (Angstroms and Degrees)  !
 --------------------------                            --------------------------
 ! Name  Definition              Value          Derivative Info.                !
 --------------------------------------------------------------------------------
 ! R1    R(1,7)                  1.0186         -DE/DX =   -0.0001              !
 ! R2    R(2,7)                  1.0186         -DE/DX =   -0.0001              !
 ! R3    R(3,7)                  1.0186         -DE/DX =   -0.0001              !
 ! R4    R(4,8)                  1.21           -DE/DX =   -0.0001              !
 ! R5    R(5,8)                  1.21           -DE/DX =   -0.0001              !
 ! R6    R(6,8)                  1.21           -DE/DX =   -0.0001              !
 ! R7    R(7,8)                  1.6681         -DE/DX =   -0.0001              !
 ! A1    A(1,7,2)              107.873          -DE/DX =    0.0                 !
 ! A2    A(1,7,3)              107.873          -DE/DX =    0.0                 !
 ! A3    A(1,7,8)              111.0212         -DE/DX =    0.0                 !
 ! A4    A(2,7,3)              107.8692         -DE/DX =    0.0                 !
 ! A5    A(2,7,8)              111.0298         -DE/DX =    0.0                 !
 ! A6    A(3,7,8)              111.0297         -DE/DX =    0.0                 !
 ! A7    A(4,8,5)              113.8796         -DE/DX =    0.0                 !
 ! A8    A(4,8,6)              113.8796         -DE/DX =    0.0                 !
 ! A9    A(4,8,7)              104.5972         -DE/DX =    0.0                 !
 ! A10   A(5,8,6)              113.8728         -DE/DX =    0.0                 !
 ! A11   A(5,8,7)              104.591          -DE/DX =    0.0                 !
 ! A12   A(6,8,7)              104.591          -DE/DX =    0.0                 !
 ! D1    D(1,7,8,4)            179.9998         -DE/DX =    0.0                 !
 ! D2    D(1,7,8,5)            -59.9967         -DE/DX =    0.0                 !
 ! D3    D(1,7,8,6)             59.9963         -DE/DX =    0.0                 !
 ! D4    D(2,7,8,4)            -60.0005         -DE/DX =    0.0                 !
 ! D5    D(2,7,8,5)             60.003          -DE/DX =    0.0                 !
 ! D6    D(2,7,8,6)            179.996          -DE/DX =    0.0                 !
 ! D7    D(3,7,8,4)             60.0001         -DE/DX =    0.0                 !
 ! D8    D(3,7,8,5)           -179.9964         -DE/DX =    0.0                 !
 ! D9    D(3,7,8,6)            -60.0034         -DE/DX =    0.0                 !
 --------------------------------------------------------------------------------
The optimised ammonia-borane molecule is shown here:
Frequency Analysis of Ammonia-Borane
| File Type | .log |
| Calculation Type | FREQ |
| Calculation Method | RB3LYP |
| Basis Set | 6-31G(d,p) |
| Total Energy (hartrees) | -83.22468911 |
| RMS Gradient Norm (hartrees) | 0.000000009 |
| Dipole Moment (D) | 5.5646 |
| Point Group | C1 |
| Job CPU Time | 27 seconds |
| Log File Location | file located here |
This calculation produced a point group of C1 for the same reason as the optimisation: the symmetry was disabled before the calculation was run.
Low frequencies:
Low frequencies ---   -2.9032   -1.3508   -0.0010   -0.0010   -0.0007    3.6230
 Low frequencies ---  263.3605  632.9764  638.4446
The low frequency values are between -15 and +15 so the optimisation was a success.
Frequency table:
1                      2                      3
                      A                      A                      A
 Frequencies --    263.3605               632.9764               638.4446
 Red. masses --      1.0078                 5.0022                 1.0452
 Frc consts  --      0.0412                 1.1808                 0.2510
 IR Inten    --      0.0000                14.0111                 3.5493
  Atom  AN      X      Y      Z        X      Y      Z        X      Y      Z
     1   1     0.00   0.00  -0.45     0.36   0.00   0.00     0.59   0.17   0.00
     2   1     0.00  -0.39   0.22     0.36   0.00   0.00    -0.29   0.20  -0.02
     3   1     0.00   0.39   0.22     0.36   0.00   0.00    -0.29   0.20   0.02
     4   1     0.00   0.00  -0.36    -0.29   0.03   0.00     0.46   0.11   0.00
     5   1     0.00   0.32   0.18    -0.29  -0.02   0.03    -0.23   0.14   0.02
     6   1     0.00  -0.32   0.18    -0.29  -0.02  -0.03    -0.23   0.14  -0.02
     7   7     0.00   0.00   0.00     0.36   0.00   0.00     0.00  -0.05   0.00
     8   5     0.00   0.00   0.00    -0.48   0.00   0.00     0.00  -0.03   0.00
                      4                      5                      6
                      A                      A                      A
 Frequencies --    638.5019              1069.1679              1069.1812
 Red. masses --      1.0452                 1.3347                 1.3347
 Frc consts  --      0.2511                 0.8989                 0.8989
 IR Inten    --      3.5459                40.5053                40.5097
  Atom  AN      X      Y      Z        X      Y      Z        X      Y      Z
     1   1     0.00   0.00  -0.21    -0.45  -0.07   0.00     0.00   0.00   0.13
     2   1     0.51   0.02  -0.18     0.22  -0.11   0.03    -0.39  -0.03   0.08
     3   1    -0.51  -0.02  -0.18     0.22  -0.11  -0.03     0.39   0.03   0.08
     4   1     0.00   0.00  -0.15     0.63   0.04   0.00     0.00   0.00  -0.17
     5   1    -0.40  -0.02  -0.12    -0.31   0.14   0.06    -0.55  -0.06  -0.07
     6   1     0.40   0.02  -0.12    -0.31   0.14  -0.06     0.54   0.06  -0.07
     7   7     0.00   0.00   0.05     0.00   0.11   0.00     0.00   0.00  -0.11
     8   5     0.00   0.00   0.03     0.00  -0.14   0.00     0.00   0.00   0.14
                      7                      8                      9
                      A                      A                      A
 Frequencies --   1196.1955              1203.5489              1203.5520
 Red. masses --      1.1451                 1.0608                 1.0608
 Frc consts  --      0.9654                 0.9053                 0.9053
 IR Inten    --    108.9554                 3.4677                 3.4688
  Atom  AN      X      Y      Z        X      Y      Z        X      Y      Z
     1   1    -0.02   0.00   0.00     0.00   0.00  -0.02     0.02   0.00   0.00
     2   1    -0.02   0.00   0.00    -0.02   0.01   0.00    -0.01  -0.01   0.01
     3   1    -0.02   0.00   0.00     0.02  -0.01   0.00    -0.01  -0.01  -0.01
     4   1     0.55   0.17   0.00     0.00   0.00   0.75    -0.28  -0.13   0.00
     5   1     0.55  -0.09   0.15    -0.25   0.38   0.09     0.14   0.53   0.38
     6   1     0.55  -0.09  -0.15     0.24  -0.39   0.09     0.14   0.53  -0.38
     7   7    -0.02   0.00   0.00     0.00   0.00  -0.01     0.00  -0.01   0.00
     8   5    -0.11   0.00   0.00     0.00   0.00  -0.07     0.00  -0.07   0.00
                     10                     11                     12
                      A                      A                      A
 Frequencies --   1328.7975              1676.0303              1676.0323
 Red. masses --      1.1792                 1.0555                 1.0555
 Frc consts  --      1.2267                 1.7470                 1.7470
 IR Inten    --    113.6363                27.5645                27.5665
  Atom  AN      X      Y      Z        X      Y      Z        X      Y      Z
     1   1     0.53   0.21   0.00    -0.29  -0.15   0.00     0.00   0.00   0.75
     2   1     0.53  -0.11  -0.18     0.14   0.52  -0.39     0.25  -0.39   0.08
     3   1     0.53  -0.11   0.18     0.14   0.52   0.39    -0.25   0.39   0.07
     4   1     0.00   0.00   0.00     0.01   0.00   0.00     0.00   0.00   0.02
     5   1     0.00   0.00   0.00    -0.01   0.01   0.01     0.01   0.01   0.00
     6   1     0.00   0.00   0.00    -0.01   0.01  -0.01    -0.01  -0.01   0.00
     7   7    -0.11   0.00   0.00     0.00  -0.06   0.00     0.00   0.00  -0.06
     8   5     0.00   0.00   0.00     0.00  -0.01   0.00     0.00   0.00  -0.01
                     13                     14                     15
                      A                      A                      A
 Frequencies --   2471.9601              2532.0452              2532.0771
 Red. masses --      1.0218                 1.1176                 1.1176
 Frc consts  --      3.6788                 4.2217                 4.2218
 IR Inten    --     67.2024               231.2518               231.2416
  Atom  AN      X      Y      Z        X      Y      Z        X      Y      Z
     1   1     0.01   0.00   0.00     0.00   0.00   0.00    -0.01  -0.01   0.00
     2   1     0.01   0.00   0.00     0.00   0.00  -0.01     0.00  -0.01   0.00
     3   1     0.01   0.00   0.00     0.00   0.00  -0.01     0.00  -0.01   0.00
     4   1    -0.15   0.56   0.00     0.00   0.00  -0.01    -0.22   0.78   0.00
     5   1    -0.15  -0.28   0.48    -0.19  -0.35   0.58     0.11   0.18  -0.35
     6   1    -0.15  -0.28  -0.48     0.19   0.35   0.58     0.11   0.18   0.35
     7   7     0.00   0.00   0.00     0.00   0.00   0.00     0.00   0.00   0.00
     8   5     0.04   0.00   0.00     0.00   0.00  -0.10     0.00  -0.10   0.00
                     16                     17                     18
                      A                      A                      A
 Frequencies --   3464.1014              3581.1447              3581.1553
 Red. masses --      1.0270                 1.0921                 1.0921
 Frc consts  --      7.2611                 8.2519                 8.2520
 IR Inten    --      2.5112                27.9567                27.9572
  Atom  AN      X      Y      Z        X      Y      Z        X      Y      Z
     1   1    -0.18   0.55   0.00    -0.28   0.76   0.00     0.00   0.00  -0.02
     2   1    -0.18  -0.27  -0.47     0.14   0.18   0.34     0.25   0.34   0.57
     3   1    -0.18  -0.27   0.47     0.14   0.18  -0.34    -0.25  -0.34   0.57
     4   1     0.00   0.00   0.00     0.00   0.01   0.00     0.00   0.00   0.00
     5   1     0.00   0.00   0.00     0.00   0.00   0.00     0.00   0.00   0.01
     6   1     0.00   0.00   0.00     0.00   0.00   0.00     0.00   0.00   0.01
     7   7     0.04   0.00   0.00     0.00  -0.08   0.00     0.00   0.00  -0.08
     8   5     0.00   0.00   0.00     0.00   0.00   0.00     0.00   0.00   0.00
Item table and optimised parameters:
Item               Value     Threshold  Converged?
 Maximum Force            0.000000     0.000002     YES
 RMS     Force            0.000000     0.000001     YES
 Maximum Displacement     0.000001     0.000006     YES
 RMS     Displacement     0.000000     0.000004     YES
 Predicted change in Energy=-2.213362D-14
 Optimization completed.
    -- Stationary point found.
                           ----------------------------
                           !   Optimized Parameters   !
                           ! (Angstroms and Degrees)  !
 --------------------------                            --------------------------
 ! Name  Definition              Value          Derivative Info.                !
 --------------------------------------------------------------------------------
 ! R1    R(1,7)                  1.0185         -DE/DX =    0.0                 !
 ! R2    R(2,7)                  1.0185         -DE/DX =    0.0                 !
 ! R3    R(3,7)                  1.0185         -DE/DX =    0.0                 !
 ! R4    R(4,8)                  1.2098         -DE/DX =    0.0                 !
 ! R5    R(5,8)                  1.2098         -DE/DX =    0.0                 !
 ! R6    R(6,8)                  1.2098         -DE/DX =    0.0                 !
 ! R7    R(7,8)                  1.6677         -DE/DX =    0.0                 !
 ! A1    A(1,7,2)              107.876          -DE/DX =    0.0                 !
 ! A2    A(1,7,3)              107.876          -DE/DX =    0.0                 !
 ! A3    A(1,7,8)              111.0228         -DE/DX =    0.0                 !
 ! A4    A(2,7,3)              107.8758         -DE/DX =    0.0                 !
 ! A5    A(2,7,8)              111.023          -DE/DX =    0.0                 !
 ! A6    A(3,7,8)              111.023          -DE/DX =    0.0                 !
 ! A7    A(4,8,5)              113.8738         -DE/DX =    0.0                 !
 ! A8    A(4,8,6)              113.8738         -DE/DX =    0.0                 !
 ! A9    A(4,8,7)              104.5974         -DE/DX =    0.0                 !
 ! A10   A(5,8,6)              113.8738         -DE/DX =    0.0                 !
 ! A11   A(5,8,7)              104.5975         -DE/DX =    0.0                 !
 ! A12   A(6,8,7)              104.5975         -DE/DX =    0.0                 !
 ! D1    D(1,7,8,4)           -180.0            -DE/DX =    0.0                 !
 ! D2    D(1,7,8,5)            -60.0            -DE/DX =    0.0                 !
 ! D3    D(1,7,8,6)             60.0            -DE/DX =    0.0                 !
 ! D4    D(2,7,8,4)            -60.0            -DE/DX =    0.0                 !
 ! D5    D(2,7,8,5)             60.0            -DE/DX =    0.0                 !
 ! D6    D(2,7,8,6)           -180.0            -DE/DX =    0.0                 !
 ! D7    D(3,7,8,4)             60.0            -DE/DX =    0.0                 !
 ! D8    D(3,7,8,5)            180.0            -DE/DX =    0.0                 !
 ! D9    D(3,7,8,6)            -60.0            -DE/DX =    0.0                 !
 --------------------------------------------------------------------------------
Calculating the Association Energy
For a given reaction, the reaction energy ΔE = Eproducts - Ereactants. For the formation of ammonia-borane, ΔE = ENH3BH3 - (EBH3 + ENH3) - this is also the B-N bond energy in the molecule seeing as the only change after the reaction is the formation of this bond. In order to ensure the data is reliable all of the molecules need to have been computed using the same basis set and method. These will be the B3LYP method and 6-31G(d,p) basis set. The energies of the molecules in this basis set are:
| molecule | 6-31G(d,p) energy (hartrees) |
|---|---|
| BH3 | -26.61532360 |
| NH3 | -56.55776872 |
| NH3BH3 | -83.22468911 |
ΔE is therefore -83.22468911 - (-26.61532360 + -56.55776872) = -5.15x10⁻² hartrees. 1 hartree = 2625.5 kJ mol-1, so the association energy of ammonia-borane is -135.46 kJ mol-1. The dissociation energy is, as a result, equal to +135.46 kJ mol-1. The experimental value for the bond energy is 31.1 kcal mol-1[5], which is equal to 130.12 kJ mol-1, which shows good agreement with the computed value. The difference of just over 4 kJ mol-1 is likely due to limitations of the basis set or method, but the fact the computed energy was relatively close to the experimental value shows that the optimisations of the three molecules were carried out correctly and the structures obtained correspond well to real structures. There is still room for improvement, however, which could be carried out by using a better method or more accurate basis set. This would require additional computing power, however.
Mini Project
As noted above, trivalent group 13 compounds have only six valence electrons rather than a full octet. This enables them to act as Lewis acids, and in the cases of BH3 or group 13 halides they were capable of forming dimers to complete their octets. In the case of, for example, the dimer of GaBr3, a lone pair on one of the halogens is acting as a Lewis base when the bridge is formed. An interesting case concerns group 13 halides with combinations of different halogen atoms rather than three of the same, because multiple distinct dimer conformers can be formed. This provides a method to determine which bridging halogens are more favourable by studying which isomers are lower in energy and whether changing the positions of the halogens affects the stability of the dimer.
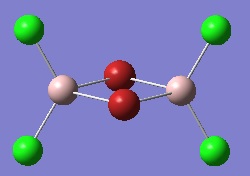
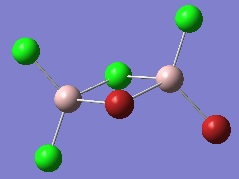
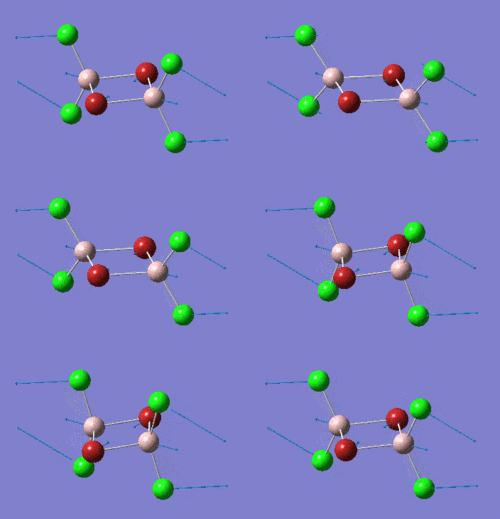
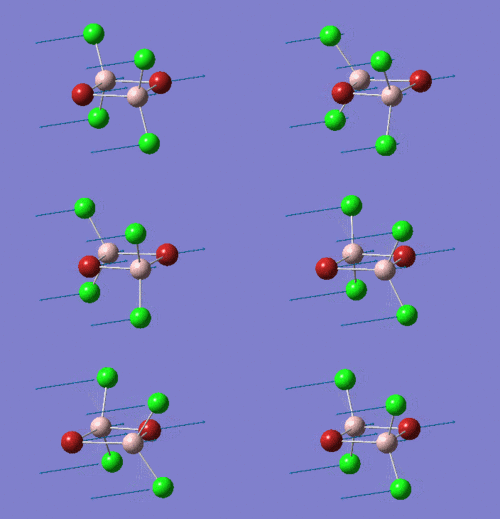
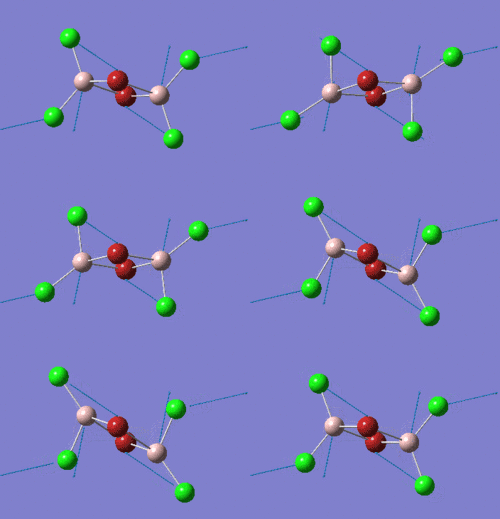
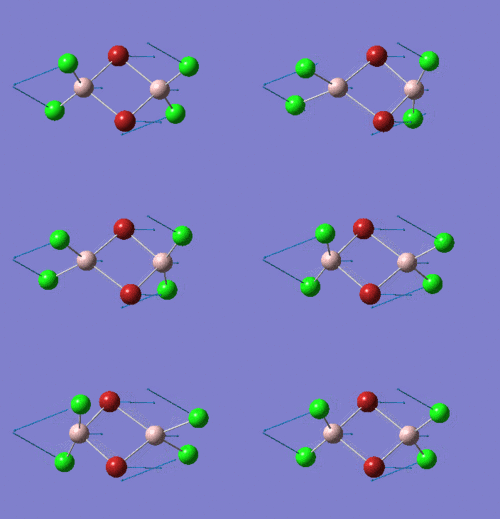
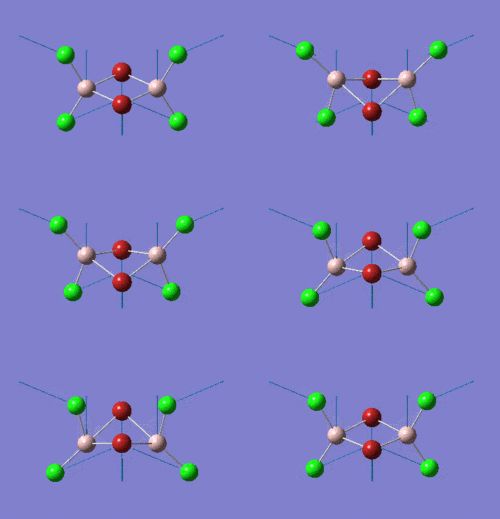
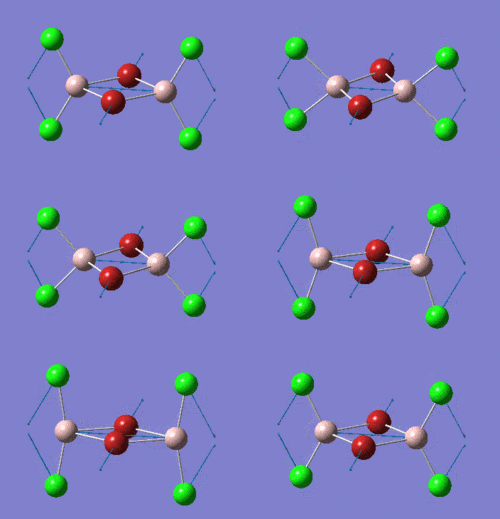
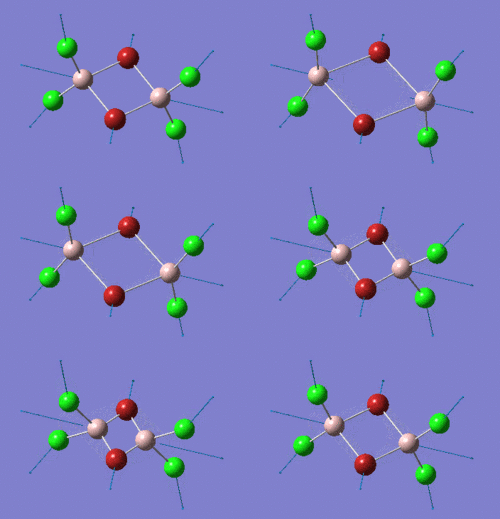
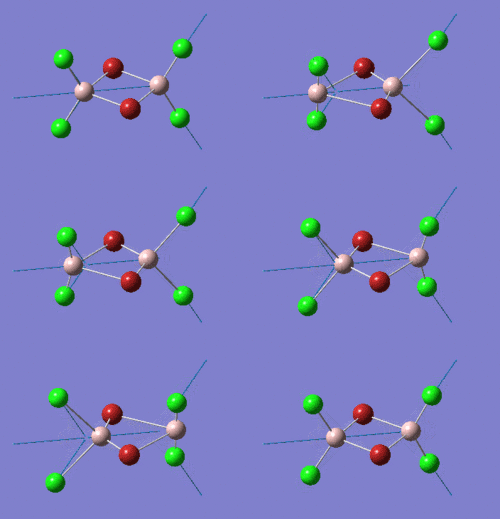
This project will look at AlCl2Br, which has four distinct isomers:
The aim of the project is to determine which of these four isomers is the most stable, and whether it is more stable than two AlCl2Br monomers. It will also look at the differing vibrational frequencies and IR spectra of the isomers and the effect of their different point groups on the spectra and the molecular orbitals of the lowest energy isomer, whichever that is.
Isomer (1)
The optimisation and frequency analysis calculations for isomer (1) were carried out using a mixture of basis sets. Al and Cl were modelled using the 6-31G(d,p) basis set while Br was modelled using LanL2DZ pseudopotentials because of its size. To use this mixture of basis sets the following code was appended to the source file:
Al 0
6-31G(d,p)
****
Cl 0
6-31G(d,p)
****
Br 0
LanL2DZ
****

Br 0
LanL2DZ
Optimisation of Isomer (1)
| File Type | .log |
| Calculation Type | FOPT |
| Calculation Method | RB3LYP |
| Basis Set | Gen |
| Total Energy (hartrees) | -2352.40630798 |
| RMS Gradient Norm (hartrees) | 0.00000187 |
| Dipole Moment (D) | 0.0005 |
| Point Group | C1 |
| Job CPU Time | 8 minutes 8.9 seconds |
| Log File Location | DOI:10042/27159 |
Item table:
         Item               Value     Threshold  Converged?
 Maximum Force            0.000003     0.000450     YES
 RMS     Force            0.000001     0.000300     YES
 Maximum Displacement     0.000040     0.001800     YES
 RMS     Displacement     0.000015     0.001200     YES
 Predicted change in Energy=-2.937160D-10
 Optimization completed.
    -- Stationary point found.
                           ----------------------------
                           !   Optimized Parameters   !
                           ! (Angstroms and Degrees)  !
 --------------------------                            --------------------------
 ! Name  Definition              Value          Derivative Info.                !
 --------------------------------------------------------------------------------
 ! R1    R(1,5)                  2.0934         -DE/DX =    0.0                 !
 ! R2    R(1,6)                  2.0934         -DE/DX =    0.0                 !
 ! R3    R(1,7)                  2.4893         -DE/DX =    0.0                 !
 ! R4    R(1,8)                  2.4893         -DE/DX =    0.0                 !
 ! R5    R(2,3)                  2.0934         -DE/DX =    0.0                 !
 ! R6    R(2,4)                  2.0934         -DE/DX =    0.0                 !
 ! R7    R(2,7)                  2.4893         -DE/DX =    0.0                 !
 ! R8    R(2,8)                  2.4893         -DE/DX =    0.0                 !
 ! A1    A(5,1,6)              121.7568         -DE/DX =    0.0                 !
 ! A2    A(5,1,7)              109.8084         -DE/DX =    0.0                 !
 ! A3    A(5,1,8)              109.8086         -DE/DX =    0.0                 !
 ! A4    A(6,1,7)              109.8096         -DE/DX =    0.0                 !
 ! A5    A(6,1,8)              109.8095         -DE/DX =    0.0                 !
 ! A6    A(7,1,8)               91.7312         -DE/DX =    0.0                 !
 ! A7    A(3,2,4)              121.7568         -DE/DX =    0.0                 !
 ! A8    A(3,2,7)              109.8091         -DE/DX =    0.0                 !
 ! A9    A(3,2,8)              109.8092         -DE/DX =    0.0                 !
 ! A10   A(4,2,7)              109.809          -DE/DX =    0.0                 !
 ! A11   A(4,2,8)              109.8088         -DE/DX =    0.0                 !
 ! A12   A(7,2,8)               91.7311         -DE/DX =    0.0                 !
 ! A13   A(1,7,2)               88.2688         -DE/DX =    0.0                 !
 ! A14   A(1,8,2)               88.2689         -DE/DX =    0.0                 !
 ! D1    D(5,1,7,2)            111.7796         -DE/DX =    0.0                 !
 ! D2    D(6,1,7,2)           -111.8061         -DE/DX =    0.0                 !
 ! D3    D(8,1,7,2)             -0.0127         -DE/DX =    0.0                 !
 ! D4    D(5,1,8,2)           -111.7793         -DE/DX =    0.0                 !
 ! D5    D(6,1,8,2)            111.8062         -DE/DX =    0.0                 !
 ! D6    D(7,1,8,2)              0.0127         -DE/DX =    0.0                 !
 ! D7    D(3,2,7,1)            111.8057         -DE/DX =    0.0                 !
 ! D8    D(4,2,7,1)           -111.7799         -DE/DX =    0.0                 !
 ! D9    D(8,2,7,1)              0.0127         -DE/DX =    0.0                 !
 ! D10   D(3,2,8,1)           -111.8055         -DE/DX =    0.0                 !
 ! D11   D(4,2,8,1)            111.7801         -DE/DX =    0.0                 !
 ! D12   D(7,2,8,1)             -0.0127         -DE/DX =    0.0                 !
 --------------------------------------------------------------------------------
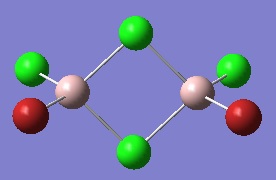
An optimised molecule of isomer (1) is shown below:
Frequency Analysis of Isomer (1)
The molecule was symmetrised and then constrained to its natural point group of D2h before the frequency analysis calculation was run. This is because a change in the point group will change the symmetry labels of molecule's vibrational modes, and hence may affect which ones appear on its computed IR spectrum.
| File Type | .log |
| Calculation Type | FREQ |
| Calculation Method | RB3LYP |
| Basis Set | Gen |
| Total Energy (hartrees) | -2352.40630796 |
| RMS Gradient Norm (hartrees) | 0.00000863 |
| Dipole Moment (D) | 0.0000 |
| Point Group | D2h |
| Job CPU Time | 1 minute 31.3 seconds |
| Log File Location | DOI:10042/27160 |
Low frequencies:
 Low frequencies ---   -5.2734   -5.2027   -3.1007    0.0023    0.0029    0.0042
 Low frequencies ---   14.7679   63.2326   86.0533
The low frequencies are between +15 and -15, so the optimisation was a success.
Item table:
         Item               Value     Threshold  Converged?
 Maximum Force            0.000020     0.000450     YES
 RMS     Force            0.000009     0.000300     YES
 Maximum Displacement     0.000542     0.001800     YES
 RMS     Displacement     0.000278     0.001200     YES
 Predicted change in Energy=-1.903505D-08
 Optimization completed.
    -- Stationary point found.
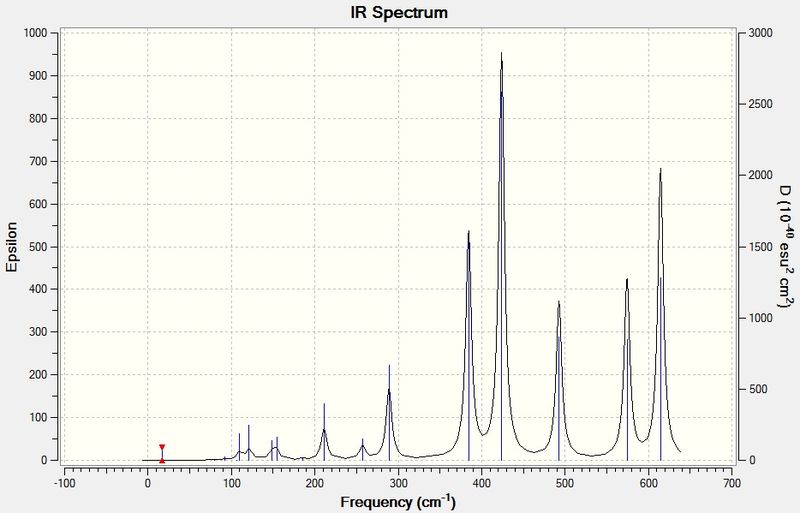
IR spectrum of isomer (1):
Isomer (2)
The isomer (2) has a chiral centre - the R enantiomer was shown in the diagram in the introduction. However, this is largely irrelevent to the project seeing as both enantiomers have the same energy and vibrational frequencies, which are what Gaussian will be calculating in the project. Also, if this dimer is the most favourable, the dimerisation reaction is extremely unlikely to be enantioselective so it will exist as a racemate anyway.
The optimisation and frequency analysis of isomer (2) were also carried out with a mixed basis set where Al and Cl were modelled using the 6-31G(d,p) basis set and Br was modelled using LanL2DZ pseudopotentials. This was achieved in the same was as it was for isomer (1), using the code noted in that section.
Optimisation of Isomer (2)
| File Type | .log |
| Calculation Type | FOPT |
| Calculation Method | RB3LYP |
| Basis Set | Gen |
| Total Energy (au) | -2352.41109939 |
| RMS Gradient Norm (au) | 0.00002424 |
| Dipole Moment (D) | 0.1422 |
| Point Group | C1 |
| Job CPU Time | 5 minutes 9.1 seconds |
| Log File Location | DOI:10042/27161 |
Item table:
         Item               Value     Threshold  Converged?
 Maximum Force            0.000048     0.000450     YES
 RMS     Force            0.000020     0.000300     YES
 Maximum Displacement     0.000874     0.001800     YES
 RMS     Displacement     0.000294     0.001200     YES
 Predicted change in Energy=-5.730232D-08
 Optimization completed.
    -- Stationary point found.
                           ----------------------------
                           !   Optimized Parameters   !
                           ! (Angstroms and Degrees)  !
 --------------------------                            --------------------------
 ! Name  Definition              Value          Derivative Info.                !
 --------------------------------------------------------------------------------
 ! R1    R(1,3)                  2.0929         -DE/DX =    0.0                 !
 ! R2    R(1,4)                  2.093          -DE/DX =    0.0                 !
 ! R3    R(1,5)                  2.4825         -DE/DX =    0.0                 !
 ! R4    R(1,6)                  2.3011         -DE/DX =    0.0                 !
 ! R5    R(2,5)                  2.4866         -DE/DX =    0.0                 !
 ! R6    R(2,6)                  2.3032         -DE/DX =    0.0                 !
 ! R7    R(2,7)                  2.0943         -DE/DX =    0.0                 !
 ! R8    R(2,8)                  2.2758         -DE/DX =    0.0                 !
 ! A1    A(3,1,4)              121.7818         -DE/DX =    0.0                 !
 ! A2    A(3,1,5)              110.185          -DE/DX =    0.0                 !
 ! A3    A(3,1,6)              109.6397         -DE/DX =    0.0                 !
 ! A4    A(4,1,5)              110.1972         -DE/DX =    0.0                 !
 ! A5    A(4,1,6)              109.6668         -DE/DX =    0.0                 !
 ! A6    A(5,1,6)               91.0682         -DE/DX =    0.0                 !
 ! A7    A(5,2,6)               90.9171         -DE/DX =    0.0                 !
 ! A8    A(5,2,7)              109.921          -DE/DX =    0.0                 !
 ! A9    A(5,2,8)              110.7258         -DE/DX =    0.0                 !
 ! A10   A(6,2,7)              109.4614         -DE/DX =    0.0                 !
 ! A11   A(6,2,8)              110.0765         -DE/DX =    0.0                 !
 ! A12   A(7,2,8)              121.485          -DE/DX =    0.0                 !
 ! A13   A(1,5,2)               84.7177         -DE/DX =    0.0                 !
 ! A14   A(1,6,2)               93.2969         -DE/DX =    0.0                 !
 ! D1    D(3,1,5,2)            111.4098         -DE/DX =    0.0                 !
 ! D2    D(4,1,5,2)           -111.4384         -DE/DX =    0.0                 !
 ! D3    D(6,1,5,2)              0.0013         -DE/DX =    0.0                 !
 ! D4    D(3,1,6,2)           -111.9074         -DE/DX =    0.0                 !
 ! D5    D(4,1,6,2)            111.9221         -DE/DX =    0.0                 !
 ! D6    D(5,1,6,2)             -0.0014         -DE/DX =    0.0                 !
 ! D7    D(6,2,5,1)             -0.0013         -DE/DX =    0.0                 !
 ! D8    D(7,2,5,1)            111.1126         -DE/DX =    0.0                 !
 ! D9    D(8,2,5,1)           -111.9101         -DE/DX =    0.0                 !
 ! D10   D(5,2,6,1)              0.0014         -DE/DX =    0.0                 !
 ! D11   D(7,2,6,1)           -111.5339         -DE/DX =    0.0                 !
 ! D12   D(8,2,6,1)            112.5018         -DE/DX =    0.0                 !
 --------------------------------------------------------------------------------
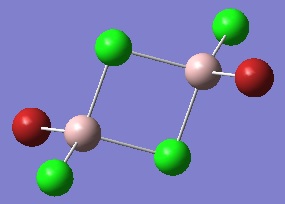
The optimised molecule of isomer (2) is shown here:
Frequency Analysis of Isomer (2)
| File Type | .log |
| Calculation Type | FREQ |
| Calculation Method | RB3LYP |
| Basis Set | Gen |
| Total Energy (hartrees) | -2352.41109939 |
| RMS Gradient Norm (hartrees) | 0.00002425 |
| Dipole Moment (D) | 0.1422 |
| Point Group | C1 |
| Job CPU Time | 3 minutes 30.7 seconds |
| Log File Location | DOI:10042/27162 |
Low frequencies:
 Low frequencies ---   -2.2231    0.0020    0.0020    0.0021    1.5548    3.4529
 Low frequencies ---   17.1614   55.9754   80.0513
The low frequencies are between -15 and +15, which means that the optimisation was a success.
Item table:
         Item               Value     Threshold  Converged?
 Maximum Force            0.000066     0.000450     YES
 RMS     Force            0.000024     0.000300     YES
 Maximum Displacement     0.002136     0.001800     NO
 RMS     Displacement     0.000691     0.001200     YES
 Predicted change in Energy=-9.770574D-08
Not all the values in the item table converge, but the frequency analysis was conducted on the optimised structure of isomer (2) which, as can be seen in the subsection above, had all its values converge so it could find a stationary point. This was a frequency analysis calculation rather than an optimisation calculation and the low frequencies were in a range that suggests a successful optimisation, so this could have been due to a glitch and not be something that affects the validity of the results.
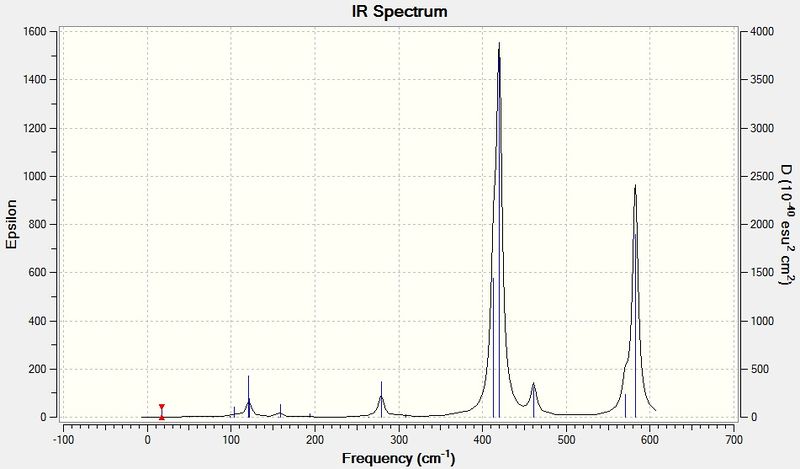
The IR spectrum of isomer (2) is shown below:
Isomer (3)
The optimisation and frequency analysis of isomer (3) were, like for the other isomers, carried out with a mixed basis set where Al and Cl were modelled using the 6-31G(d,p) basis set and Br was modelled using LanL2DZ pseudopotentials. This was achieved by appending the same text as for the other two isomers to the input file.
Optimisation of Isomer (3)
| File Type | .log |
| Calculation Type | FOPT |
| Calculation Method | RB3LYP |
| Basis Set | Gen |
| Total Energy (hartrees) | -2352.41626580 |
| RMS Gradient Norm (hartrees) | 0.00001205 |
| Dipole Moment (D) | 0.1871 |
| Point Group | C2v |
| Job CPU Time | 4 minutes 29 seconds |
| Log File Location | DOI:10042/27211 |
Item table:
         Item               Value     Threshold  Converged?
 Maximum Force            0.000022     0.000450     YES
 RMS     Force            0.000012     0.000300     YES
 Maximum Displacement     0.000824     0.001800     YES
 RMS     Displacement     0.000302     0.001200     YES
 Predicted change in Energy=-2.381734D-08
 Optimization completed.
    -- Stationary point found.
                           ----------------------------
                           !   Optimized Parameters   !
                           ! (Angstroms and Degrees)  !
 --------------------------                            --------------------------
 ! Name  Definition              Value          Derivative Info.                !
 --------------------------------------------------------------------------------
 ! R1    R(1,3)                  2.2981         -DE/DX =    0.0                 !
 ! R2    R(1,4)                  2.2981         -DE/DX =    0.0                 !
 ! R3    R(2,3)                  2.2981         -DE/DX =    0.0                 !
 ! R4    R(2,4)                  2.2981         -DE/DX =    0.0                 !
 ! R5    R(3,5)                  2.0938         -DE/DX =    0.0                 !
 ! R6    R(3,7)                  2.2746         -DE/DX =    0.0                 !
 ! R7    R(4,6)                  2.0938         -DE/DX =    0.0                 !
 ! R8    R(4,8)                  2.2746         -DE/DX =    0.0                 !
 ! A1    A(3,1,4)               89.8543         -DE/DX =    0.0                 !
 ! A2    A(3,2,4)               89.8543         -DE/DX =    0.0                 !
 ! A3    A(1,3,2)               90.1457         -DE/DX =    0.0                 !
 ! A4    A(1,3,5)              109.8654         -DE/DX =    0.0                 !
 ! A5    A(1,3,7)              110.5084         -DE/DX =    0.0                 !
 ! A6    A(2,3,5)              109.8654         -DE/DX =    0.0                 !
 ! A7    A(2,3,7)              110.5084         -DE/DX =    0.0                 !
 ! A8    A(5,3,7)              121.4957         -DE/DX =    0.0                 !
 ! A9    A(1,4,2)               90.1457         -DE/DX =    0.0                 !
 ! A10   A(1,4,6)              109.8654         -DE/DX =    0.0                 !
 ! A11   A(1,4,8)              110.5084         -DE/DX =    0.0                 !
 ! A12   A(2,4,6)              109.8654         -DE/DX =    0.0                 !
 ! A13   A(2,4,8)              110.5084         -DE/DX =    0.0                 !
 ! A14   A(6,4,8)              121.4957         -DE/DX =    0.0                 !
 ! D1    D(4,1,3,2)             -0.0096         -DE/DX =    0.0                 !
 ! D2    D(4,1,3,5)           -111.2469         -DE/DX =    0.0                 !
 ! D3    D(4,1,3,7)            112.0151         -DE/DX =    0.0                 !
 ! D4    D(3,1,4,2)              0.0096         -DE/DX =    0.0                 !
 ! D5    D(3,1,4,6)            111.2469         -DE/DX =    0.0                 !
 ! D6    D(3,1,4,8)           -112.0151         -DE/DX =    0.0                 !
 ! D7    D(4,2,3,1)              0.0096         -DE/DX =    0.0                 !
 ! D8    D(4,2,3,5)            111.2469         -DE/DX =    0.0                 !
 ! D9    D(4,2,3,7)           -112.0151         -DE/DX =    0.0                 !
 ! D10   D(3,2,4,1)             -0.0096         -DE/DX =    0.0                 !
 ! D11   D(3,2,4,6)           -111.2469         -DE/DX =    0.0                 !
 ! D12   D(3,2,4,8)            112.0151         -DE/DX =    0.0                 !
 --------------------------------------------------------------------------------
The optimised molecule of isomer (3) is shown below:
Frequency Analysis of Isomer (3)
| File Type | .log |
| Calculation Type | FREQ |
| Calculation Method | RB3LYP |
| Basis Set | Gen |
| Total Energy (hartrees) | -2352.41626580 |
| RMS Gradient Norm (hartrees) | 0.00001204 |
| Dipole Moment (D) | 0.1871 |
| Point Group | C2v |
| Job CPU Time | 1 minute 41 seconds |
| Log File Location | DOI:10042/27226 |
Low frequencies:
 Low frequencies ---   -4.2128   -2.4700    0.0037    0.0043    0.0044    0.9492
 Low frequencies ---   17.0922   50.8315   78.6212
The low frequencies are between -15 and +15, so the optimisation was successful.
Item table:
         Item               Value     Threshold  Converged?
 Maximum Force            0.000032     0.000450     YES
 RMS     Force            0.000012     0.000300     YES
 Maximum Displacement     0.023725     0.001800     NO
 RMS     Displacement     0.011924     0.001200     NO
 Predicted change in Energy=-1.012253D-06
Like for isomer (2), the item table for the frequency analysis calculation shows a lack of convergence and an inability to find a stationary point. The frequency analysis was conducted on the optimised structure of isomer (3) and the item table for the optimisation calculation above shows convergence of all variables, and the values for the energy and RMS gradient for the optimisation and frequency analysis calculations were also virtually identical. Therefore, it can again be assumed that this is a glitch or quirk of the program rather than a failure of the optimisation.
The IR spectrum of isomer (3) is shown below:
Isomer (4)
Optimisation of Isomer (4)
| File Type | .log |
| Calculation Type | FOPT |
| Calculation Method | RB3LYP |
| Basis Set | Gen |
| Total Energy (hartrees) | -2352.41628814 |
| RMS Gradient Norm (hartrees) | |
| Dipole Moment (D) | 0.00001036 |
| Point Group | C2h |
| Job CPU Time | 6 minutes 33.2 seconds |
| Log File Location | DOI:10042/27201 |
Item table:
         Item               Value     Threshold  Converged?
 Maximum Force            0.000019     0.000450     YES
 RMS     Force            0.000009     0.000300     YES
 Maximum Displacement     0.000580     0.001800     YES
 RMS     Displacement     0.000198     0.001200     YES
 Predicted change in Energy=-3.717060D-09
 Optimization completed.
    -- Stationary point found.
                           ----------------------------
                           !   Optimized Parameters   !
                           ! (Angstroms and Degrees)  !
 --------------------------                            --------------------------
 ! Name  Definition              Value          Derivative Info.                !
 --------------------------------------------------------------------------------
 ! R1    R(1,8)                  2.2746         -DE/DX =    0.0                 !
 ! R2    R(2,7)                  2.2746         -DE/DX =    0.0                 !
 ! R3    R(3,7)                  2.2982         -DE/DX =    0.0                 !
 ! R4    R(3,8)                  2.2982         -DE/DX =    0.0                 !
 ! R5    R(4,7)                  2.2982         -DE/DX =    0.0                 !
 ! R6    R(4,8)                  2.2982         -DE/DX =    0.0                 !
 ! R7    R(5,8)                  2.0938         -DE/DX =    0.0                 !
 ! R8    R(6,7)                  2.0938         -DE/DX =    0.0                 !
 ! A1    A(7,3,8)               89.8539         -DE/DX =    0.0                 !
 ! A2    A(7,4,8)               89.8539         -DE/DX =    0.0                 !
 ! A3    A(2,7,3)              110.5319         -DE/DX =    0.0                 !
 ! A4    A(2,7,4)              110.5319         -DE/DX =    0.0                 !
 ! A5    A(2,7,6)              121.4852         -DE/DX =    0.0                 !
 ! A6    A(3,7,4)               90.1461         -DE/DX =    0.0                 !
 ! A7    A(3,7,6)              109.8485         -DE/DX =    0.0                 !
 ! A8    A(4,7,6)              109.8485         -DE/DX =    0.0                 !
 ! A9    A(1,8,3)              110.5319         -DE/DX =    0.0                 !
 ! A10   A(1,8,4)              110.5319         -DE/DX =    0.0                 !
 ! A11   A(1,8,5)              121.4852         -DE/DX =    0.0                 !
 ! A12   A(3,8,4)               90.1461         -DE/DX =    0.0                 !
 ! A13   A(3,8,5)              109.8485         -DE/DX =    0.0                 !
 ! A14   A(4,8,5)              109.8485         -DE/DX =    0.0                 !
 ! D1    D(8,3,7,2)            112.0538         -DE/DX =    0.0                 !
 ! D2    D(8,3,7,4)              0.0            -DE/DX =    0.0                 !
 ! D3    D(8,3,7,6)           -111.2169         -DE/DX =    0.0                 !
 ! D4    D(7,3,8,1)            112.0538         -DE/DX =    0.0                 !
 ! D5    D(7,3,8,4)              0.0            -DE/DX =    0.0                 !
 ! D6    D(7,3,8,5)           -111.2169         -DE/DX =    0.0                 !
 ! D7    D(8,4,7,2)           -112.0538         -DE/DX =    0.0                 !
 ! D8    D(8,4,7,3)              0.0            -DE/DX =    0.0                 !
 ! D9    D(8,4,7,6)            111.2169         -DE/DX =    0.0                 !
 ! D10   D(7,4,8,1)           -112.0538         -DE/DX =    0.0                 !
 ! D11   D(7,4,8,3)              0.0            -DE/DX =    0.0                 !
 ! D12   D(7,4,8,5)            111.2169         -DE/DX =    0.0                 !
 --------------------------------------------------------------------------------
The optimised molecule of isomer (4) is shown here:
Frequency Analysis of Isomer (4)
| File Type | .log |
| Calculation Type | FREQ |
| Calculation Method | RB3LYP |
| Basis Set | Gen |
| Total Energy (hartrees) | -2352.41628814 |
| RMS Gradient Norm (hartrees) | 0.00001036 |
| Dipole Moment (D) | 0.0000 |
| Point Group | C2h |
| Job CPU Time | 1 minute 48.1 seconds |
| Log File Location | DOI:10042/27202 |
Low frequencies:
 Low frequencies ---   -4.0848   -2.1692   -0.0050   -0.0042   -0.0039    1.2919
 Low frequencies ---   17.7564   48.9703   72.9549
The low frequencies were between -15 and +15, showing that the optimisation was a success.
Item table:
         Item               Value     Threshold  Converged?
 Maximum Force            0.000022     0.000450     YES
 RMS     Force            0.000010     0.000300     YES
 Maximum Displacement     0.000778     0.001800     YES
 RMS     Displacement     0.000291     0.001200     YES
 Predicted change in Energy=-1.891415D-08
 Optimization completed.
    -- Stationary point found.
The IR spectrum of isomer (4) is shown below:
Comparison of Isomers
Energies of Isomers
| Isomer | Energy (hartrees) | Relative energy (hartrees) | Relative energy (kJ mol-1) |
|---|---|---|---|
| (1) | -2352.40630798 | +0.009980 | +26.2 |
| (2) | -2352.41109939 | +0.005189 | +13.6 |
| (3) | -2352.41626580 | +0.000002 | +5.9x10⁻² |
| (4) | -2352.41628814 | 0.000000 | 0.0 |
The lowest energy isomers were (3) and (4), the two with no bridging bromides. Of those two isomers, the one with the two bromides trans to each other proved slightly more stable, though the difference was very small at only about 59 J mol-1. The difference between these two isomers and the other was much more stark, with each bridging chloride providing around 13 kJ mol-1 of stability over the equivalent bridging bromide. While there are no experimental structures to compare this to because AlCl2Br and its dimer have seemingly never been made, the fact that bridging chlorides are more stable than bridging bromides can be found by looking at the dissociation energies of Al2Cl6 and Al2Br6. A computational study by Nori-Shargh et al[6] found that the dissociation energy of Al2Br6 was 4.04 kcal mol-1 (16.9 kJ mol-1) lower than the dissociation energy of Al2Cl6. This indicates that the Al-Br-Al 3c-2e bond is weaker than the Al-Cl-Al 3c-2e bond, so it will be easier to break and isomers with bridging bromides will dissociate more easily.
There are several possible reasons for this observation. One is the size difference between the frontier orbitals of Cl and Br. Al and Cl are both Period 3 elements with 3p orbitals available for bonding whereas Br is a Period 4 element with 4p orbitals that can bond, so the overlap between the orbitals of Al and Cl will be greater than the overlap between the orbitals of Al and Br. Therefore, the Al-Cl bond is stronger and will be favoured when bridging because it is harder to break. The basicity of the halogens increases down the group so Cl is also a stronger base than Br, which will increase its ability to interact with the Lewis acidic Al centre and form a dative bond. Bromine is less able to donate its lone pairs so its interactions with the empty orbital on another monomer will be less and it will require less energy to make the dimer dissociate.
Frequencies and IR Spectra
There are 18 vibrational modes associated with Al2Cl4Br2, because the molecule has 8 atoms and the number of vibrational modes is given by 3N-6. In the table above, these are shown using isomer (1) as an example. For a vibrational mode to be IR active, it is required that it result in a change in dipole moment. Which vibrational modes are associated with dipole moment changes varies with symmetry - only vibrational modes with symmetry labels corresponding to the x, y and z operations will absorb in the IR spectrum. This explains why different sets of bands are seen in each IR spectrum - the isomers have different point groups so the vibrations will have different symmetry labels in each, with the ones corresponding to the x, y and z functions changing in each case. Isomer (2) has the largest number of IR active vibrational modes and hence the largest number of peaks visible in its IR spectrum because it is a very unsymmetrical molecule and its dipole moment is very easy to alter. All of its vibrational modes have A symmetry, like the x, y and z functions, so they all show up on the spectrum with at least some intensity. For isomer (1) (point group D2h) the IR active labels are B1u, B2u and B3u; for isomer (3) (point group C2v) they are A1, B1 and B2; and for isomer (4) (point group C2h) they are Au and Bu.
The modes reorder when the bromine atoms are switched between terminal and bridging positions. This is due to the different force constants of the Al-Br and Al-Cl bonds and the different sizes of the Cl and Br atoms affecting the ease with which the molecule can vibrate in a certain way. The reordering can mostly be seen with the bends in rows 3-6 of the table; the bending modes involving primarily motion of the bridging atoms increase in energy while those that require the terminal halides to move more are lowered in energy. The larger size of Br compared to Cl causes a decrease in the vibrational frequency, so vibrational modes which involve significant motion of Al-Br bonds will be lower in frequencies. This trend continues throughout the vibrational modes. Some reordering is seen between the stretches 12 and 13 when there is one bridging bromide, but the original order is restored in the isomers with no bridging bromides; therefore, the order of these stretches could be greatly affected by the symmetry or asymmetry of the molecule.
Dissociation Energy of Al2Cl4Br2
The energy required to form the dimer can be calculated in the same way that the association energy of ammonia-borane was calculated earlier: by using the equation ΔE = Ereactants - Eproducts. In this case the product is the lowest energy isomer (4), which we have already calculated the energy of, and the reactants are two of the AlCl2Br monomers. The calculations on AlCl2Br were carried out using the same mixed basis set as the calculations on the Al2Cl4Br2 isomers.
Optimisation of AlCl2Br Monomer
| File Type | .log |
| Calculation Type | FOPT |
| Calculation Method | RB3LYP |
| Basis Set | Gen |
| Total Energy (hartrees) | -1176.10913679 |
| RMS Gradient Norm (hartrees) | 0.00004196 |
| Dipole Moment (D) | 0.1075 |
| Point Group | C2v |
| Job CPU Time | 1 minute 7 seconds |
| Log File Location | DOI:10042/27236 |
Item table:
         Item               Value     Threshold  Converged?
 Maximum Force            0.000136     0.000450     YES
 RMS     Force            0.000073     0.000300     YES
 Maximum Displacement     0.000760     0.001800     YES
 RMS     Displacement     0.000497     0.001200     YES
 Predicted change in Energy=-7.984425D-08
 Optimization completed.
    -- Stationary point found.
                           ----------------------------
                           !   Optimized Parameters   !
                           ! (Angstroms and Degrees)  !
 --------------------------                            --------------------------
 ! Name  Definition              Value          Derivative Info.                !
 --------------------------------------------------------------------------------
 ! R1    R(1,2)                  2.2695         -DE/DX =   -0.0001              !
 ! R2    R(1,3)                  2.089          -DE/DX =   -0.0001              !
 ! R3    R(1,4)                  2.089          -DE/DX =   -0.0001              !
 ! A1    A(2,1,3)              120.0823         -DE/DX =   -0.0001              !
 ! A2    A(2,1,4)              120.0823         -DE/DX =   -0.0001              !
 ! A3    A(3,1,4)              119.8353         -DE/DX =    0.0001              !
 ! D1    D(2,1,4,3)            180.0            -DE/DX =    0.0                 !
 --------------------------------------------------------------------------------
Frequency Analysis of AlCl2Br
| File Type | .log |
| Calculation Type | FREQ |
| Calculation Method | RB3LYP |
| Basis Set | Gen |
| Total Energy (hartrees) | -1176.19013679 |
| RMS Gradient Norm (hartrees) | 0.00004194 |
| Dipole Moment (D) | 0.1075 |
| Point Group | C2v |
| Job CPU Time | 39.9 seconds |
| Log File Location | DOI:10042/27237 |
Low frequencies:
 Low frequencies ---   -0.0033   -0.0028    0.0026    1.3569    3.6367    4.2604
 Low frequencies ---  120.5042  133.9178  185.8950
The low frequencies are between -15 and +15, so the optimisation reaction was a success.
Item table:
         Item               Value     Threshold  Converged?
 Maximum Force            0.000081     0.000450     YES
 RMS     Force            0.000042     0.000300     YES
 Maximum Displacement     0.001588     0.001800     YES
 RMS     Displacement     0.000974     0.001200     YES
 Predicted change in Energy=-1.810813D-07
 Optimization completed.
    -- Stationary point found.
Dissociation Energy Calculations and Discussion
Because the energy calculations on the dimer and the monomer were carried out using the same method (B3LYP) and basis set (a mixture of 6-31G(d,p) and LanL2DZ), they can be used to calculate the energy of formation of the dimer and hence its dissociation energy.
| Molecule | Energy (hartrees) |
|---|---|
| Al2Cl4Br2 | -2352.41628814 |
| AlCl2Br | -1176.19013679 |
For the reaction 2AlCl2Br → Al2Cl4Br2, ΔE = EAl2Cl4Br2 - 2EAlCl2Br. Therefore, ΔE = -2352.41628814 - 2(-1176.19013679) = -0.036 hartrees. This is equivalent to -94.55 kJ mol-1, so the dissociation energy of the dimer will therefore be +94.55 kJ mol-1. Comparing this value to the dissociation energies calculated for compounds of the form Al2X6 (where X is a single halide) shows that this value is of the correct order of magnitude, although it seems a little high compared to a calculated dissociation energy for Al2Cl6 of 14.53 kcal mol-1 (60.79 kJ mol-1).[6] The value also shows that, at room temperature, the dimer will be more stable than two monomers because the dissociation energy is many times larger than the value for RT at 298 K, 2.48 kJ mol-1. Forming the dimer allows each Al atom to complete its octet, making it more electronically favourable than the monomer, which only has six valence electrons.
Molecular Orbitals of Al2Cl4Br2
An energy calculation was run on the optimised structure of isomer (4) to determine the molecular orbitals. Only this isomer was analysed because it was the lowest in energy and hence the most stable.
| File Type | .fchk |
| Calculation Type | SP |
| Calculation Method | RB3LYP |
| Basis Set | Gen |
| Total Energy (hartrees) | -2352.41628814 |
| RMS Gradient Norm (hartrees) | 0.00000000 |
| Dipole Moment (D) | 0.0000 |
| Log File Location | DOI:10042/27262 |
Individual MOs of the Al2Cl4Br2molecule are visualised below. The energies are relative to the bonding/antibonding borderline, which is defined as 0.0000, and the numbers of the MOs do not take into account 28 core MOs not visualised by Gaussian because they were too low in energy.
The axial alignment for the MOs are as follows: 
MO 37
The energy of this MO is -0.51123. Structural features are listed below:
- Overall, the central ring has the phase characteristics of a p orbital, with a node along the xy plane.
- The areas of bonding between the Al atoms and bridging Cl atoms are due to interactions of the 3px orbitals of bridging Cl with in phase 3s orbitals of Al.
- The p orbitals of terminal halides are also involved, adding to the bonding interaction and creating areas of opposite charge on the terminal halides themselves and nodes in the centre of the Al-Halterminal bonds.
- The p orbitals of the terminal halides are in phase, creating more bonding through space interactions between them. These are weak but further stabilise the MO.
- Overall, this is a very highly bonding MO with a lot of bonding interactions spread over the molecule and virtually no antibonding character to counteract this.
MO 40
The energy of this MO is -0.43350. The structural features of this MO are as follows:
- There is a nodal plane in the xy plane of the molecule.
- Either side of this nodal plane are bonding interactions resulting from constructive addition of Al and bridging Cl p orbitals.
- p orbitals on terminal halogens also contribute to this, resulting in nodes along the Al-Halterminal bonds and areas of opposite charge on the terminal halogens themselves.
- The terminal halogens alternate phase heading around the molecule resulting in minor antibonding interactions between them; this pushes the atoms apart.
- Overall, this is a heavily bonding MO, because the in phase bonding interactions in the centre of the molecule are far stronger than the through-space interactions between the terminal halogens.
MO 42
The energy of this MO is -0.41231. Key structural features are listed below:
- The terminal halides do not contribute to this MO at all; it is bonding with respect to Al and bridging Cl only.
- The electron density between the two atoms closely resembles a π bonding orbital in a C=C bond and is caused by constructive overlap of the 3py orbitals of Al and bridging Cl.
- There are three nodal planes in the xy plane; one is in the plane of Al and the terminal halides and the other two are on the level of the two bridging Cl atoms.
- The opposite phase lobes above and below the π cloud come from the lobes of the Cl 3py not involved in the п interaction.
- Overall, the MO is bonding with respect to the bridging ring with no real antibonding interactions, but non-bonding with respect to the terminal halides. It is therefore only a relatively bonding MO.
MO 54
The energy of this MO is -0.31846. This is the HOMO of the molecule. Key structural features are noted below:
- The orbitals of Al do not participate in forming this MO at all, so there are nodes at the Al atoms. This MO is only made from the p orbitals of Cl and Br and the size of the Br orbitals indicates they contribute more.
- The p orbitals of the bridging Cl atoms are in phase so there is a through space bonding interaction between them, helping to hold the molecule together.
- However, the bridging Cl p orbitals are out of phase with the large Br p orbitals, resulting in a relatively strong antibonding interaction.
- On the near and far sides of the molecules there are bonding interactions between in phase Br and Cl orbitals, but this is weakened because of the distance between them.
- At the sides of the molecule there are, however, out of phase antibonding interactions between closer Cl and Br p orbitals, which destabilise the orbital.
- Overall, the molecule is relatively non-bonding because it contains both bonding and antibonding interactions that are strong for through space interactions, resulting in them cancelling and the MO becoming non-bonding overall.
MO 60
The energy of this MO is +0.2802. Key structural features are listed below:
- The large size of the p orbitals on Al show that they contribute more to this MO than the p orbitals of the halides.
- The Al orbitals are out of phase with both the py orbitals of the terminal halides and the px orbitals of the bridging halides, creating a large number of strong antibonding interactions.
- The p orbitals on the pairs of terminal halides on each end are in phase but very little bonding interaction is seen because of the large lobe of the Al p orbitals.
- A large node is seen in the centre of the Al-Cl ring, while smaller nodes are seen on each Al-Hal bond.
- Overall, this MO is very antibonding due to the large number of out of phase interactions and small number of effective bonding interactions.
Conclusion
Computational studies provide a useful counterpoint to spectroscopy and physical measurements because they allow us to compute the properties of molecules that we cannot make for whatever reason Al2Cl4Br2 is one of those molecules and this project allowed us to find out what configuration this molecule would prefer to take and compare its dissociation energy with similar compounds that we can make, as well as looking at how the configuration of the dimer affects its IR spectrum. This was potentially not entirely successful as while the most stable isomer fits with theory the dissociation energy did not match the trend - more calculations will be needed to test this. A logical extension of the project would be to look at other mixed aluminium halides and compare their stabilities to Al2Cl4Br2 and to the compounds of the form Al2X6 that can be made and tested experimentally.
References
<references> [1] [2] [3] [7] [5] [6]
- ↑ 1.0 1.1 1.2 K. Kawaguchi, J. Chem. Phys., 1992, 96, 3411–3415. DOI:10.1063/1.461942
- ↑ 2.0 2.1 B. Réffy, M. Kolonits, and M. Hargittai, J. Mol. Struct., 1998, 445, 139–148. DOI:10.1016/S0022-2860(97)00420-1
- ↑ 3.0 3.1 3.2 3.3 P. Atkins, T. Overton, J. Rourke, M. Weller, and F. Armstrong, Shriver & Atkins’ Inorganic Chemistry, Oxford University Press, Oxford, 5th edn., 2010. Table 1.7, page 30.
- ↑ Cite error: Invalid
<ref>tag; no text was provided for refs namedlow frequency - ↑ 5.0 5.1 Y. Mo, L. Song, W. Wu, and Q. Zhang, J. Am. Chem. Soc., 2004, 126, 3974–82.
- ↑ 6.0 6.1 6.2 D. Nori-Shargh, H. Yahyaei, S. N. Mousavi, A. Maasoomi, and H. Kayi, J. Mol. Model., 2013, 19, 2549–57. DOI:10.1007/s00894-013-1805-0
- ↑ J. Ochterski, Gaussian.com, 1999, 1–10. URL: http://www.gaussian.com/g_whitepap/vib/vib.pdf [accessed 30 Jan 2014]

