Rep:Mod:ECJ1C5911
Experiment 1C Part 1: Conformational Analysis and Spectroscopic Simulation
Optimisation of Dicyclopentadiene Isomers
Cyclopentadiene in its pure form is capable of forming a dimer through a Diels-Alder reaction, in which different cyclopentadiene molecules act as the diene and dienophile. This reaction can result in the formation of endo- and exo- isomers as a result of the new fused ring system; of these, the endo- isomer is formed preferentially. The energies of the two isomers have been computed below, using the MMFF94(s) force field in the program Avogadro, in order to determine which isomer is more thermodynamically stable and hence whether the dimerisation reaction is under kinetic or thermodynamic control. The results are as follows:
| Exo- isomer | Endo- isomer | |||||||
|---|---|---|---|---|---|---|---|---|
| Optimised structure of isomer |
|
| ||||||
| Bond stretching energy (kcal mol-1) | 3.54826 | 3.46691 | ||||||
| Angle bending energy (kcal mol-1) | 30.77821 | 33.19326 | ||||||
| Torsion energy (kcal mol-1) | -2.73093 | -2.94943 | ||||||
| Van der Waals energy (kcal mol-1) | 12.80141 | 12.35991 | ||||||
| Electrostatic interactions (kcal mol-1) | 13.01371 | 14.18408 | ||||||
| Total energy (kcal mol-1) | 55.37346 | 58.19073 |
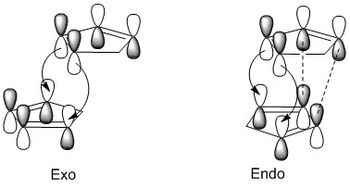
From the total energies of the isomers calculated by Avogadro, it is clear that the exo- isomer is the more thermodynamically stable, with an energy difference of 2.817 kcal mol-1. We can therefore assume that, since the endo- isomer is the primary product of the dimerisation reaction, the reaction must be under kinetic rather than thermodynamic control, with the energy of the transition state the factor most affecting the reaction's product. The transition state for the formation of the endo- isomer is more favourable because of secondary interactions between the frontier molecular orbitals of cyclopentadiene. These are shown below:
The main MO interaction in the Diels-Alder reaction of two molecular orbitals is between the π5 orbital (the LUMO of the one acting as the diene) and the π3 orbital (the HOMO of the one acting as a dienophile). The transition states formed by the interactions of these two orbitals are shown below:
The interactions that result in new bonds being formed are shown with curly arrows. These are the same in both transition states. However, the transition state leading to the endo- isomer contains addition secondary bonding interactions, shown in the diagram as dashed lines. They do not result in new bonds being formed but stabilise the endo- transition state, lowering the energy barrier compared to the barrier leading to the exo- isomer. This means that the endo- isomer will be formed first under normal conditions, making it the kinetic product and the primary product of the dimerisation reaction despite its lower thermodynamic stability.
Regioselectivity of Dicyclopentadiene Hydrogenation
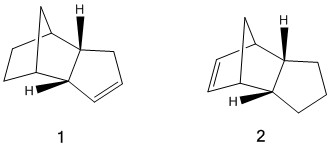
Dicyclopentadiene contains two double bonds, which leads to regioselectivity considerations when the molecule is hydrogenated because one of the double bonds will be hydrogenated preferentially. Therefore, stopping the reaction after a relatively short time will result in the formation of one of two dihydrogenated derivatives of dicyclopentadiene. These are shown below:
The energies of the isomers can be computed and compared in order to predict which regioisomer will be more stable, and will therefore be the primary dihydrogenation product. The results are shown below. The energies were computed using the MMFF94(s) force field in Avogadro, in the same way as for the endo- and exo- isomers of dicyclopentadiene, and the results are summarised in the table below:
| Isomer 1 | Isomer 2 | |||||||
|---|---|---|---|---|---|---|---|---|
| Optimised structure of isomer |
|
| ||||||
| Bond stretching energy (kcal mol-1) | 2.82305 | 3.30807 | ||||||
| Angle bending energy (kcal mol-1) | 24.68552 | 30.86608 | ||||||
| Torsion energy (kcal mol-1) | -0.37813 | 0.05867 | ||||||
| Van der Waals energy (kcal mol-1) | 10.63691 | 13.28024 | ||||||
| Electrostatic interactions (kcal mol-1) | 5.14702 | 5.12103 | ||||||
| Total energy (kcal mol-1) | 41.25749 | 50.72286 |
The molecular mechanics calculations clearly show that isomer 1 is the more stable of the two regioisomers. This corresponds to what is observed when dicyclopentadiene is hydrogenated with a Pd/C catalyst[1], which shows that the calculations and their results are reliable. When either double bond is hydrogenated it results in a reduction in the bond length and angle strain in the molecule - the values calculated for both of those contributions to the overall energy were lower for both dihydrogenated derivatives than for dicyclopentadiene itself. However, the strain was reduced more for isomer 1, which is one of the factors leading to its stability compared to isomer 2. This is because the double bond hydrogenated to form isomer 1 is located in a norbornene functional group; norbornenes contain large amounts of angle strain in their double bonds due to the large difference from the 120° bond angle that an sp2 carbon prefers, so hydrogentaing this bond will result in a large increase in the stability of the molecule as the carbons will obtain sp3 hybridisation and a preferred bond angle of 109.5°. By contrast, the double bond whose hydrogenation results in isomer 2 is only part of a cyclopentene ring. While there is still some strain in the ring, the cyclopentene bond angle is closer to 120° than the norbornene bond angle so the reduction in angle strain energy is less when the carbons gain sp3 hybridisation.
Taxol Intermediate Atropisomerism
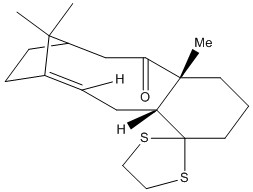
The drug paclitaxel, sold as Taxol, is used in the treatment of various cancers. It can be found as a natural product in the bark of the Pacific yew tree, but this tree has near-threatened status so harvesting the drug is therefore not plausible on a large scale. Instead, methods have been developed for the total synthesis of the drug in the lab; an intermediate from one of these synthetic methods is shown below, in its two isomeric forms:
The isomerism in this molecule comes from the trans-cyclononene ring present in the structure, which allows it to exhibit atropisomerism. Medium rings containing trans-alkenes can exist in two conformations which are non-superimposable mirror images of each other, with interconversion between the two restricted because of an energy barrier representing extremely strained conformations in the transition state[2]. In the molecule above, the two isomers are easily distinguishable because, as can be seen in the picture, one has the carbonyl pointing "up" with respect to the rest of the molecule while the other features the carbonyl pointing "down". The intermediate is synthesised as one isomer and then converts to the other, more stable conformation; the aim of the following calculations was to determine which isomer is the more thermodynamically stable of the two, and hence which is the initial and which is the final product. The calculations were carried out in Avogadro using the MMFF94(s) force field, and the results are shown in the table below:
| Up isomer | Down isomer | |||||||
|---|---|---|---|---|---|---|---|---|
| Optimised structure of isomer |
|
| ||||||
| Bond stretching energy (kcal mol-1) | 8.00040 | 7.73061 | ||||||
| Angle bending energy (kcal mol-1) | 30.12899 | 19.61140 | ||||||
| Torsion energy (kcal mol-1) | 2.77835 | 3.12294 | ||||||
| Van der Waals energy (kcal mol-1) | 35.77502 | 35.16414 | ||||||
| Electrostatic interactions (kcal mol-1) | 0.28653 | -0.04548 | ||||||
| Total energy (kcal mol-1) | 77.90785 | 66.37211 |
From these results, it can be clearly seen that the down isomer is the more stable of the two, and that the most significant factor in the increased stability of this isomer is the release of angle strain; this accounts for the majority of the 11.6 kcal mol-1 energy difference. Looking at the conformations of the two cyclononene rings provides more evidence for this - the ring with the carbonyl pointing down is in a structure possible analogous to the chair conformation of cyclohexane, whereas the ring with the carbonyl pointing up is far closer to the boat conformation. The ring interconverts far slower than free cyclononene[3]; one reason for this is increased stability associated with a trisubstituted alkene in a bicyclic system. A study of compounds containing similarly substituted cyclononene rings found they provided additional stability compared to saturated cyclononane rings[4], which explains the relatively low reactivity of the ring despite the small isomer energy gap and quick interconversion of unsubstituted trans-cyclononene. The fused ring system could also provide a steric reason for slow interconversion, by limiting the ability of the ring to rotate.
However, the structures shown above are not the conformational minima of the Taxol intermediate's isomers. This can be seen by looking at the fused cyclohexane rings: in both isomers, the cyclohexane rings can be seen to be in the twist boat conformation rather than the lowest energy chair conformation. Because of this, further structural optimisations (also in Avogadro using the MMFF94(s) force field) was carried out. They produced the following structures and energies:
| Up isomer | Down isomer | |||||||
|---|---|---|---|---|---|---|---|---|
| Optimised structure of isomer |
|
| ||||||
| Bond stretching energy (kcal mol-1) | 7.69164 | 7.57537 | ||||||
| Angle bending energy (kcal mol-1) | 28.29094 | 18.83603 | ||||||
| Torsion energy (kcal mol-1) | 0.16174 | 0.17552 | ||||||
| Van der Waals energy (kcal mol-1) | 33.18726 | 33.31772 | ||||||
| Electrostatic interactions (kcal mol-1) | 0.29625 | -0.05773 | ||||||
| Total energy (kcal mol-1) | 70.54136 | 60.55905 |
This lowered the energy, and hence increased the stability, of both isomers. A lot of this manifested in a reduction in torsional strain to the point where it is virtually non-existent, because chair cyclohexane is able to accommodate bond angles close to the ideal value for sp3 carbons of 109.5°. The more favourable bond angles also account for the reduction in angle strain seen in both isomers. The energy difference was also reduced from 11.6 to 10 kcal mol-1, indicating that the change to chair cyclohexane also relieves strain in the cyclononene ring when the carbonyl is pointing up.
Spectroscopic Analysis of Taxol Derivative
A major potential use of computational methods in organic chemistry is to calculate theoretical spectra in order to help with the assignment of an experimental spectrum or see if the observed peaks come from the desired molecule or from something else entirely. This is especially useful for techniques like IR and NMR spectra where many potentially useful peaks occur in the same few spectral regions; a computed spectrum gives a better guide as to where exactly the peaks should be, which is useful to avoid confusion with other very similar peaks. For this experiment, the 1H and 13C NMR spectra of a derivative of the more stable atropisomer of the Taxol intermediate shown above will be calculated and compared to spectral data reported in the literature by Paquette et al[5]. The molecule is shown in full below:
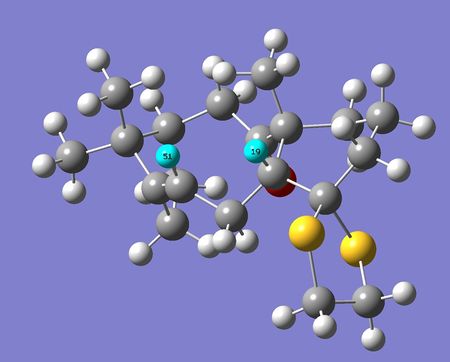
The NMR spectra of this molecule were simulated with Gaussian, using the B3LYP method and 6-31(d,p) basis set. The solvent used for the simulated spectra was d6-benzene, as this was the solvent used for the NMR spectra reported in Paquette et al[5]. The results from this calculation are located at DOI:10042/28047 , and the structure of the optimised molecule is shown below:
Taxol Derivative (for NMR) |
The molecule's structure was derived from the twist-boat form of the down isomer of the Taxol intermediate in the previous section.
1H NMR Spectrum
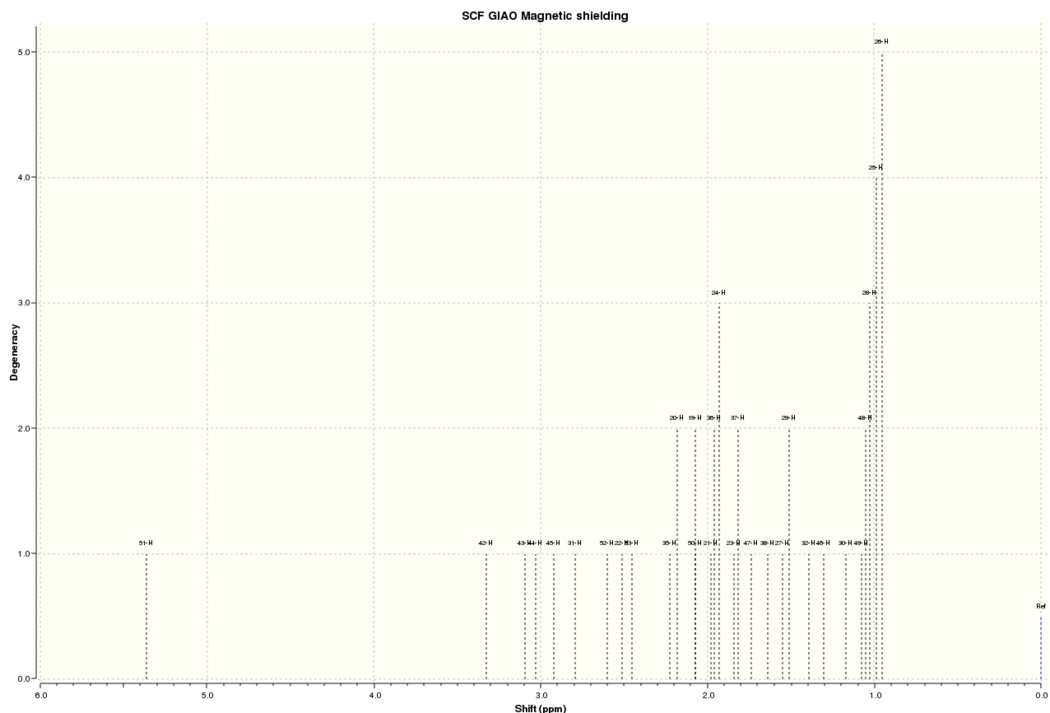
The 1H NMR spectrum of the Taxol derivative is shown below:
This spectrum contains many significant differences from the NMR data reported by Paquette. One of the major reasons for this is the conformation of the molecule used to calculate the spectrum may be different to the one exhibited by the molecule in real life. This can be most easily seen by looking at the easiest protons to assign using the literature data such as the single alkene proton, which appears at just over 5 ppm. Paquette reported the chemical shift of this proton as 5.21 ppm, where as Gaussian calculated the chemical shift as 5.36 ppm. Another good marker proton is the proton reported to appear at 1.58 ppm in the literature, as it is the only proton with a reported multiplicity and coupling constant, which marks it out as the only proton with two protons in the same environment within three bonds. This is labelled 19 on the image below; the alkene proton is labelled 51:
Proton 19 has a calculated chemical shift of 2.07 ppm; even further from the literature value than that for proton 51. The differences come from the conformational effects on the molecule's rings. Proton 19 is on the molecule's cyclohexane ring as well as the cyclononene, and the cyclohexane is in the twist-boat conformation. This conformation is an energy minimum but is significantly higher in energy than the chair form, so it is likely that only an extremely small percentage of this conformation exists in real life. Hence, this chemical shift provides very little contribution to the real chemical shift. Another possible reason for the large difference is the proximity of the two sulphur atoms. These exhibit spin-orbit coupling which is not modelled well by Gaussian; this is discussed further in the analysis of the 13C NMR below. Proton 51 is closer to the experimental chemical shift because the cyclononene ring is closer to its energetic minimum than the cyclohexane ring; there are a limited number of stable conformations containing a trans- double bond. Therefore, the calculated cyclononene conformation is seen in real life and contributes significantly to the experimental chemical shift.
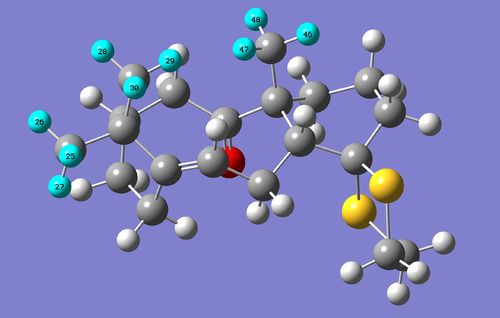
More differences come from the fact that Gaussian calculates the spectrum based on an entirely static molecule with atoms fixed securely in position. In a real NMR spectrum run at room temperature this is not the case because the atoms in the molecule have thermal energy and hence can move from their fixed positions. An easy way to look at the differences is to consider the three singlets at 1.03, 1.07 and 1.10 ppm in the literature, which represent the three methyl groups in the molecule. At room temperature the methyl groups can rotate so the chemical shift seen is an average of the three protons, but because Gaussian considers a static molecule it considers the three protons inequivalent because they are in subtly different environments. The methyl protons are labelled in the image below:
The chemical shifts of each proton and averages for each methyl group, with comparisons to the literature chemical shifts, are as follows:
| Carbon Number | Chemical Shift | Methyl Group Average | Literature Chemical Shift |
|---|---|---|---|
| 46 | 1.30 | 1.36 | 1.10 |
| 47 | 1.74 | ||
| 48 | 1.05 | ||
| 25 | 0.99 | 1.16 | 1.03 |
| 26 | 0.95 | ||
| 27 | 1.55 | ||
| 28 | 1.03 | 1.23 | 1.07 |
| 29 | 1.51 | ||
| 30 | 1.17 |
The methyl groups also showed differences between calculated and experimental values due to differing conformations. This is seen most obviously with the methyl group on the cyclohexane ring for the same reason proton 19 was far from its literature value - the cyclohexane ring is further from its defined energy minimum than the other rings in the molecule. For the other methyl groups the difference was less significant, but it still indicates clearly the need for further conformational optimisation to achieve an NMR spectrum that matches the literature values.
13C NMR Spectrum
The 13C NMR spectrum of the Taxol derivative is shown below:
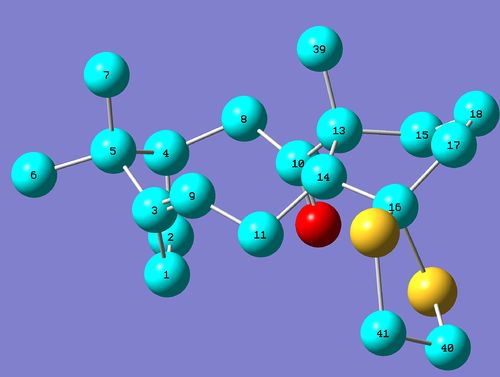
The 13C NMR spectrum calculated by Gaussian shows reasonable agreement with the data reported in the literature, and it is far easier to compare because every carbon is in a unique environment even when molecular motions are taken into account. These environments are shown in the following image (H atoms have been removed to make it easier to see the environments):
The calculated and reported chemical shifts are compared and assigned to different carbon environments in the following table:
| Calculated Chemical shift (ppm) | Literature Chemical Shift (ppm) | Carbon Assignment |
|---|---|---|
| 211.01 | 211.49 | 10 |
| 148.57 | 148.72 | 3 |
| 118.62 | 120.90 | 9 |
| 88.68 | 74.61 | 16 |
| 67.55 | 60.53 | 14 |
| 56.07 | 51.30 | 13 |
| 55.40 | 50.94 | 4 |
| 49.92 | 45.53 | 5 |
| 46.59 | 43.28 | 40 |
| 44.29 | 40.82 | 41 |
| 41.24 | 38.73 | 17 |
| 37.45 | 36.78 | 8 |
| 36.16 | 35.47 | 15 |
| 31.99 | 30.84 | 11 |
| 29.09 | 30.00 | 39 |
| 28.62 | 25.56 | 1 |
| 25.85 | 25.35 | 6 |
| 25.11 | 22.21 | 2 |
| 23.28 | 21.39 | 7 |
| 21.70 | 19.83 | 18 |
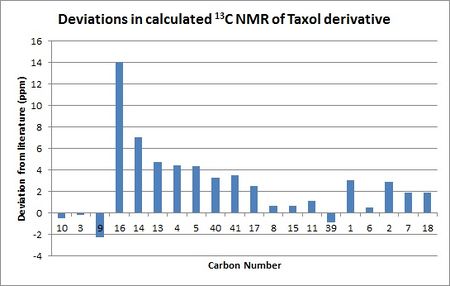
Unlike in the 1H NMR spectrum, it was relatively easy to assign the 13C environments and hence determine exactly how far from the literature values they were. This is plotted graphically below:
As with the 1H spectrum, many of the differences between the calculated and experimentally obtained chemical shifts are the result of differences between the conformation of the molecule submitted to Gaussian and the conformation of the real molecule. This can be especially clearly seen because the two carbons with the smallest differences between the experimental and calculated values were the methyl carbons 6 and 39, both of which had differences of less than 1 ppm, while the ring bridging carbons 4, 13 and 14 had differences of 5-7 ppm. The carbons only on the cyclononene ring, such as 8, 9, 10 and 11 also showed smaller deviations from the literature values than the carbons on the fused cyclopentane and cyclohexane rings, which provides more evidence that out of all of the rings the cyclononene ring is closest to its lowest energy conformation (i.e. the one seen in real life).
The carbon with by far the largest difference between the calculated value and Paquette's value was the thioacetal carbon, numbered 16. Whereas most of the chemical shifts were within about 5 ppm, this carbon was 14 ppm away from the experimental value; this is far too large to be due to conformational effects alone, so carbon 16 can be considered a special case. This is because of limitations of the 6-31G(d,p) basis set when it comes to modelling atoms of the second row and below, such as sulphur. The 6-31G(d,p) basis set models the orbitals of individual atoms using individual basis functions which works well with small atoms (i.e. hydrogen or a first row atom like carbon) but provide a less accurate view of larger atoms as the number of basis functions required gets larger and the orbital interactions, particularly spin-orbit coupling, become more complex. The result is that Gaussian's model for sulphur atoms is less accurate and this causes carbon 16, which is adjacent to two sulphur atoms, to have a significantly different chemical shift to the real value. The effect of different basis sets on simulated nuclear shielding has been quantified[6]; 6-31G(d,p) was found to be worse at modelling nuclear shielding generally than other basis sets, with the differences more pronounced for larger atoms. However, it is still a useful set to use because it provides relatively accurate results without taking too long. The calculation of the NMR spectra using the 6-31G(d,p) basis set took almost four hours and with a more accurate basis set the computational time would increase significantly, which could provide significant time constraints on the experiment generally. Hence, 6-31G(d,p) is a better choice from a time management perspective.
Summary of NMR Results
The two NMR spectra together show the significant effect of a molecule's conformation on its chemical shift, for both 1H and 13C spectra, and highlights the fact that a molecule can exist in many conformations with its properties an average of all of these. For this particular molecule it is clear that the conformer used in the NMR calculations is not a particularly accurate representation of the molecule's real structure. The best ways to go about improving the accuracy of the NMR simulation would be to carry it out for every conformer that is an energy minimum and use a more accurate basis set, but as each NMR simulation takes almost four hours using the 6-31G(d,p) basis set this is not be possible due to time constraints on the project. A good suggestion for further work would be to calculate the NMR spectra of all the conformers, in order to try and work out the relative contributions of each to Paquette's NMR data and hence the relative population of each conformer in real life.
Experiment 1C Part 2: Analysis of Synthesised Epoxide Properties
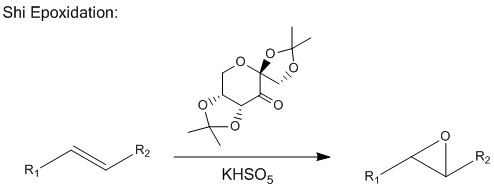
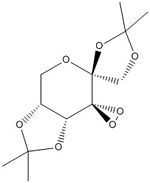
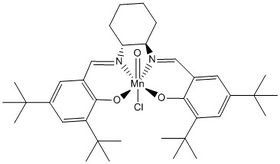
This section of the report will be using computational methods to assess the quality of experimental data for an asymmetric epoxidation experiment. Two catalysts were used: the Shi catalyst, a chiral ketone derived from D-Fructose, and the Jacobsen catalyst, a manganese complex containing a chiral salen ligand. Their structures are shown below:
To compare the enantioselectivity of each catalyst two different alkene substrates were used: trans-stilbene and 1,2-dihydronaphthalene, which is constrained to a cis- conformation by its location in a ring. Each alkene was epoxidised by both substrates according to the following reaction schemes:
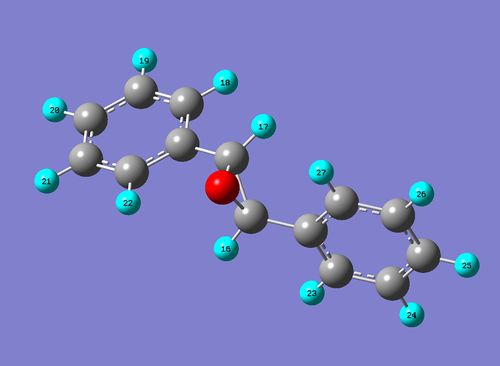
The four possible epoxide enantiomers are shown below:
| (R,R)-stilbene oxide | (S,S)-stilbene oxide | (S,R)-1,2-dihydronaphthalene | (R,S)-1,2-dihydronaphthalene | ||||||||||||
|---|---|---|---|---|---|---|---|---|---|---|---|---|---|---|---|
|
|
|
|
The aim of the experiment is to compute key properties of the catalysts, epoxides and reaction transition states with the aim of confirming the identities of the synthesised epoxides and identifying and rationalising the stereoselectivity of the epoxidation reactions, particularly in terms of the catalyst structures and transition states. This section encompasses a wide variety of computational techniques, including the geometry optimisation and NMR simulation shown above, searching crystal databases and electron density calculations.
Catalyst Crystal Structures
One of the factors leading to the selectivity of the two epoxidation catalysts are structural features designed to create specific interactions. Structural control is very significant in asymmetric catalysis because it allows control of the number of configurations in which the catalyst and substrate can interact. Different enantiomers of a chiral product will require the substrate to take different geometries in order for them to form; therefore, controlling the possible reaction geometries leads to control of the stereochemistry of the products. The Shi and Jacobsen catalysts both have different structural features that allow them to control the stereochemistry of the product epoxides. These are outlined below:
Shi Catalyst
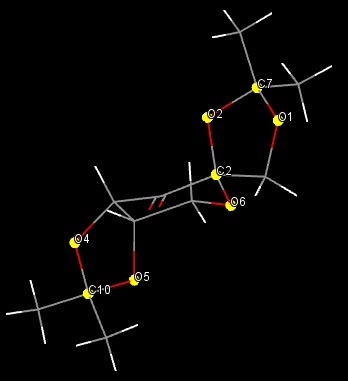
The main interesting structural features of the Shi catalyst come from anomeric effects that come from its O-C-O substructures. As well as the well known anomeric effect associated with carbohydrate rings such as the one in fructose, this can also be seen in the Shi catalyst's acetal groups. Carbon and oxygen atoms capable of displaying anomeric effects are shown on the image below:
The C-O bond lengths are shown in the table below:
| Bond | Bond length (Å) |
|---|---|
| C7-O1 | 1.413 |
| C7-O2 | 1.441 |
| C2-O2 | 1.403 |
| C2-O6 | 1.403 |
| C10-O4 | 1.439 |
| C10-O5 | 1.409 |
The bond lengths show that the acetal groups are asymmetric, with one C-O bond length longer than the other. This causes the acetal groups to twist, with the lower (C10) acetal twisting into the plane of the carbohydrate ring and the upper (C7) ring twisting away from it. This helps control the catalyst's selectivity by limiting the conformations that the reacting alkene can take and causing stabilising or destabilising intermolecular interactions. An anomeric effect from the ring oxygen also acts to stabilise this particular conformation of the ring, with the acetal axial. These observations are corroborated by a study conducted by Shi et al, which found that the Shi catalyst had higher enantioselectivity than other similar ketones because of its structural features[9]
Jacobsen Catalyst
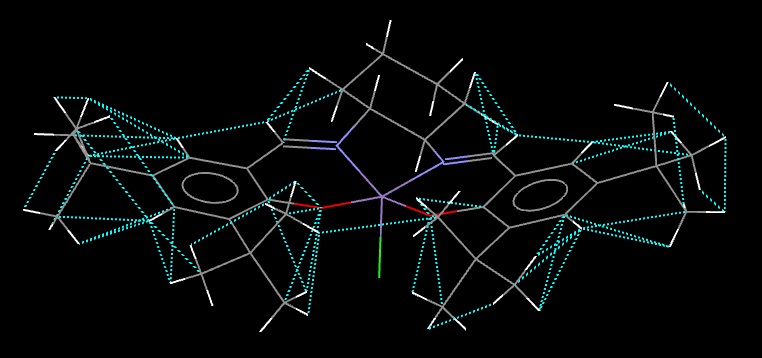
The Jacobsen catalyst's primary means of stereocontrol are the bulky t-butyl groups substituted on the two aromatic rings, which were introduced by Jacobsen to limit the number of viable approaches for an alkene coming in to react with the catalyst[10]. To illustrate this, the crystal structure of the Jacobsen catalyst is shown below with intramolecular short contact Van der Waals interactions highlighted:
The methyl groups in the four t-butyl groups are capable of many Van der Waals interactions with each other and with other atoms in the catalyst, especially nearby hydrogen atoms. These interactions help to stabilise the catalyst and would be interrupted by an approaching alkene, resulting in an unfavourable steric clash. This encourages alkenes to approach from behind, aligned with the cyclohexane ring - there are far fewer short contacts in this region of the molecule. The cyclohexane ring itself provides further stereocontrol through the two chiral centres it contains. These are directly bonded to the imine nitrogen atoms which are constrained to planar geometry, so the stereochemistry of these carbons defines which chair form the cyclohexane ring takes. This further influences the approach of the alkene and is the reason why the two isomers of the catalyst produce opposite isomers of epoxides.
NMR Spectra of Epoxides
The main method used to test the purity of the synthesised epoxides was NMR spectroscopy. As shown above, NMR spectra can be calculated and compared to experimental or literature values to aid with fully assigning the peaks and confirming a molecule's identity. Simulated 1H and 13C spectra were calculated for one isomer of each epoxide; chirality has no effect on chemical shift without the use of paramagnetic chiral shift reagents like Eu(hfc)3, but these require a lot of computational power and were not used in the experiment or literature so are being ignored.
Stilbene Oxide NMR
The enantiomer used for this calculation was the (R,R) enantiomer. The geometry was optimised using the MMFF94(s) force field in Avogadro and tthe NMR spectrum was then simulated using the B3LYP method and 6-31G(d,p) basis set. The results are located at DOI:10042/28117 . Because the 1H NMR spectra of the two synthesised stilbene oxide samples were heavily contaminated with various solvents and unreacted stilbene and no 13C spectrum could be run at all, a literature source[11] is used for comparison instead.
The 1H NMR spectrum is shown below:
The 1H environments are labelled below; after this, their chemical shifts are summarised in a table:
| Number of H | H environments | Calculated Chemical Shift (ppm) | Literature Chemical Shift (ppm)[11] |
|---|---|---|---|
| 2 | 16,17 | 3.54 | 3.88 |
| 8 | 18-20,22-25,27 | 7.47 | 7.15-7.40 |
| 2 | 21,26 | 7.57 |
Significant differences are seen between the literature NMR peaks and the calculated 1H chemical shifts. As with the Taxol derivative, this is likely due to conformational effects. The phenyl rings are able to freely rotate which would affect their electronic environments and especially those of the epoxide protons. Rotation of the phenyl rings results in differing alignments of the π cloud with respect to the protons; it is likely that this interaction is less in the calculated conformation than the real conformation, explaining why the epoxide protons have a chemical shift 0.34 ppm lower. It may also explain why the aromatic protons have chemical shifts roughly the same amount higher, indicating more deshielding.
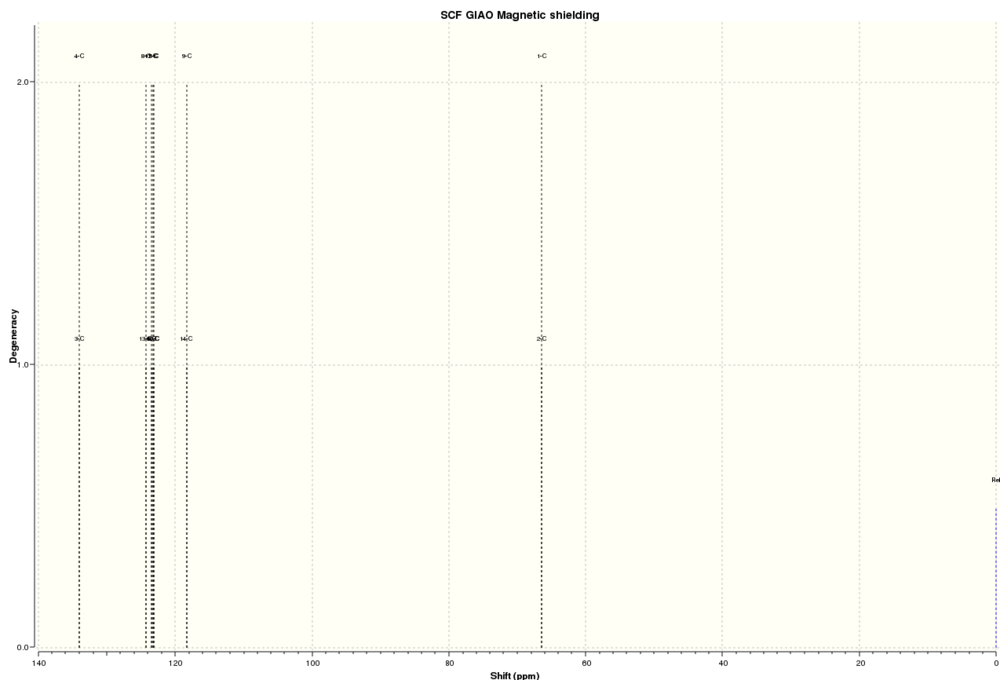
The 13C NMR spectrum is shown below:
The 13C environments are shown below and assigned in the table below that:
| Number of C | C environments | Calculated Chemical Shift (ppm) | Literature Chemical Shift[11] |
|---|---|---|---|
| 2 | 3,4 | 134.09 | 137.3 |
| 2 | 8,13 | 124.22 | 135.7 |
| 2 | 6,11 | 123.52 | 128.8 |
| 2 | 7,12 | 123.21 | |
| 2 | 5,10 | 123.08 | |
| 2 | 9,14 | 118.26 | 128.5 |
| 2 | 1,2 | 66.43 | 63.00 |
The calculated 13C chemical shifts differed very significantly from the values in the literature, to the point where it is very difficult to assign them to the same carbon atoms; the assignments above are only an estimate. This points to very significant conformational differences, which is strange considering nothing this dramatic was seen in the 1H NMR. In that, while differences were seen, the protons were still easy enough to identify and assign. A useful experiment would be to repeat the calculation with different conformations of the aromatic rings and see if the carbon chemical shifts, particularly in the aromatic region, match the literature data more closely. Unfortunately, however, time constraints do not allow this to be attempted in this report.
1,2-Dihydronaphthalene Oxide NMR
The enantiomer used for this calculation was the (R,S) enantiomer. It was simulated using the B3LYP method and 6-31G(d,p) basis set. The results are located at DOI:10042/28122 . Like for stilbene oxide, the 1H NMR spectra of the synthesised epoxides were heavily contaminated and no 13C spectra could be run, so the results were compared to a literature source[12].
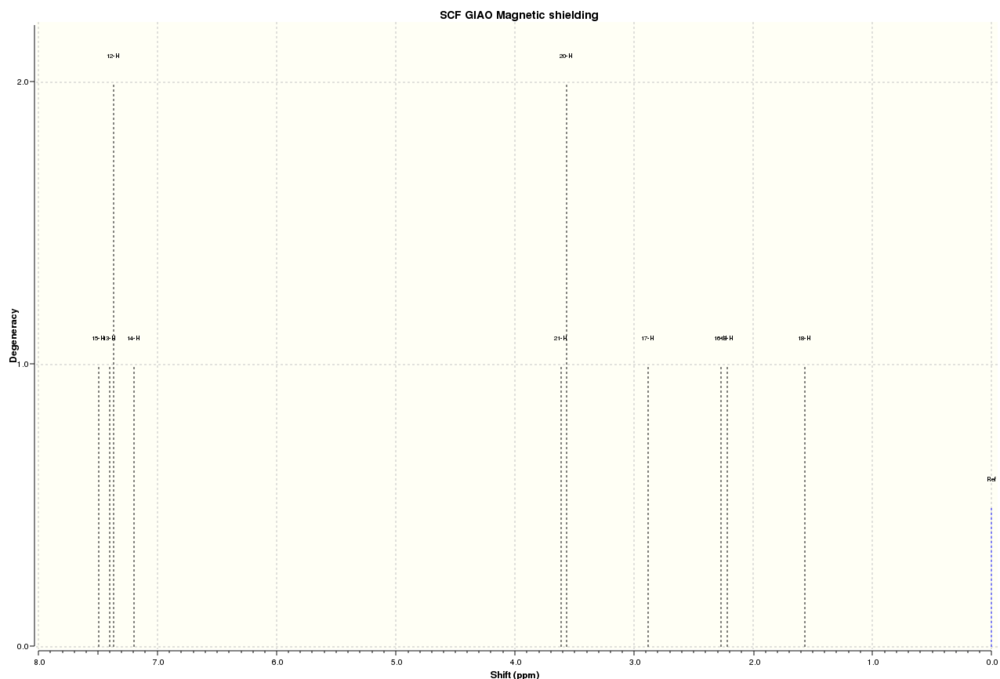
The 1H NMR is shown below:
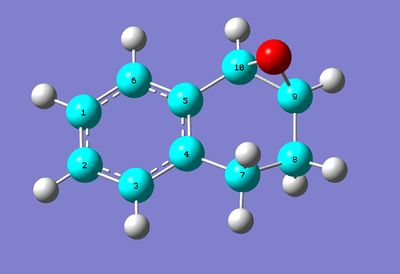
The 1H environments are shown below and are assigned in the table below that:
| Number of H | H Environments | Calculated Chemical Shift (ppm) | Literature Chemical Shift (ppm)[12] |
|---|---|---|---|
| 1 | 15 | 7.49 | 7.00-7.34 |
| 2 | 12,13 | 7.38 | |
| 1 | 14 | 7.19 | |
| 1 | 20 | 3.58 | 3.65 |
| 1 | 21 | 3.77 | |
| 1 | 17 | 2.88 | 2.70 |
| 1 | 16 | 2.26 | 2.48 |
| 1 | 19 | 2.22 | 2.33 |
| 1 | 18 | 1.56 | 1.69 |
The calculated chemical shifts and real NMR data show some significant differences. The most obvious of these is that Gaussian considers the two epoxide protons to be equivalent, whereas in the real data they show different chemical shifts. This is almost certainly the result of conformational effects in the cyclohexane ring, as if it twisted closer to a chair form the two protons would be inequivalent. This effect could also be the reason for deviations in the other cyclohexane ring protons. The aromatic protons in the simulated spectrum have higher chemical shifts, indicating more deshielding. It is possible that the different conformation of the cyclohexane ring has consequences for the aromatic ring too, resulting in minor disruption of the π cloud and hence lower deshielding.
The 13C NMR spectrum is shown below:
The 13C environments are shown below and assigned in the table below that:
| C Environment | Calculated Chemical Shift (ppm) | Literature Chemical Shift (ppm)[12] |
|---|---|---|
| 4 | 133.84 | 136.7 |
| 5 | 130.38 | 132.6 |
| 6 | 125.55 | 129.6 |
| 3 | 123.83 | 128.5 |
| 2 | 123.43 | 128.4 |
| 1 | 121.44 | 126.2 |
| 9 | 56.43 | 55.2 |
| 10 | 54.83 | 52.8 |
| 7 | 28.04 | 24.4 |
| 8 | 24.95 | 21.8 |
Like the 13C NMR spectrum of the Taxol derivative, every peak in this spectrum could be assigned explicitly to one carbon environment. Therefore, as for that spectrum, the deviations of the calculated chemical shifts from the literature chemical shifts have been plotted graphically. This is shown below:
The calculated 13C chemical shifts were consistently out from the literature values by 2-5 ppm. Like in the 1H spectrum, the predicted chemical shifts for the aromatic part of the molecule are too high and the chemical shifts for the aliphatic part are too low. This is probably a result of the same conformational effects, with the conformation of the cyclohexane ring wrong and this having effects on the aromatic ring's ring current. In reality, the ring current seems to be slightly disrupted, causing the carbon atoms of the benzene ring to be less deshielded than the calculation predicts.
Optical Rotation Calculations
One of the major drawbacks of NMR spectroscopy in asymmetric synthesis is that it cannot be used to assign the absolute configuration of an epoxide without the use of chiral shift reagents. A technique that can do this instead is measuring the molecule's optical rotation. A chiral molecule causes plane polarised light to rotate with a characteristic angle; however, the sign of this rotation will be different for each enantiomer of the product. Whether the optical rotation has a + or - sign therefore allows the absolute stereochemistry of the molecule to be determined. This can also be calculated, which has the advantage of giving the optical rotation for an entirely enantiomerically pure molecule; a very difficult feat to accomplish in the lab. Comparing the calculated value to an experimental or literature value can give an idea of a synthesised molecule's enantiomeric purity. This was done for the two isomers of the synthesised epoxides. All optical rotation calculations were run using the CAM-B3LYP method and 6-311++G(2df,p) basis set.
(R,S)-1,2-Dihydronaphthalene Oxide
The source file used for this calculation was the output of the 1,2-dihydronaphthalene oxide file above. The calculation was run using chloroform as a simulated solvent. The results of the optical rotation calculation are located at DOI:10042/28144 .
The calculation gave a value for [α]D of +155°. The optical rotation of this isomer of 1,2-didhydronaphthalene oxide in chloroform has been reported in the literature as +133°[13]; the calculation proves the literature assignment of the epoxide's stereochemistry correct because the calculated and reported optical rotations had the same sign. The lower value of the rotation could be a reflection of the synthesised epoxide not being entirely enantiomerically pure (this information was not given in the paper) as optical rotatory power decreases with decreasing enantiomeric excess; the calculated optical rotation is for a 100% enantiomerically pure isomer.
(S,R)-1,2-Dihydronaphthalene Oxide
Before the optical rotation calculation was run, the geometry of the epoxide was optimised in Avogadro using the MMFF94(s) force field and in Gaussian using the B3LYP method and 6-31G(d,p) basis set. The results of this calculation are located at DOI:10042/28178 . The optical rotation was calculated using chloroform as a simulated solvent; the results for this calculation are located at DOI:10042/28183 .
The calculated value for [α]D was -153.8°; the literature value in chloroform was -144.9°[14]. The absolute value is in good agreement with the other isomer, which proves that two enantiomeric products with the same conformation were calculated and the optical rotations are reliable. The literature value for this isomer was closer to the calculated value and it had a stated enantiomeric excess of 98%. A 2% difference in enantiomeric excess seems too low to account for a 9° difference in optical rotation, so it is likely that there are some conformational effects affecting it. This is probably due to the fact that while the cyclohexane ring is to some extent conformationally locked due to the fused benzene ring, it can still take many different conformations.
(R,R)-Stilbene Oxide
The source file used for this calculation was the output of the stilbene oxide NMR calculation above. The simulated solvent used in this calculation was benzene. The results are located at DOI:10042/28177 .
The calculated value for [α]D was 304°, compared to am literature value in benzene of 310° for a sample of (R,R)-stilbene oxide with 98% enantiomeric excess[11]. The difference between the two values is not a function of enantiomeric excess as the calculated value was lower than the literature value which had 98% ee; instead, it is likely due to differences in the conformations of the aromatic rings. Like many techniques optical rotation is sensitive to conformation, and as an aromatic ring contains a cloud of delocalised π electrons capable of absorbing light it seems likely that the conformation of a phenyl ring will have quite a large effect on optical rotatory power. Hence, the optical rotation was lower than the literature value when it would have been expected to be higher, though they are still in relatively good agreement, which shows the literature optical rotation is reliable.
(S,S)-Stilbene Oxide
Before the optical rotation calculation was run, (S,S)-stilbene oxide was optimised in Avogadro using the MMFF94(s) force field and in Gaussian using the 6-31G(d,p) basis set. The results from that calculation are located at DOI:10042/28179 . The simulated solvent for the optical rotation calculation was benzene and the results from the calculation are located at DOI:10042/28191 .
The calculated value of [α]D was -270.5°. In the literature, the optical rotation of this isomer in benzene has been reported as -358°[7]. This is also the result of benzene ring conformational effects. As can be seen from the 3D models of the isomers earlier in the report, the aromatic rings of this isomer are not in an equivalent conformation to the rings in the (R,R) isomer, and these differing conformations lead to the very significant differences in the absolute values of their optical rotations. The increased distance from the literature value also implies that this conformation is further from the conformation exhibited by stilbene oxide in real life than the (R,R) isomer's conformation.
Transition State Comparisons
Another useful way of predicting and rationalising the stereoselectivity of the catalytic asymmetric epoxidation reactions is to look at the transition states. Generally when a chemical reaction has multiple potential products the distribution is controlled either kinetically, with the reaction following the path with the lowest energy transition state, or thermodynamically, with the reaction proceeding to the lowest energy product. Thermodynamic control does not apply here because the products of the asymmetric epoxidation reactions are different enantiomers of chiral epoxides, which by definition have the same energy. Therefore if one enantiomer is favoured it must be due to kinetic reasons, and looking at the energies of the transition states leading to the different enantiomers provides a good way of explaining the stereochemical outcomes.
Because of the large numbers of atoms in the transition states, the calculations take an extremely long time - up to five days in some cases. We were therefore provided with the outputs of the calculations (run by Prof. Henry Rzepa) for analysis, because it would not have been possible to calculate the energies of all of the transition states in the time allocated for this experiment.
Shi Catalyst Transition States
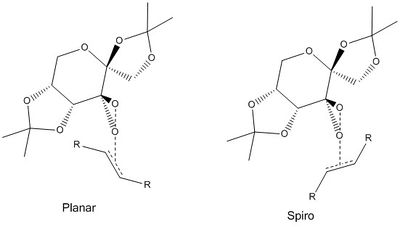
The Shi epoxidation has been shown to proceed via a dioxirane intermediate[7]. This is shown below:
The dioxirane can attack aligned to the alkene double bond, or from the side; these are denoted planar and spiro transition states respectively. These are shown below:
For each of these transition states two orientations of the alkene are possible, leading to eight possible transition states per alkene; four of which lead to each of the two possible enantiomeric epoxides. The energies (corrected for zero-point and thermal energy) of the different transition states for the Shi epoxidation of stilbene are shown below, with the lowest energy transition state leading to each isomer in bold:
| Transition state | (R,R) isomer energy (hartrees) | (S,S) isomer energy (hartrees) |
|---|---|---|
| Planar 1 | -1534.687808 | -1534.683440 |
| Planar 2 | -1534.687252 | -1534.693818 |
| Spiro 1 | -1534.700037 | -1534.685089 |
| Spiro 2 | -1534.699901 | -1534.691858 |
The most stable transition states leading to each enantiomer are shown below:
| (R,R)-stilbene oxide | (S,S)-stilbene oxide | ||||||
|---|---|---|---|---|---|---|---|
|
|
The energy difference between these two transition states is -0.00622 hartrees. One hartree = 2625.5 kJ mol-1, so the free energy difference ΔG = -16.328 kJ mol-1. The equilibrium between the two isomers can be found using the equation ; for this equilibrium K = 725.6. This can be expressed as an enantiomeric excess using the equation ; for the Shi epoxidation of stilbene, the enantiomeric excess is therefore 99.7% in favour of the (R,R) isomer.
The corrected transition state energies for the Shi epoxidation of 1,2-dihydronaphthalene are shown below, again with the lowest energy transition states in bold:
| Transition state | (S,R) isomer energy (hartrees) | (R,S) isomer energy (hartrees) |
|---|---|---|
| Planar 1 | -1381.131343 | -1381.120782 |
| Planar 2 | -1381.116109 | -1381.125886 |
| Spiro 1 | -1381.136239 | -1381.134059 |
| Spiro 2 | -1381.126039 | -1381.126722 |
The most stable transition states leading to each enantiomer are shown below:
| (S,R)-1,2-dihydronaphthalene oxide | (R,S)-1,2-dihydronaphthalene oxide | ||||||
|---|---|---|---|---|---|---|---|
|
|
Using the same method as for the stilbene epoxidation above, we can find that ΔG = -5.723 kJ mol-1, K = 10.06 and ee = 81.9%, in favour of the (S,R) isomer.
The energies for both alkenes show that spiro transition states are generally lower in energy than planar. This corresponds with the prediction made by Shi et al when they developed the catalyst[7]. This is likely mainly for steric reasons, as especially for stilbene some planar approaches result in steric clashes between the acetal groups on the catalyst and the phenyl rings; conversely, the most stable planar transition states are the ones with the smallest amount of steric hindrance. The reasons for the increased stability of the spiro transition states, and also the most stable planar transition state for stilbene, come from non-covalent intermolecular interactions; these are discussed later in the report.
The favoured isomers of each epoxide from the transition state analysis match Shi's experiments, but the enantiomeric excesses calculated from the transition state energies are both quite high compared to the experimental enantiomeric excesses reported by Shi of 98.9% for the epoxidation of stilbene and 32% for the epoxidation of 1,2-dihydronaphthalene[7]. This is probably because of effects not accounted for by the calculation, such as transition state solvation. Shi's experiments found that the enantiomeric excesses of epoxides produced were affected significantly by the reaction solvent; it is possible that solvent interactions stabilise the transition states leading to (S,S)-stilbene oxide and (R,S)-1,2-dihydronaphthalene oxide, meaning they are thermally accessible at lower temperatures. The dramatic effect of this for the epoxidation of 1,2-dihydronaphthalene comes from the exponential dependence of K on ΔG - as a result of this, a small change in ΔG can induce a large change in K, and hence a large change in the enantiomeric excess. However, despite these limitations, the calculations here show the right isomer and explain Shi's observation that reactions at lower temperatures give better enantiomeric excesses.
Jacobsen Catalyst Transition States
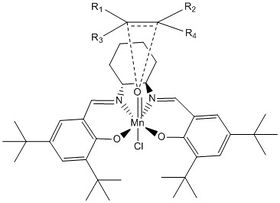
The Jacobsen epoxidation of an alkene proceeds via the following Mn(V) intermediate, formed by the reaction of the catalyst and the hypochlorite ion:
The additional oxygen atom is the one that adds to form the epoxide; the exact mechanism of this addition is disputed, with the concerted formation of two C-O bonds, a radical intermediate and a four membered ring intermediate suggested as possibilities[15]. For the purposes of this discussion, the proposed four membered ring is ignored. The alignment of the alkene with respect to the oxygen atom is responsible for the stereochemistry of the product epoxide; this is shown in the image below, where R1 - R4 are the substituents on the alkene double bond:
For the epoxidation of stilbene, only two transition states are possible because of its rotational symmetry. For the less symmetrical 1,2-dihydronaphthalene four can be seen.The two stilbene transition states are shown, with their corresponding energies, below:
| (S,S)-stilbene oxide | (R,R)-stilbene oxide | |||||||
|---|---|---|---|---|---|---|---|---|
| Transition State Structure |
|
| ||||||
| Energy (hartrees) | -3574.923087 | -3574.921174 |
The energy gap, equilibrium constant and enantiomeric excess were calculated in the same way as for the Shi epoxidations. For this pair of transition states ΔG =-5.02258 kJ mol-1, K =7.585 and ee = 76.7% in favour of the (S,S) isomer.
The energies of the transition states for the epoxidation of 1,2-dihydronaphthalene are shown below, with the lower energy transition states leading to each isomer shown in bold:
| (S,R) isomer energy (hartrees) | (R,S) isomer energy (hartrees) | |
|---|---|---|
| Transition State 1 | -3421.369033 | -3421.359354 |
| Transition State 2 | -3421.36158 | -3421.359499 |
The two lowest energy transition states are shown below:
| (S,R)-1,2-dihydronaphthalene oxide | (R,S)-1,2-dihydronaphthalene oxide | ||||||
|---|---|---|---|---|---|---|---|
|
|
For this pair of transition states, ΔG =-25.0315 kJ mol-1, K = 24298.31 and ee = 99.99% in favour of the (S,R) isomer.
From the position of the oxygen in the transition state, we can imply some information about the nature of the mechanism. In every transition state the oxygen atom attached to the manganese centre is closer to one of the carbon atoms in the double bond than the other, which implies that instead of a concerted mechanism the oxygen attacks one carbon atom first to form a radical intermediate, with the second C-O bond formed slightly later. However, this calculation has several flaws, which can be seen by looking at the predicted enantiomeric excesses. The calculation predicts an enantiomeric excess of 99.99% for the epoxidation of 1,2-dihydronaphthalene whereas in reality enantiomeric excesses are closer to 85%[8], and the enantiomeric excesses of trans- alkenes are known to be generally bad substrates for this catalyst[10], certainly nowhere near 77%. One reason for this is the absence of solvent effects from the calculations; like for the Shi epoxidations, this could work to stabilise the transition states with higher calculated energies. However, a far greater problem is that two of the t-butyl groups on the Jacobsen catalyst are missing from the calculated transition states. Linker proposes that the substituents on the aromatic rings play a significant role in determining the reaction's selectivity[15], so leaving some substituents off could lead to significant differences between the real and simulated reactions and make the results of the simulation invalid when predicting the Jacobsen catalyst's stereoselectivity.
Further Analysis of Transition State
The stability of transition states, and hence the stereoselectivity of the catalysts with different alkene substrates, can be explained in terms of non-bonded interactions occurring in the transition state. These can be calculated in a variety of different ways, including through the calculation of a cube surface and through a QTAIM analysis of the electronic topology. Because of time constraints only one transition state could be analysed using these techniques; this was the most stable transition state for the Shi epoxidation of stilbene, which leads to the (R,R) enantiomer of stilbene oxide.
NCI Analysis
An image of the non-covalent interactions in the transition state is shown below. The cube surface was created in GaussView from the .fchk file provided for this transition state and it was converted into the surface displayed here using this applet.
NCI analysis of stilbene and Shi catalyst transition state |
The energy surface shows the presence of several key features that stabilise this transition state and, by extension, other spiro transition states, and therefore help lead to the very high stereoselectivity seen in the Shi epoxidation of stilbene. The most prominent of these are interactions between O atoms on the Shi catalyst and H atoms on stilbene. There is a relatively strong non-covalent interaction between the acetal oxygen closest to the stilbene molecule and an adjacent aromatic proton; it could be considered analogous to a hydrogen bond except with an aromatic system instead of an electronegative atom. Another, less strongly attractive, non-covalent interaction can be seen between another acetal oxygen and a para-H on the other benzene ring, whereas another interacts with the other para-H and one of the alkene protons. Van der Waals interactions stabilising the transition state are also seen, particularly between the methyl groups in the acetal and the benzene rings. A final interaction is seen between the dioxirane oxygen remaining to regenerate the carbonyl and an adjacent methyl proton, which serves to stabilise the regeneration of the Shi catalyst.
QTAIM Electronic Topology Analysis
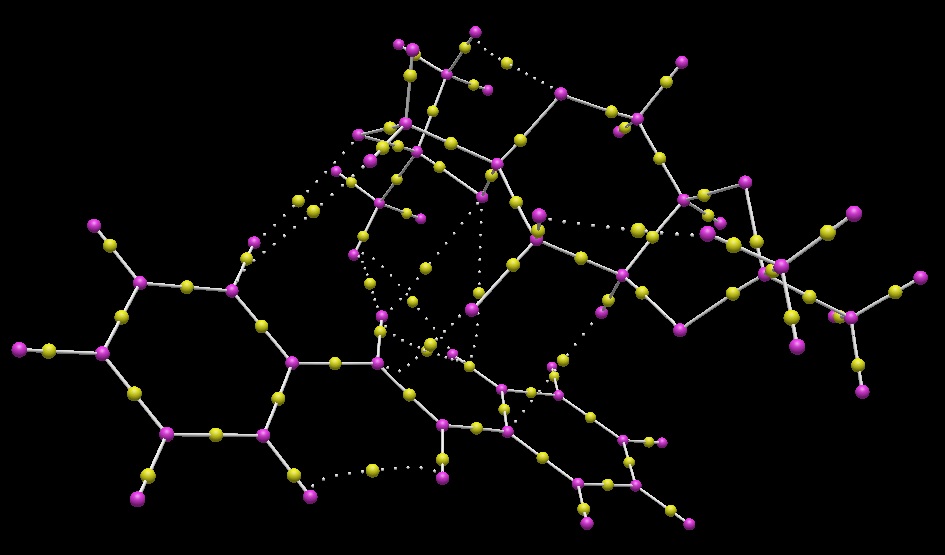
The electronic topology analysis was carried out in Avogadro 2 using the QTAIM method. The results are shown in the following image, with purple orbs representing atomic centres and yellow orbs representing electron density:
Many of the key features of the QTAIM electronic topology analysis are the same as those seen in the NCI analysis. Van der Waals interactions can be seen between the acetal methyl groups and stilbene hydrogen atoms, especially on the alkene and nearer aromatic ring. The relatively strong interaction between the acetal oxygen and aromatic hydrogen can also be seen on here, with the electron density closer to the hydrogen. This indicates significant donation is present. Some interactions are also seen between hydrogen atoms on the Shi catalyst and the π clouds of the aromatic rings. However, the electronic topology analysis can highlight one thing that the NCI analysis cannot, which is the mechanism of formation of the epoxide C-O bonds. One of the alkene carbon atoms is in closer proximity to the dioxirane oxygen than the other and this carbon interacts with the oxygen much more strongly; the electron density is also localised closer to this atom. This provides evidence that the formation of the two C-O bonds is not concerted; instead, it seems to happen in two steps, with the oxygen atom donating electron density into the C=C π* orbital to break the π bond and form one C-O bond, with the second formed slightly afterwards.
New Candidates for Investigation
An interesting experiment would be to determine the effectiveness of the Jacobsen and Shi catalysts at epoxidising electron deficient double bonds. A good test substrate for this would be trans-chalcone, which is commercially available from Sigma-Aldrich. The reaction scheme for this proposed synthesis is ahown below:
The molecule is structurally relatively similar to stilbene and produces an intense optical rotation; a value of [α]D of -266.5° for one isomer has been reported in the literature[16]. Comparing the epoxidation yield and enantiomeric excess with stilbene would provide interesting insights into how the epoxidation reactions work and how many substrates catalytic asymmetric epoxidation can be extended to.
References
- ↑ D. Skala and J. Hanika, Pet. Coal, 2003, 45, 105–108.
- ↑ A. Cope and B. Pawson, J. Am. Chem. Soc., 1965, 87, 3649–3651.DOI:10.1021/ja01094a021
- ↑ A. Cope, K. Banholzer, H. Keller, B. Pawson, J. Whang, and H. Winkler, J. Am. Chem. Soc., 1965, 87, 3644–3649. DOI:10.1021/ja01094a020
- ↑ W. Maier and P. Schleyer, J. Am. Chem. Soc., 1981, 103, 1891–1900. DOI:10.1021/ja00398a003
- ↑ 5.0 5.1 L. Paquette, N. A. Pegg, D. Toops, G. D. Maynard, R. D. Rogers, J. Am. Chem. Soc.,, 1990, 112, 277-283. DOI:10.1021/ja00157a043
- ↑ F. Jensen, J. Chem. Theory Comput., 2008, 4, 719–727. DOI:10.1021/ct800013z
- ↑ 7.0 7.1 7.2 7.3 7.4 Z. Wang, Y. Tu, M. Frohn, J.-R. Zhang and Y. Shi, J. Am. Chem. Soc., 1997, 119, 11224–11235. DOI:10.1021/ja972272g
- ↑ 8.0 8.1 J. Hanson, J. Chem. Educ., 2001, 78, 1266. DOI:10.1021/ed078p1266
- ↑ Z. X. Wang, S. M. Miller, O. P. Anderson, and Y. Shi, J. Org. Chem., 2001, 66, 521–30. DOI:10.1021/jo001343i
- ↑ 10.0 10.1 E. Jacobsen, W. Zhang, A. R. Muci, J. R. Ecker, and L. Deng, J. Am. Chem. Soc., 1991, 113, 7063–7064. DOI:10.1021/ja00018a068
- ↑ 11.0 11.1 11.2 11.3 R. I. Kureshy, S. Singh, N. H. Khan, S. H. R. Abdi, S. Agrawal, and R. V. Jasra, Tetrahedron: Asymmetry, 2006, 17, 1638–1643. DOI:10.1016/j.tetasy.2006.05.029
- ↑ 12.0 12.1 12.2 K. Schröder, S. Enthaler, B. Join, K. Junge, and M. Beller, Adv. Synth. Catal., 2010, 352, 1771–1778. DOI:10.1002/adsc.201000091
- ↑ D. R. Boyd, N. D. Sharma, R. Agarwal, N. A. Kerley, R. A. S. McMordie, A. Smith, H. Dalton, A. J. Blacker, and G. N. Sheldrake, J. Chem. Soc. Chem. Commun., 1994, 1693. DOI:10.1039/C39940001693 10.1039/C39940001693
- ↑ H. Sasaki, R. Irie, T. Hamada, K. Suzuki, and T. Katsuki, Tetrahedron, 1994, 50, 11827–11838. DOI:10.1016/S0040-4020(01)89298-X
- ↑ 15.0 15.1 T. Linker, Angew. Chem. Int. Ed. Engl., 1997, 36, 2060–2062. DOI:10.1002/anie.199720601
- ↑ X. Wang, L. Shi, M. Li, and K. Ding, Angew. Chem. Int. Ed. Engl., 2005, 44, 6362–6. DOI:10.1002/anie.200501676


