Rep:Mod:Dr Who
Computational Chemistry
BH3
The molecule was drawn using Gaussview and the B-H bond lengths set to 1.5 Å. Gaussian then optimised this molecule using the B3LYP method and the basis set, 3-21G. This is a low accuracy basis set and hence the calculation was quick, it took 27 seconds. The resulting optimised B-H bond lengths were 1.19 Angstrom ( accurate to 0.01 Å). The optimised H-B-H bond angle was 120° (accurate to 0.1°) as would be expected for a trigonal planar molecule using VSEPR theory. The overall dipole moment was zero. The point group is D3h (there are three 3C2 rotational axese, 3 σv and 1 σh mirror planes.
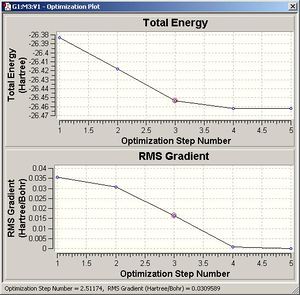
The optimization calculation was completed, it converged to a minimum energy structure in five steps. The final and most negative energy (RB+HF-LYP) was -26.46 a.u (Hartree) (accuracy = 10kjmol-1) as shown in the plot of energy versus step number. The Root mean square (RMS) gradient decreased to a final value very close to zero ( 2.85×10⁻⁶ a.u). This is conformation that the molecule has actually been optimised; the optimised structure should be a minimum in the potential energy curve, that is the derivative (gradient) of this surface should be zero.
In Gaussview, the first three structures corresponding to these plots don’t show any bonds. This is because Gaussian only draws a bond when two atoms are within a pre-defined distance from each other. Hence the B and H atoms are further away than this set value in these structures. This is in contrast to molecular mechanics which puts a bond wherever it is told to. A bond is really a region of electron density between two atoms that is represented with a line. (Generally these lines represent 2e-2c bonds but this is not always the case as for example in borane clusters.) It could also be defined as a force between atoms arising as a resulting of Coulombic interactions. It could be ionic, metallic, covalent for example.
Molecular Orbital Analysis
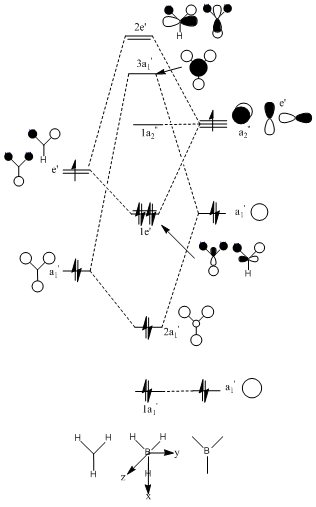
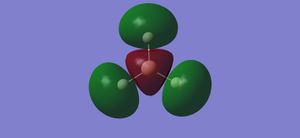
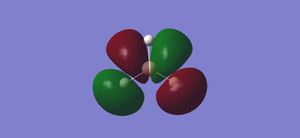
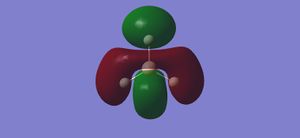
Molecular orbital theory can be used to determine the MO diagram for BH3 using B and the H3 fragments (symmetry adapted orbitals). These qualitative MO’s can be compared with those computed. In fact, it is difficult to decided by simply considering the interactions, the relative ordering of the 2e’ and 3a1’ MOs. Computational chemistry may be able to help. The population was calculated using Gaussian at the same level as that used for the optimisation, the 3-21G level. The same basis set used for the optimization must be used for further calculations otherwise different results are obtained.
 |
 |
 |
 |
 |
 |
 |
 |
| MO | 1a1' | 2a1'/ HOMO-1 | 1e'/ HOMO | 1a2"/ LUMO | 3a1'/ LUMO+1 | 2e'/LUMO+2 |
| Computed MO | 1 | 2 | 3 and 4 | 5 | 6 | 7 and 8 |
| computed Energy/ Hartree | -6.81 | -0.48 | -0.328 | -0.0877 | 0.0438 | 0.1061 |
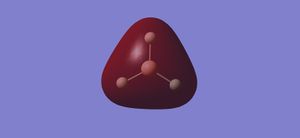
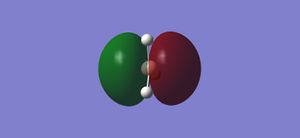
| Comparision | This is the 1s AO of B. It is much lower in energy than HOMO-1 and hence it is non-bonding | The qualatative LCAOs show this as being completely bonding with larger coefficient s on the H3 (as its closer in energy). The computed MO is in good agreement showing a delocalised orbital over the entire molecule. There is no antibonding. | These are the doubly degenerate HOMO orbitals. They are bonding in character. | This is the non-bonding pz orbital centred on boron. | The energy is now positive as these are overall anti-bonding orbitals. | Finally, these are the anti-bonding degenerate orbitals |
In general, the computed MOs are impressively accurate. There seems to be very little difference between the real and LCAO MOs. This outcome supports the use of MO theory . The computed MOs also indicate that the 3a1’ LCAOs are at a lower energy than the 2e’ despite the stronger s-s antibonding interactions in the former compared to the s-p interactions in the later.
Natural Bond Orbital (NBO) analysis
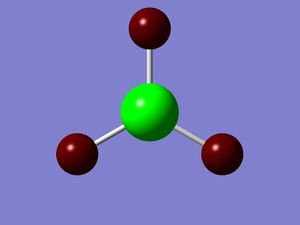
Boron is electron deficient; it has only 6 valence electrons rather than the full octet. In order to overcome this, it often forms dimers or adducts with Lewis bases. Colouring the atoms by charge in gaussview, shows that the B atom is highly positively charged. The NBO charge are 0.331 and -0.110 for the B and H’s, respectively. The Gaussian NBO analysis log file provides information about the bonding in the compound. Boron is sp2 hybridised shown by the 33 % s character and 66% p character. It forms 3 sp2 orbitals. It bonds to the 1s orbitals of H.
Vibrational Analysis
A frequency calculation was performed on the optimised molecule. All the frequencies were positive, confirming that the structure found is indeed an minimum, that is the second derivative of the potential energy surface is positive.
6 vibrational frequencies were computed. (There are 3N-6 vibrational modes for a non-linear molecule and there are 4 atoms),
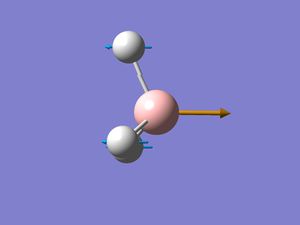
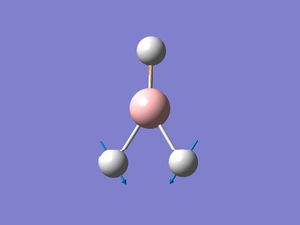
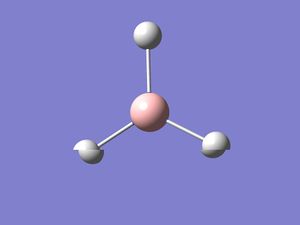
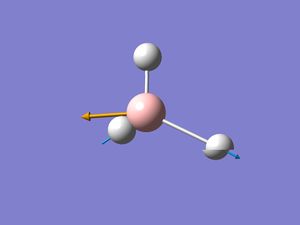
The vibrations were animated on gaussview.
The computed IR spectrum only shows 3 peaks at, 1146, 1204 and 2731 cm-1. The vibration of frequency 2592 is symmetrical, it has a1’ symmetry and hence this vibration does not involve a change in dipole moment. It is IR inactive. The vibrational frequencies 2 and 3 are of very similar energy as are those of 5 and 6 so aren’t distinguishable on the spectrum. The IR peaks aren’t just lines then actually resemble real IR absorption peaks. Gaussian uses a Lorentz curve to make the results resemble experimental.
BCl3
Again, BCl3 was drawn in gausview (graphical interface) and then optimised using Gaussian to create a file output. The point group symmetry of this molecule was however very tightly fixed to D3h for this calculation. The method employed was RB3LYP and a medium level basis set, LANL2MB was used. Again, the gradient approached a value close to zero and the final energy reached was -69.44 Hartree (a.u). Frequency analysis was carried out to confirm that the structure was a minimum. Like BH3 it has no dipole moment due to its symmetry. The optimised Cl-B-Cl bond angles of the trigonal planar molecule were still 120° in line with literature . The B-Cl bond distance was 1.8659 Å (shorter than the B-H bonds calculated earlier). This is larger than the literature value of 1.75 Å. This is a resulting of π donation of the lone pair in the 3p orbital on Cl into the vacant 2p orbital of the sp2 hybridised boron atom. This gives the bond some double bond character, hence shortening it [1]. This is done to relieve partly the electron deficiency at B. H does not have these lone pairs so cannot stabilise the monomeric species in this way. The value calculated in fact seems to be the sum of the covalent radii of B (0.88 Å) and Cl (0.99 Å).[2]
Trichloroborane has D3h symmetry.
The MO diagram for Bh3 can be modified slightly for BCl3.
Cis and Trans Isomers of Mo(CO)4L2
The cis and trans geometrical isomers where L = trichlorophosphine where optimised by Gaussian initially using the B3LYP method and the basis set and pseudo potential (PP) LANL2MB . The convergence was set to loose (as the method being used is low level). The chlorines of the phosphine ligands are actually replacing phenyl groups, which are computationally demanding. The chlorines are also fairly bulky and are electronically similar. After this initial optimisation, a second optimisation calculation was performed on the isomers after initial fixing of the dihedral angles in gaussview. The same method was used but a better basis set and PP, LANL2-DZ was used compared to the minimal basis used previously. Hence a tight convergence could be used with this double zeta basis set and PP. As seen previously with the borane monomers, here is another case were gaussview doesn’t recognise the bonds. The computed P-Cl bond lengths were greater than the pre-defined values in gaussview and they weren’t displayed. Two optimisations were carried out as the first may have found a local minimum on the potential energy surface, which is in fact not the true minimum structure.
trans_opt_2 DOI:10042/to-3019 cis_opt_2 DOI:10042/to-3020
Using the same basis set and method a frequency calculation was then performed to check that the structure found was in fact a minimum as well as to obtain the IR spectra. The importance of using the same basis set for further calculations could be thought of as being analogous to performing a mathematical calculation and rounding the answer to 2 decimal places. Clearly if would be incorrect to then use this rounded value in subsequent calculations and then quote the final answer to say 4 decimal places. The basis set determines the accuracy (and partly the time taken for the calculation to run).
Structure
The two PCl3 groups can either be cis or trans to each other. The cis complex has C2v symmetry whereas the trans belongs to the D4h point group. These symmetries are directly related to the number of carbonyl vibrations (below). Both complexes should be octahedral by VSEPR theory with all bond angles equal to 90 °. On observation (without measurement) both complexes appear to be octahedral about the Mo centre.
Hogarth and Norman [3] report the general features of cis-Mo(CO)4L2 complexes as determined by crystallography; the P-Mo-P angle is greater than the expected 90 degrees for an octahedral complex and Mo-C bonds trans to the P are shorter than the those cis to the P. The values they quote for when L= PPh3 are given in table 3.They also report several bond lengths and angles in the molecular structure of trans-Mo(CO)4(PPh3)2 (table 4).
| Measurement | Literature Value | Computed Value ±0.01Å, ±0.1° |
|---|---|---|
| P-Mo-P | 104.6 | 94.1 |
| Mo-C | average difference=0.12 | 2.01 (trans to P),
2.06 (cis to P). Diff =0.046 |
| Mo-P | 2.567, 2.577 | 2.51 |
| Measurement | Literature Value | Computed Value ±0.01Å, ±0.1° |
|---|---|---|
| Mo-P | 2.5 | 2.44 |
| Mo-C | 2.016,2.005 | 2.06 |
| C-O | 1.164,1.165 | 1.17 |
| P-Mo-P | 180 | 177.4 |
| C-Mo-C (trans) | 180 | 180 |
| C-Mo-C (cis) | 92.1 | 90.5 |
| P-Mo-C | 87.2, 92 | 88.7, 91.3 |
In general, for both isomers there is a lot of variation between the literate values and those computed. A particularly interesting difference is the P-Mo-P angle in the trans isomer. Analysis of the Gaussian output for both complexes appears to show that they aren’t fully optimised. The maximum displacement hasn’t converged but all the other parameters have.
For the cis isomer:
Item Value Threshold Converged?
Maximum Force 0.000050 0.000450 YES
RMS Force 0.000012 0.000300 YES
Maximum Displacement 0.002422 0.001800 NO
RMS Displacement 0.000687 0.001200 YES
Predicted change in Energy=-2.765022D-08
The calculation should probably be repeated (after further manipulation) to try to find the true minima on the potential energy surface. Other reasons, for differences may be the accuracy of the calculation performed. The Cl atoms also, although similar electronically and sterically to phenyl groups are clearly not exactly the same. The phosphorus atom also has low-lying d-orbitals which were not included in the basis set. Furthermore, the optimised structure calculated by Gaussian relates to the gas-phase. The X-ray crystal values were measure on the crystal/solid state. Crystal pairing forces if present may distort the molecule.
The Mo-P bonds in the trans isomer are shorter than those in the cis (in agreement with relative lengths found in literature as stated above). Sterically it might be more favourable for the cis isomer to have the bulky groups further away (longer bond length). There is little deviation from ideal octahedral geometry for the trans isomers in literature.
Relative Energy
The trans isomer might be expected to be more stable than the cis on the basis of steric interactions. The triphenylphosphine ligands are bulky and the trans isomer places them approximately 180° apart compared to 90 degrees in the cis isomer. (Of course, these angles aren’t exact as discovered in the previous section). Experimentally (ref5), this was found to be the case, where the trans isomer was lower in energy than the cis by 2-3kcalmol-1. Darensbourg [4]uses sterics to explain the slightly greater thermodynamic stability (1kcalmol-1) of the trans complex for Mo(CO)4(P-n-Bu3). Computationally however, the cis isomer was found to be about 2.74 kJmol-1 (0.654 kcalmol-1) lower in energy (more negative) than the trans. This energy difference is not very large (considering for example that the barrier to rotation about the C-C bond in ethane is about 12.5 kJmol-1 or 3 kcalmol-1). In units of Hartree, this difference is even harder to see. (Energies can be compared here, as the two complexes are isomers and the same basis set is being used.) This result maybe due to not having fully optimised structures, being in the gas phase, the use of Cl rather than Ph and the lower level of calculation. Including the d orbitals of the metal centre in the basis set may give a lower energy of the trans. Changing the steric bulk of the ligand, L may result in different ordering of the energies. Also, although computationally demanding phenyls could actually be used in performing the calculation.
However, computational calculations done by Bennett et al [5]using Gaussian 98 to perform single density functional calculations using BECKE3LYP and LANL22DZP PP and basis set found also that the cis-Mo(CO)4(PPh3)2 is lower in energy than the trans. They reported a much large difference in energy of 72.98 kjmol-1. This is a significant difference from which they concluded that the cis complex is electronically more stable in the gas phase. The implication being that electronic stabilisation in the cis isomer overrides sterics stabilisation is the trans isomer. Bennett et al suggest environmental factors or entropy considerations may be the reason for more trans isomer.
Vibrations, Frequencies and IR Spectra
For the cis isomer (C2v symmetry), 4 absorption bands due to CO stretches are expected. The four CO vibrational modes, two of A1 symmetry; A1 (1) and A1 (2) as well as one of each B1 and B2symmetry are infrared active. That is they involve a change in dipole moment. These vibrational modes are illustrated in the diagram (taken from my second year lab report).
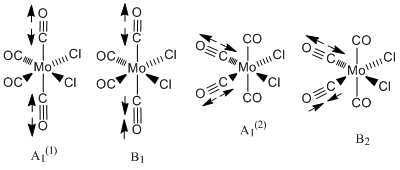
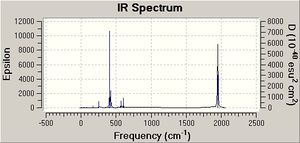
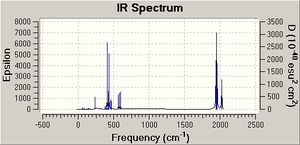
The experimental values obtained in year 2 synthesis labs and those found in the literature are summarised in table 5 alongside the computed results. (Experimentally, only three vibrations were clearly resolved possibly indicating that two of the vibrations were close in energy). Comparision of these values showed that the computed vibration of A1(1) symmetry is in very good agreement with the literature value. In general though, overall the agreement is not that good. There is an error associated with the computed values due to the fact that anharmonicity was not taken in account. This error is about 10 %, which equates to an average of 197 cm-1 for the values being calculated. This is fairly significant. Bearing this in mind as well as the level of the calculation, the fact that the geometry is not fully optimised and the use of Cl in place of Ph (the P d orbitals have also been omitted ), the values are actually not that bad. Notably, there is also quite a large difference between the literature values measured in C2Cl4 and the lab results measured in nujol. Can Gaussian account for the solvent? (research-the solvent was accounted for in the NMR in module 1). The computational vibrational modes do not look exactly like expected. The other carbonyls to those indicated in the diagrams above move too. This is probably a result of not have a completely optimised structure. Al(l) four computed vibrations are of high intensity, the highest being the vibration at 1949 cm-1.
| A1 | A1 | B1 | B2 | |
|---|---|---|---|---|
| Computed | 2023 | 1958 | 1949 | 1945 |
| Literature[6] (C2Cl4) | 2023 | 1927 | 1908 | 1897 |
| Yr 2 Labs (nujol) | 2012 | 1888 | shoulder on 1888 | 1840 |
 |
 |
 |
 |
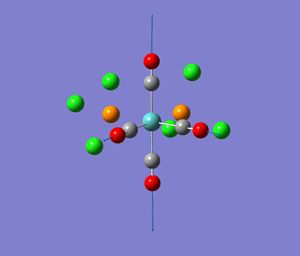
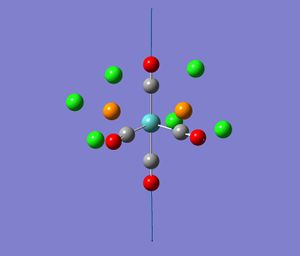
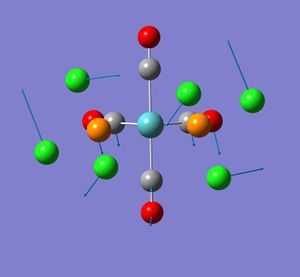
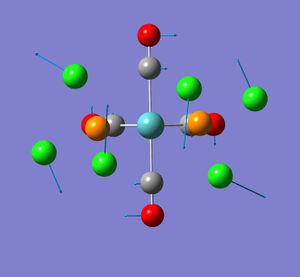
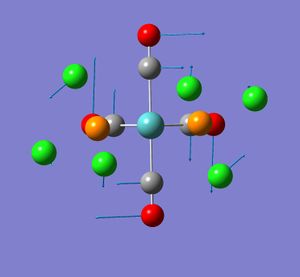
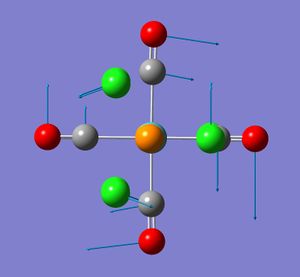
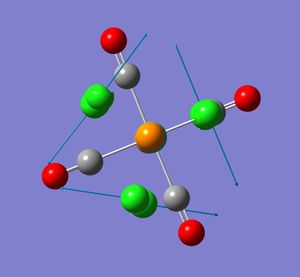
None of the computed frequencies were negative indicating that the optimised structure is a minimum in energy. Some low frequencies were obtained, the lowest being 11 cm-1. A few of these low energy vibrations are illustrated. They appear to show movement of the chlorine atoms of the PCl3 groups with related responsive movement of collectively the Mo centre and the CO ligands.
 |
 |
 |
The trans isomer (D4H) is expected to have only one infrared active CO vibration; two degenerate antisymmetric stretches of Eu symmetry of the carbonyls arranged trans to each other.The value quoted in tetrachloroethylene in the literature[7] is 1901 cm-1. In synthesis labs measured in nujol it was 1892 cm-1. Computationally, there appears to be four CO vibrations. Two of these at 1951 and 1950 cm-1 are very close and can be assumed along with analysis of the vibrational motion in gaussview to be the degenerate pair expected. The other two are of very low intensity. The later may be due to the structure not being the true minimum as already mentioned. The former degenerate pair are within reason to the experimental data taking into account the issues mentioned previously for the cis isomer. The computed vibrations also show deviations from those expected.
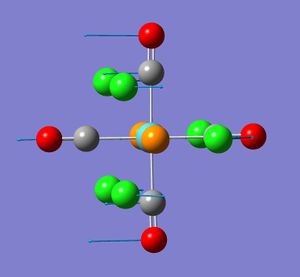
As for the cis isomer, no negative frequencies were obtained but some low energy ones were. The three shown correlated to vibration frequencies of 5, 6 and 37 cm-1. The frequency at 6 cm-1 in infrared active.
 |
 |
 |

|
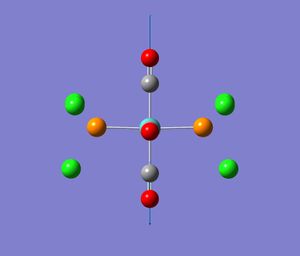 |
RT≈2.5×10³Jmol-1. The d occupancy of the metal centre is d0.It might be that these low energy vibrations could indicated that the phosphine ligands are dissociating at room temperate. Perhaps they are coming on and off.
Mini Project [M(CO)6]n
- Confirm, analyse and illustrate the effect of increasing negative charge on the back-bonding to CO pi* in the series of 18 electron isoeletronic complexes; [Mn(CO)6]+, [Cr(CO)6], [V(CO)6]- and [TI(CO)6]2- using the computational techniques above. The d occupancy of the metal centres in each case is d6. The oxidation state/charge is changing from +1 to -2 from the group 7 transition metal down to the group 4 metal.
- Achieved by looking at the dependence of the CO stretching frequencies on electron density of the metal. As well as by NBO analysis. An explanation in terms of molecular orbitals will also be tried to be achieved computationally.
- All complexes were draw in gaussview and optimised first to a low level; 3-21G and then to a higher level, 6-31G(d) using B3LYP. The later basis set of the fully optimised structure was used in all other calculations; frequency analysis, NBO analysis, MOs.
Mn opt:DOI:10042/to-3344 , Cr opt: DOI:10042/to-3345 , V opt:DOI:10042/to-3347 , Ti opt: DOI:10042/to-3346
Bonding
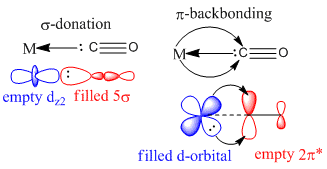
Carbonyl groups are L-type, 2 electron donors. They are good π acceptors giving rise to a large octahedral splitting. MO theory can explain this. They exhibit synergic bonding. The 5σ orbital of the carbonyl forms a σ bond with an empty orbital of appropriate symmetry on the metal centre. π-backbonding also takes place from a filled metal d-orbital into the vacant π* antibonding CO orbital .Both carbonyl orbitals have larger coefficients on carbon. The degree of backbonding will affect the M-C and C-O bond lengths and thus also the CO stretching frequency. For the series of homoleptic complexes considered here., the increasing negative charge (from Mn(CO)6+ to to Ti(CO)6 2-) would be expected to lead to larger, more diffuse 3d orbitals or a greater electron density at the metal centre. This would result in greater backbonding and decreasing CO stretching frequencies as well as increasing C-O bond lengths. The aim then is too examine this using computation chemistry. Computed values have been compared with those in the literature where possible to check for accuracy [8]
Structure
All four complexes are octahedral (as expected). The angle between the two carbonyl groups arranged trans to each other is 180° and between those arranged cis is 90° . They all belong to the Oh point group. This agrees with x-ray diffraction data [9] for Mn(CO)6 for example, which shows little deviation from the octahedral geometry. The C-M-C angles are reported to deviate by up to 1.2 °
| Metal Centre | M-C/Å | C-O/Å |
|---|---|---|
| Mn | 1.90 (1.905) | 1.14 (1.121) |
| Cr | 1.88 (1.866) | 1.16 |
| V | 1.92 (1.946) | 1.18 |
| Ti | 2.008 (2.003) | 1.20 |
Down this series (Mn to Ti), the C-O bond length increases indicating that the bond is getting weaker. This implies a greater amount of back-bonding into the π* C-O orbital as putting electrons into an antibonding orbital weakens the bond. The CO bond length in free CO is 1.145Å. This is weakened on complexation to the metal centre as a result of this backbonding. Gaussview recognises the CO bonds in Cr and beyond as being only double bonds. (In fact, thinking back the same thing happened with the Mo isomers). On the same rationale, the M-C bond lengths would be expected to get shorter (stronger) down the series. This is only the case from Mn to Cr. Checking with literature (which seems to show varied values for these bond lengths), the shortening with decreasing atomic number of the metal is not seen. All the values are actually quite similar, there isn’t a huge difference. In the same direction as increasing backbonding (Mn to Ti), to the d-orbitals are increasing in size. Hence there are two competing effects. Orbitals of similar size and energy overlap to form stronger bonds. Mn on the basis of orbital size might therefore be expected to form a stronger bond to C. However, there is less backbonding in this complex (compared to Ti), which would result in the Mn-C bond being the weakest of the series.
Vibrational Analysis and IR spectra
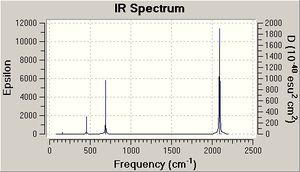
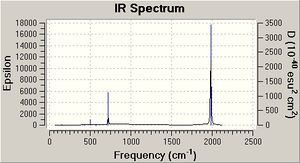
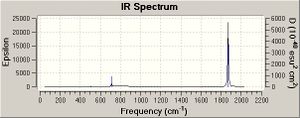
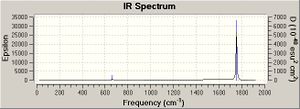
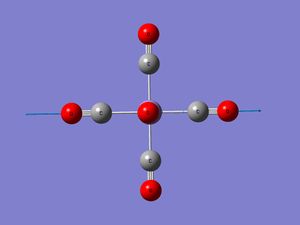
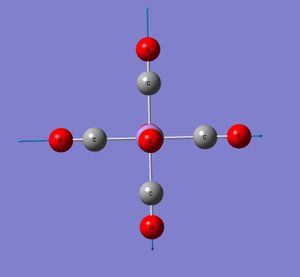
On the basis of the previous calculations, the weakening CO bond strengths on going from Mn(CO)6+ to Ti(CO)62- should result in decreasing CO stretching frequencie (E=hv). This is in fact calculated to be the case (table 7 and IR spectra). The CO stretches have threefold degeneracy, they are of T1u symmetry (shown for Mn complex but essentially the same for the others).
 |
 |
 |
 |
 |
 |
 |
| Metal Centre | υ(CO)/cm-1 | υ(MC)/cm-1 |
|---|---|---|
| Mn | 2091(2090) | 451 (412) |
| Cr | 1981(2000) | 496 (440) |
| V | 1869 (1859) | 510 (460) |
| Ti | 1754 (1748) | 496 |
CO gas = 2143 cm-1
The Tlu M-C vibrations show an increase in wavenumver down the series as far as V. This agrees with what expected, the bonds are getting stronger. It is odd that this doesn’t correlate with the previous bond lengths. In constrast, the CO stretching frequencies, these values aren’t in such good agreement with the literature.
Mn freq: DOI:10042/to-3348 , Cr freq: DOI:10042/to-3349 , V freq: DOI:10042/to-3350 , Ti freq: DOI:10042/to-3351
NBO Analysis
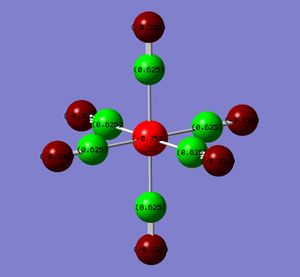
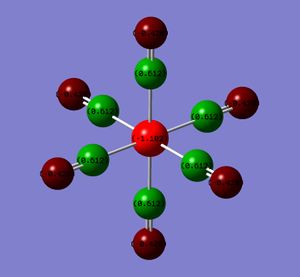
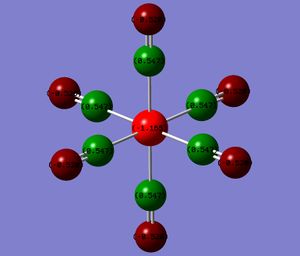
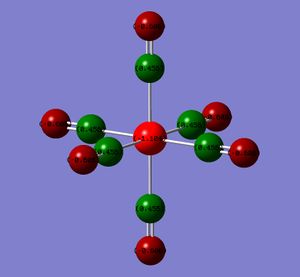
The atoms have been coloured by charge as well as the NBO numbers displayed. The natural bond orbitals show the distribution of the charge. A high positive charge is indicated by the bright green whereas a highly negative charge is indicated by the red. The NBO charges and colours actually show that the electron density on the metal increases from the group 7 to 4. This results in a greater charge distribution on the carbonyl oxygen and a corresponding lower value at the C probably due to Coulombic interactions. (Intially, I thought that if the backbonding into the π* of the CO was increasing from the group 7 to group 4 complex, then the metal centre would be expected to get increasing less red and more green.)
| Metal Centre | M | C | O |
|---|---|---|---|
| Mn (group 7) | -0.755 | 0.625 | -0.332 |
| Cr | -1.102 | 0.612 | -0.428 |
| V | -1.165 | 0.547 | -0.512 |
| Ti (group 4) | -1.104 | 0.456 | -0.606 |
A greater electron density at the metal centre should give rise to a greater back-bonding.
 |
 |
 |
 |
MO Analysis
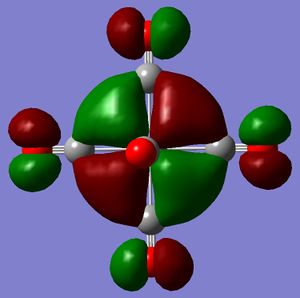
In terms of MO theory, the p antibonding orbitals of the CO ligands overlap with the 3d orbtials of the metal centre. The result is making a non-bonding orbital in an octahedral complex containing only sigma orbitals, bonding. CO is a good pi-acceptor because these antibonding orbtials lie close in energy (slightly above) to the 3d atomic orbitals of the metal. Hence the overlap is good and the splitting large. Increasing the negative charge from the Mn complex to the Ti complex, should cause expansion of the d atomic orbitals and hence a greater overlap with the CO antibonding orbital leading to a greater stabilisation of the resulting molecular orbitals. The MOs have been calculated for the two extremes of the series. Looking at the HOMOs, it is just about possible to ascertain that the d orbital for Ti is larger than that for Mn (isovalue=0.02). These HOMOs are triply degenerate.
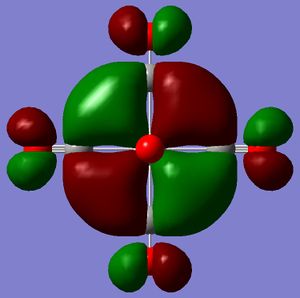 |
Mn MO: DOI:10042/to-3352 , Ti MO: DOI:10042/to-3353
Reactivity
The complexation of unreactive CO to a metal centre, increases its reactive. The degree of backbonding affects this reactivity. One of the carbonyls of Cr(CO)6 can undergo nucleophilic attack at the carbon followed by reaction with an electrophile at oxygen to yield a Fischer Carbene. Optimisation to the 6-31G(d) level could be performed on this carbene followed by frequency analysis. The resulting CO stretching frequencies would be expected to show that the carbene decreases the C-O bond strength of the remaining CO ligands. The frequency would be lower than the 1981 cm-1 found above for the hexacarbonyl species. Carbenes are less effective at backbonding that carbonyls so there will be more electron density at the metal centre available for backbonding to the carbonyl.


References
- ↑ Rob Davies Yr1 notes
- ↑ Atkins
- ↑ G.Hogarth and T.Norman, Inorganica Chemica Acta 245, 1997, 167. DOI:10.1016/S0020-1693(96)05133-X
- ↑ D.Darensbourg,Inorg. Chem.,1979,18, 14, DOI:10.1021/ic50191a003
- ↑ D.Bennett et alJ.Chem. Cry., 34, 2004,353. DOI:10.1023/B:JOCC.0000028667.12964.28
- ↑ D.Darensbourg and R.L.Kump,Inorg. Chem., 1978, 17, 2680 DOI:10.1021/ic50187a062
- ↑ D.Darensbourg and R.L.Kump,Inorg. Chem., 1978, 17, 2680 DOI:10.1021/ic50187a062
- ↑ Ed Marshall 2nd Year Lecture Notes
- ↑ H.Geier,H. Williner, C.W.Lehmann and F.Aubke, Inorg.Chem.,2007,46,7210. DOI:10.1021/ic700798z
- ↑ A.G.Orpen,L.Brammer,F.H.Allen,O.Kennard,D.G.Watson and R.Taylor, J. Chem. Soc. Dalton Trans, 1989, S1
- ↑ R.A.N. Mclean, Can. J. Chem., 1974, 52, 213

