Rep:Mod:Dl2613
Introduction
The aim of this experiment was to use a simple model of atomic interactions to calculate the energy and vibrations of a crystal of MgO. This was then used to compute the free energy, phonon dispersions and to predict how MgO expands when heated. The quasi-harmonic approximation (QHA) and molecular dynamics methods were used to do these calculations.
The QHA is a phonon based model of solid-state physics and can describe volume-dependant thermal effects of structures, such as the MgO crystal. This assumption assumes that for every lattice value the harmonic oscillator assumption is true. MD is a type of N-body simulation, it allows atoms and molecules to interact for a fixed period of time showing the dynamics of a system. In this experiment the MD was run on an isothermal-isobaric (NPT) ensemble in which the amount of substance, pressure and temperature are fixed. MD allows motion in three dimensions[1].
The software used for this experiment was RedHat Linux. DLVisualize (DLV) was used for the visualisation of the structure and properties of the MgO crystal. General Utility Lattice Program (GULP) is a supporting interface of DLV and was used to perform analytical solutions on MgO through the use of lattice dynamics.
Internal Energy Calculation on MgO
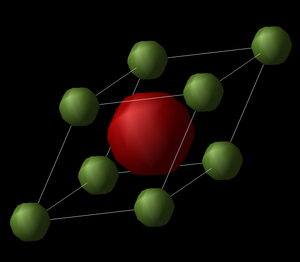
In this first exercise the internal energy and structure of MgO was calculated using GULP from the primitive unit cell of the crystal (Fig 1). An ionic potential model was used, without shells included and at a single point. The primitive unit cell is the simplest cell to describe the crystal structure of MgO and contains 2 atoms. The lattice vectors of this cell are:
0.000 2.106 2.106
2.106 0.000 2.106
2.106 2.106 0.000
From the log file it can be seen that the lattice parameters are defined by the length 2.978Å and the angle 60º, giving the primitive unit cell the shape of a rhombohedron. Each primitive cell was calculated to have an energy of -40.08 eV and this corresponds to the binding energy of the crystal. The primitive cell can be used to build up a lattice by repeating its structure.
Calculation of phonon modes of MgO
Computing the Phonon Dispersion Curves:
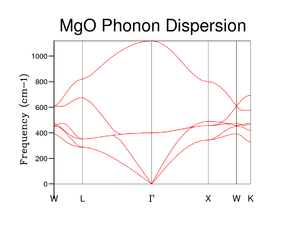
The phonon frequencies were then computed along the symmetry points in k space. The calculation was set up for 50 Npoints with phonon eigenvectors included in the calculation. For a 3D crystal of diatomic molecules with two atom types, six vibration modes are observed in the phonon dispersion curves (Fig 2). A positive dispersion relation results in optical modes and a negative dispersion relation results in acoustic modes. Two adjacent different atoms move with each other in the optical mode, but move against each other in the acoustic mode. The acoustic modes equal 0 cm-1 at the point Γ whereas the optical modes do not. It can be seen that there are three acoustic modes and three optical modes. The three acoustic modes can be split into one longitudinal acoustic mode and two transverse acoustic modes. The two transverse modes become degenerate between and . The phonon dispersion curve agrees with that found in literature[2]
The Phonon Density of States:
A simpler energy level diagram than the phonon dispersion relation is the density of states (DOS). The DOS is an average over the time and space demains of the MgO system and was calculated for the phonons as a function of the wave vector k. The dimensional limits of the MgO crystal affects the DOS and therefore it is expected that the DOS will change with the grid size of the MgO crystal.
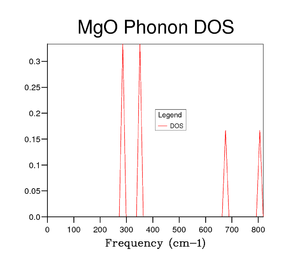
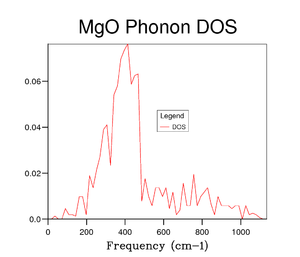
To begin with the DOS calculation was ran on a 1x1x1 grid, corresponding to a single k point. Comparison between Figure 2 and 3 shows that the single k point is the symmetry point . The frequencies of the phonon dispersions are identical in the two graphs. Four peaks instead of six are observed due to the fact that 2 pairs of modes become degenerate between and . These degenerate modes correspond to the peaks between 250 and 400 cm -1, explaining why those peaks are double the intensity of the high frequency peaks. It can been seen that a grid size of 1x1x1 is not a good representative of the DOS.
 |
 |
 |
 |
 |
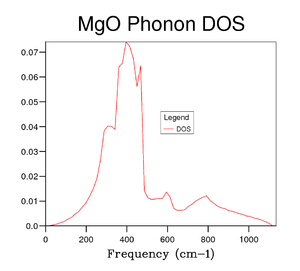 |
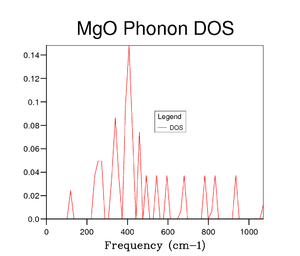
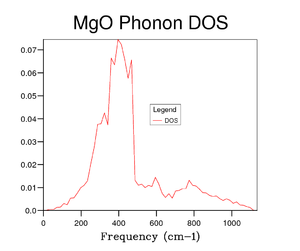
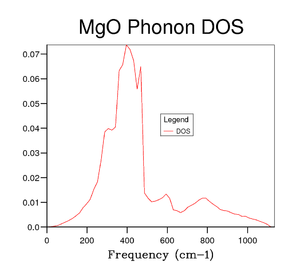
Several grid sizes were investigated up to 50x50x50 to find a compromise between an accurate DOS and the time taken to run the calculation. As the grid size is increased a more true depiction of the DOS is obtained for the MgO structure. Increasing the grid size increases the number of peaks and then changes the graph from random sharp intensities to a smoother curve. However, the highest intensity point remains at 400 cm-1 throughout all grid sizes and the higher frequencies having lower intensities. The bigger the grid size, the more k points that are sampled and the more representative the DOS plots. It can be seen in the figures above that the DOS curve is unchanged between 32x32x32 and 40x40x40, however, the running time increases greatly for the 40x40x40 grid size. Therefore, it was decided that the 32x32x32 grid size was the optimum and was used in further calculations.
The size of the grid set in the calculations is inversely related to the size of the structure in real space.
This equation shows that the bigger a* (size of grid in k space) the smaller a (size of cell in real space). Therefore the bigger the cell in real space, the smaller the grid size needed for the calculation of DOS. This means that a similar oxide such as CaO will require a similar grid size as MgO for the calculation of DOS. Faujasite, a zeolite, has a lattice parameter in the range 24.2 - 25.1 Å [3] and would therefore need a small grid size for the DOS calculation. Lithium, a small metal, has a lattice parameter of 3.51 Å [4] and would therefore need a large grid size for the DOS calculation to represent its small cell size in real space.
Computing the Free Energy
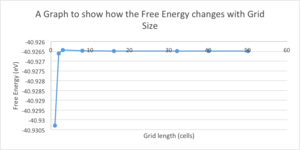
The Helmholtz Free Energy of MgO was then computed using the quasi-harmonic approximation on the same grid sizes as in the previous section at a temperature of 300K. Helmholtz Free Energy is given by the following equation:
where A=Helmholtz Free Energy, U=Internal Energy, S=Entropy and T=Temperature
This states that the Helmholtz Free Energy should increase with increasing internal energy and decreasing temperature and entropy. This said, the Helmholtz Free Energy should decrease with increasing grid size. This can be explained with the aid of the following statistical mechanics equation of entropy:
where S=Entropy, k=Boltzmann Constant and W=number of microstates
As the grid size increases the number of microstates sampled also increases. This in turn increases the entropy and decreases the TS term in the Helmholtz Free Energy equation. The decrease in Helmholtz Free Energy can be further explained using the following equation of internal energy:
where U=internal Energy, H=Enthalpy, P=Pressure and V=Volume
As the grid size increases so does its volume, therefore decreasing the internal energy. This further decreases the Helmholtz Free Energy. It can be seen in Graph 1 that initially the Helmholtz Free Energy increases with grid size from 1x1x1 to 3x3x3 and then begins to follow the expected trend and decrease with increasing grid size. Table 1 shows that the accuracy of the Helmholtz Free Energy increases with grid size. The Helmholtz Free Energy converges to a value of -40.93 eV, with the 32x32x32 grid size being the most appropriate to run calculations from, providing the correct Helmholtz Free Energy and a suitable length of time to run the calculation.
For CaO, a similar sized crystal to MgO (lattice constant CaO = 4.811 Å, lattice constant MgO = 4.212 Å)[5], a similar size grid will be required for the calculation of the Helmholtz Free Energy. Faujasite would require a smaller grid size due to its large lattice constant and lithium a larger grid size than MgO due to its small lattice constant.
The Thermal Expansion of MgO
Thermal expansion is the ability of matter to change size, volume and shape in a response to the change in temperature. When a substance is heated the molecules vibrate and begin to move more, and their average separation increases[6]. This thermal expansion is indicated by the Coefficient of Linear Thermal Expansion (CTE). Uniform linear objects have a thermal expansion proportional to temperate over a small range of temperatures. The equation used to calculate the linear CTE is:
where αL=linear CTE, =lattice constant at 0K and =rate of change of lattice constant with respect to temperature
A volumetric CTE can also be calculated using the following equation:
where αV=volumetric CTE, = volume and = partial derivative of volume with respect to temperature at constant pressure.
Quasi-harmonic Approximation:
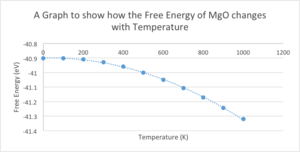
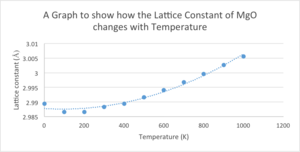
Using the 32x32x32 grid size of MgO the free energy was then optimised. The optimisation opts was set to optimise Gibbs Free Energy and the temperature was varied from 0 - 1000K. The free energy decreases with increasing temperature in a parabolic fashion to the order of 2. This negative correlation can be explained using the equation for Gibbs Free Energy:
where G=Gibbs Free Energy, H=Enthalpy, T=Temperature and S=Entropy
Increasing the temperature decreases the TS term therefore decreasing the Gibbs Free Energy.
The lattice constant increases in a parabolic fashion to the order of 2 with increasing temperature due to the thermal expansion.
Calculation of CTE:
Coefficient of Linear Thermal Expansion
Coefficient of Volumetric Thermal Expansion
It can be seen that the αV is 3.015 times that of the αL. This is because MgO expands at the same rate in all three directions in three-dimensions, it is an isotropic compound. The CFE values are close to those found in literature at and which were calculated using a temperature range close to that used in this experiment at 301.15-1273.15 K[7] (results from experiment give and if calculated from 300-1000K).
The main approximation in the calculations of the thermal expansion is to do with the anharmonic contributions to the harmonic approximation. In order to simplify, the phonon frequencies are set to be volume dependent and so at a higher temperature the anharmonic factor increases. The Born-Oppenheimer Approximation, which assumes that the motion of atomic nuclei and electrons in a molecule can be separated, is another assumption.
This approximation cannot be used when the temperature approaches that of the melting point of MgO due to the new lattice parameters. Mg2+ and O2- begin to behave as separate ions as MgO begins to melt and becomes molten. Therefore the quasi-harmonic approximation cannot be used as it only takes into account linear movement.
For a diatomic molecule with an exactly harmonic potential the bond is not allowed to break and the bond length is fixed around that of its equilibrium length. Therefore the lattice constant will only increase up to a distance just prior to bond cleavage. However, in these calculations the quasi-harmonic approximation allows the bonds to break within MgO and so the lattice constant can, in theory, increase to infinity.
Molecular Dynamics:
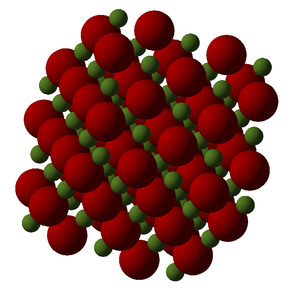
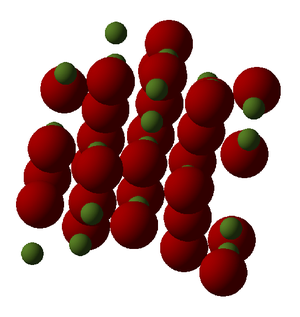
For the final section of this experiment the thermal expansion of MgO was once again calculated, but this time using the molecular dynamics method. This method allows the system to evolve according to Newton's Second Law . The ensemble used was NPT, meaning the amount of substance, the pressure and the temperature were all set to be constant. The timestep at which the vibrations to be sampled was set to be 1 femtosecond (fs) and the number of equilibration steps and production steps were set to 500, with the temperature being avried from 100-1000K. When the number of sampled configurations are sufficiently large, the average calculated is representative for the time averaged system obeying the ergodic hypothesis. A structure containing 32 units and therefore 64 atoms was used in this calculation (Fig 9), and in order to compare the volumes between the quasi-harmonic approximation and the molecular dynamics method, the volumes produced were divided by 32.
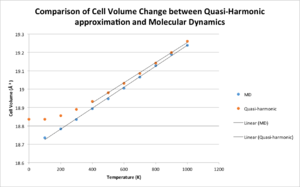
It can be seen that both methods show the same trend, that of the volume increasing with increasing temperature, however throughout the whole temperature range the QHA cell volume values are slightly higher than the MD values.. The QHA becomes the exact same linear trend as the MD results at 400-1000K. At these temperatures the Coefficient of Volumetric Thermal Expansion are very similar:
In the range of 0-400K there is little anharmonicity and so the QHA predicts the thermal expansion more accurately and produces the curved graph. The MD method does not predict this trend at lower temperatures and can only predict a linear trend for the thermal expansion of MgO. The QHA graph is more similar to that found in literature than the MD graph[8].
The 32 unit structure used for the MD calculations is a 2x2x2 lattice of the conventional unit cell. This is a lot smaller than the size used to compute the thermal expansion of MgO using the QHA, and therefore, to have accurate results from the MD method, a larger size should be used.
The MD method allows movement in three dimensions whereas the QHA only allows movement in one dimension. Therefore, at higher temperatures it is expected that the MD method will give much higher volumes than the QHA.
Conclusion
The free energy and phonon dispersions were successfully computed for MgO, and the thermal expansion studied using the QHA and the MD method. All results tended to agree with literature values well and it was found that the QHA gave a more realistic trend for the change in cell volume with respect to temperature at lower temperatures.
References
- ↑ B. J. Alder, T. E. Wainwright. Studies in Molecular Dynamics. I. General Method. The Journal of Chemical Physics. 1959;31: 459-466. Available from: DOI:10.1063/1.1730376
- ↑ X. Wu, W. Li, W. Rui. Effect of temperature on elastic constants, generalized stacking fault energy and dislocation cores in MgO and CaO. Computational Condensed Matter. 2014: 38-44. Available from: DOI: 10.1016/j.cocom.2014.10.005
- ↑ J. A Kaduk, J. Faber. Crystal Structure of Zeolite Y as a function of Ion Exchange. The Rigaku Journal. 1995;12: 14. Available from: http://www.rigaku.com/downloads/journal/Vol12.2.1995/kaduk.pdf
- ↑ M. R. Nadler, C. P Kempter. Crystallographic Data 186. Lithium. Analytical Chemistry. 1959;31:2109. Available from: DOI: 10.1021/ac60156a007
- ↑ D. K. Smith, H. R. Leider. Low-Temperature Thermal Expansion of LiH, MgO and CaO. Journal of Applied Crystallography. 1968;1: 246-249. Available from: DOI: 10.1107/S0021889868005418
- ↑ P. A. Tipler, G. Mosca. Physics for Scientists and Engineers, Volume 1, 6th ed. New York: Worth Publisher;2008
- ↑ J. F. W. Bowles, R. A. Howie, D. J. Vaughan, J. Zussman. Rock-forming Minerals: Non-silicates: oxides, hydroxides and sulphides 2nd ed. London: The Geological Society;2011
- ↑ L.S. Dubrovinsky, S.K. Saxena. Thermal Expansion of Periclase (MgO) and Tungsten (W)to Melting Temperatures. Physics and Chemistry of Minerals. 1999;24(8): 547-550. Available from: DOI: 10.1007/s002690050070
Appendix
| Grid Size | Helmholtz Free Energy (eV) | Accuracy (meV) |
|---|---|---|
| 1x1x1 | -40.9303 | 4 |
| 2x2x2 | -40.9266 | 0.1 |
| 3x3x3 | -40.9264 | 0.1 |
| 8x8x8 | -40.9265 | 0.005 |
| 16x16x16 | -40.9265 | 0.001 |
| 32x32x32 | -40.9265 | n/a |
| 40x40x40 | -40.9265 | n/a |
| 50x50x50 | -40.9265 | n/a |
| Table 1: Raw Data showing change in
Helmholtz Free Energy with Grid Size (Computing Free Energy) | ||
| Temperature (K) | Helmholtz Free Energy (eV) |
|---|---|
| 0 | -40.9019 |
| 100 | -40.9024 |
| 200 | -40.9094 |
| 300 | -40.9281 |
| 400 | -40.9585 |
| 500 | -40.9994 |
| 600 | -41.0493 |
| 700 | -41.1071 |
| 800 | -41.1719 |
| 900 | -41.2440 |
| 1000 | -41.3198 |
| Table 2: Raw Data showing change in
Helmholtz Free Energy with Temperature (Quasi-harmonic Approximation) | |
| Temperature (K) | Lattice Constant (Å) |
|---|---|
| 0 | 2.9894 |
| 100 | 2.9866 |
| 200 | 2.9866 |
| 300 | 2.9883 |
| 400 | 2.9894 |
| 500 | 2.9916 |
| 600 | 2.9941 |
| 700 | 2.9968 |
| 800 | 2.9996 |
| 900 | 3.0026 |
| 1000 | 3.0056 |
| Table 3: Raw Data showing change in
Lattice Constant with Temperature (Quasi-harmonic Approximation) | |
| Temperature (K) | Volume (Å3) |
|---|---|
| 100 | 18.7348 |
| 200 | 18.7833 |
| 300 | 18.8348 |
| 400 | 18.8940 |
| 500 | 18.9476 |
| 600 | 19.0052 |
| 700 | 19.0652 |
| 800 | 19.1282 |
| 900 | 19.1894 |
| 1000 | 19.1894 |
| Table 4: Raw Data showing change in
Volume with Temperature (Molecular Dynamics) | |
