Rep:Mod:DV2412
Experiment 1C
First part: Conformational Analysis using Molecular Mechanics
The use of computational calculations plays a vital role in modern research. It allows scientists to tackle for instance synthesis problems from a different angle, as it provides both a tool to the careful planning and prediction of an experiment and better analysis of the measured data in that same experiment. The experiment described in this report is designed to teach the use of the advanced techniques of computational chemistry applied on different reactions and examples shown in the following sections.
The dimerisation of cyclopentadiene followed by its hydrogenation
Part A: Dimerisation
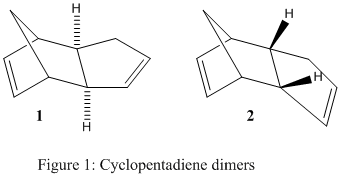
The dimerisation process of cyclopentadiene, undergoing a Diels-Alder type reaction, can yield either the exo 1 or the endo 2 product, in theory. Literature reports however that the endo 2 product is favoured [1]. The consideration and calculation of molecular mechanics in this exercise provided numerical data to explain whether the reaction was under thermodynamic or kinetic control. This data was obtained by using the MM2 force field tool in the ChemBio3D software. Fig.1 shows the two possible dimers 1 and 2. Table 1 provides a summary of all the molecular energies that were considered, providing a better insight into the underlying effects that dictate the total energies for both dimers.
| exo product | endo product | |
|---|---|---|
| Stretch (kcal/mol) | 1.2850 | 1.2508 |
| Bend (kcal/mol) | 20.5805 | 20.8478 |
| Stretch-Bend (kcal/mol) | -0.8381 | -0.8358 |
| Torsion (kcal/mol) | 7.655 | 9.5109 |
| Non-1,4 VDW (kcal/mol) | -1.4174 | -1.5440 |
| 1,4 VDW (kcal/mol) | 4.2334 | 4.3201 |
| Dipole/ Dipole (kcal/mol) | 0.3775 | 0.4476 |
| Total E (kcal/mol) | 31.8764 | 33.9975 |
The data in Table 1 shows a difference in the total energies for the two dimers (about 2 kcal/mol). This difference can be attributed to the torsional strain which originates in the endo dimer 2 from the two rings being too closely attached to each other in space. This means that the exo dimer 1 was seen as the thermodynamic product, due to its lower total energy. This is because of lower Van der Waals repulsions for the exo-dimer. Therefore the formation of the endo dimer 2 can be considered as being under kinetic control. The transition state which forms the endo dimer 2 has to be faster than the transition state for the exo dimer 1 to meet the experimental observations of the dimerisation process. On a molecular level this can be explained when considering the possibilities of orbital overlap. The formation of the endo dimer 2 occurs faster because of a positive and stabilising overlap of the p-orbitals in the transition state. For the formation of the exo product 1 this is not the case as the two cyclopentadiene ring systems are too far apart, leading to no overlap and a longer transition state as there is less stabilisation present [2].
Part B: Hydrogenation
In the next part, two possible ways of hydrogenations were considered for the endo dimer 2, leading to two potential dihydro products. Either the cyclopentene can be hydrogenated 3 or the norborene 4 (Fig.2). Literature predicts the double bond of the norborene to be hydrogenated, hence the formation of product 4 [3]. This observation can also be proven when running computational calculations on the minimised energies of the two possible dihydro derivatives on ChemBio3D using the MM2 tool. Table 2 shows calculations where the same factors as for the previous example were taken into account.
| dihydro derivative 3 (cyclopentene hydrogenation) | dihydro derivative 4 (norborane hydrogenation) | |
|---|---|---|
| Stretch (kcal/mol) | 1.2348 | 1.0965 |
| Bend (kcal/mol) | 18.9384 | 14.5243 |
| Stretch-Bend (kcal/mol) | -0.7609 | -0.5494 |
| Torsion (kcal/mol) | 12.1241 | 12.4974 |
| Non-1,4 VDW (kcal/mol) | -1.5018 | -1.0700 |
| 1,4 VDW (kcal/mol) | 5.7290 | 4.5126 |
| Dipole/ Dipole (kcal/mol) | 0.1631 | 0.1406 |
| Total E (kcal/mol) | 35.9266 | 31.1520 |
According to the data of Table 2, product 4 is thermodynamically more stable which agrees with the result reported in literature. Looking at the different components that make up the total energy, the major difference in contributions between the two molecules is due to the bending (about 4kcal/mol). The reason for this observation is linked to the overall strain of the molecules. Product 4 possesses a lower total energy, as the sp2 carbon atoms of the norborene are more strained than the sp2 carbon atoms of the cyclopentene ring system. The preferred angle for an sp2 conformation is 120º (90.4º in product 3 and 112.5º in product 4 for the carbon atoms that are part of the double bond respectively). This means that the angle in product 4 is closer to the ideal case, hence the molecule is lower in energy, if the ring strain in the norborene part of the molecule is released. This suggests that the hydrogenation of the endo dimer 2 is under thermodynamic control, as the thermodynamically more stable dihydro derivative is formed.
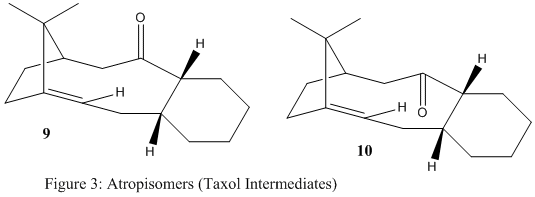
In the synthesis of Taxol which is an important drug in the treatment of ovarian cancer, a key intermediate, either 9 or 10 (Fig.3) is initially synthesised, after it isomerises to the alternative compound with time. In this isomerisation (also known as atropisomerism) the carbonyl group changes its stereochemistry from pointing upwards to pointing downwards. This exercise was about finding out which key intermediate was more stable, giving both quantitative reasons (molecular modeling calculations) and qualitative explanations. A second part of this exercise was to explain the observation that the alkene group of the intermediate only reacted very slowly upon subsequent functionalisation.
It is important to spot the cyclohexane part in both intermediates 9 and 10, as this leads to four possible conformations for each intermediate i.e. 8 conformations in total for the two atropisomers. The four conformations consist of two chair and two twist boat conformations, where the chair conformations are always lower in energy, since the atoms are the furthest apart, leading to less steric hinderance. Table 4 summarises the values for the total energies for the two possible chairs of compound 10 and gives energies for the chair of 9 that is lowest in energy, as well as a twist boat conformation to stress its unfavoured conformation type. This data provides the final conformation for both intermediate 9 and 10, lowest in total energy, that were considered for the final analysis to predict which intermediate was more stable in the synthesis of Taxol.
| Molecule 9 chair | Molecule 9 twist boat | Molecule 10 chair(a) | Molecule 10 chair (lowest energy) | |
|---|---|---|---|---|
| Energytotal in (kcal/mol) | 47.8395 | 53.3043 | 42.6828 | 41.3807 |
The two lowest energies for the two possible chair conformations were 47.8395 kcal/mol (9) and 41.3807 kcal/mol (10). For these two conformations, molecular calculations were run (energy minimisation) using the MM2 tool in ChemBio3D. The results are shown in Table 4.
| Lowest energy intermediates | Molecule 9 | Molecule 10 |
| Stretch (kcal/mol) | 2.7846 | 2.6012 |
| Bend (kcal/mol) | 16.5412 | 10.4195 |
| Stretch-Bend (kcal/mol) | 0.4304 | 0.2906 |
| Torsion (kcal/mol) | 18.2513 | 19.3755 |
| Non-1,4 VDW (kcal/mol) | -1.5526 | -2.171 |
| 1,4-VDW (kcal/mol) | 13.1094 | 12.9199 |
| Dipole/ Dipole (kcal/mol) | -1.7248 | -2.0090 |
| Total E (kcal/mol) | 47.8395 | 41.3807 |
The data in Table 4 shows that intermediate 10 is thermodynamically more stable. The major difference in energy contributions is due to the bending (about 6 kcal/mol) which suggests a difference in the bond angles around the carbonyl group. Less steric strain is experienced in molecule 10 (120º). An unfavourable stereochemistry around the carbonyl group is present in molecule 9 (115º), leading to the preferred formation of intermediate 10 as it is lower in energy and thermodynamically more stable. The angles (120º and 115º) refer to the O-C-C angle around the carbonyl group that changes when the C=O bond flips (9 -> 10).
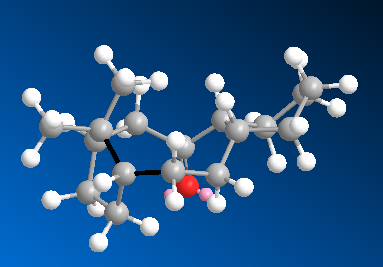
The observation that the alkene group in both intermediates only reacts very slowly can be explained by the theory of hyperstable alkenes. This terminology suggests the unusual stability of olefins next to 'bridge heads' as it is the case in both intermediates in the Taxol synthesis. The two atropisomers do not violate Bredt's rule as the olefin is part of a ring consisting of more than five atoms[4]. Nevertheless, this assumption of the need of five atoms for a ring to be large enough to break Bredt's rule has proven to not be a generalisation and a more accurate hypothesis has been stated. Chemical reactions are dictated by their change in thermodynamic stability with respect to their starting materials and products. Compounds that encounter the presence of an olefin group next to a bridge head are more stable than their hydrogenated alkane derivative, with respect to the olefin functional group[5]. This is due to an increase in strain, as sp3 carbon atoms are, in an ideal case, aligned in a tetrahedral geometry (109.5º), whereas sp2 carbon atoms are found to be planar (120º). Molecular modeling of the two hydrogenated derivatives of products 9 and 10 show that the angles at the carbon atoms of the former olefin are thermodynamically unfavoured after their hydrogenation (e.g. 120.9º for the carbon atom connected to the bridging head in intermediate 10 and shown in the Figure below by the black lines - the neighbouring carbon atom that is part of the double bond would experience an angle of 123.2º). This is largely unfavoured because after the hydrogenation, the carbon is sp3 hybridised, hence a large steric strain. A hydrogenation is therefore unlikely to happen in this case, as the two intermediates in the synthesis of Taxol can be considered as being hyperstable.
Spectroscopic Simulations via the application of Quantum Mechanics
In this exercise, 1H and 13C NMR spectra had to be computed for the molecules 17 and 18 (Fig.4), derivatives of molecules 9 and 10 respectively. Differences in their structures are the addition of both a methyl and a disulphur group.
The results of the computed simulations, using Quantum Mechanics, had to be compared to literature data for the respective spectra of these compounds to determine the accuracy. This analysis had to be done for one of the derivatives only, and the thermodynamically more stable compound 18 was selected. As in the previous exercise the cyclohexane group had to be spotted meaning that there were two different conformations for molecule 18, the boat and the chair conformation. This is important as it had to be calculated, whether different conformations resulted in different 1H and 13C NMR spectra and what conformation literature was referring to.
1H and 13C NMR spectra were computed using the MMFF94s force field tool in the Avagadro software, followed by the prediction of the spectra via GaussView. Table 5 shows the data for the spectra compared to literature values.[6] The results in literature were obtained using a 300MHz spectrometer for 1H NMR and 75MHz for 13C NMR. The solvent used in both cases was deuterated benzene. The computational results in comparison to literature are presented in Table 5 (1H) and Table 6 (13C).
1H NMR


| 1H NMR chair(calculation) | 1H NMR boat(calculation) | Literature comparison |
| 5.88ppm (1H) | 5.97ppm (1H) | 5.21 ppm (m, 1H) |
| 3.41ppm (1H) | 3.62ppm (1H) | 3.00-2.70 ppm (m, 6H) |
| 3.27ppm (1H) | 3.16ppm (1H) | 2.70-2.35 ppm (m, 4H) |
| 3.13ppm (2H) | 3.04ppm (2H) | 2.20-1.70 ppm (m, 6H) |
| 2.90ppm (2H) | 2.94ppm (2H) | 1.58 ppm (t, J=5.4 Hz, 1H) |
| 2.83ppm (1H) | 2.83ppm (1H) | 1.50-1.20 ppm (m, 3H) |
| 2.63ppm (2H) | 2.63ppm (1H) | 1.10 ppm (s, 3H) |
| 2.37ppm (1H) | 2.20ppm (1H) | 1.07 ppm (s, 3H) |
| 2.25ppm (2H) | 2.05ppm (4H) | 1.03 ppm (s, 3H) |
| 2.16ppm (1H) | 1.90ppm (3H) | n/a |
| 2.08ppm (2H) | 1.82ppm (1H) | n/a |
| 2.02ppm (1H) | 1.66ppm (1H) | n/a |
| 1.78ppm (1H) | 1.59ppm (2H) | n/a |
| 1.60ppm (4H) | 1.52ppm (1H) | n/a |
| 1.50ppm (2H) | 1.46ppm (2H) | n/a |
| 1.36ppm (1H) | 1.31ppm (1H) | n/a |
| 1.17ppm (1H) | 1.18ppm (1H) | n/a |
| 0.99ppm (1H) | 1.03ppm (1H) | n/a |
| 0.94ppm (2H) | 0.95ppm (3H) | n/a |
| 0.86ppm (1H) | n/a | n/a |
The first thing that can be observed is that the computed 1H NMR spectra differ from the one in literature. Nevertheless, it can be seen that the data for the boat conformation match the literature data better and hence this conformation can be claimed to be the one reported by Paquette et al. This is striking, since one would have assumed literature to report the most stable i.e. lowest in energy structure.
The reason for the various reported multiplets in literature (m, 4H, 6H) could be due to the difficulty of differentiating between different signals when the ppm-values appear extremely close to each other, when analysing NMR spectra manually. This incident highlights again the advantages and higher accuracy of computational chemistry.
There is no signal for (3H) in the chair conformation in contrast to the boat conformation where a signal appears very close to the literature value. The two (1H)-signals are much closer in comparison to literature for the boat conformation. The signals for (2.20-1.70 ppm (m, 6H)) reported in literature are closest to the ppm values (2.63ppm (1H); 2.20ppm (1H); 2.05ppm (4H)) of the results obtained in the boat conformation, whereby a signal assigned to six hydrogens in literature could have been misinterpreted, as the provided computational data suggests. The ppm values for the computed chair conformation are less accurate. In general, literature and computational experimental chemical shifts show discrepancies, nevertheless the boat conformation provides a more accurate fit compared to the chair structure.
13C NMR
Thereafter, 13C NMR spectra were calculated for the same chair and boat conformation and a similar comparison of the results is outlined in Table 6.


| 13C NMR boat (calculation) | 13C NMR chair (calculation) | Literature comparison |
| 214.26ppm | 217.19ppm | 211.49 ppm |
| 146.46ppm | 145.97ppm | 148.72 ppm |
| 120.66ppm | 119.80ppm | 120.90 ppm |
| 92.20ppm | 89.72ppm | 74.61 ppm |
| 59.67ppm | 58.41ppm | 60.53 ppm |
| 58.87ppm | 56.77ppm | 51.30 ppm |
| 55.97ppm | 55.62ppm | 50.94 ppm |
| 49.29ppm | 49.85ppm | 45.33 ppm |
| 48.52ppm | 46.89ppm | 43.28 ppm |
| 45.35ppm | 43.91ppm | 40.82 ppm |
| 43.76ppm | 43.47ppm | 38.73 ppm |
| 42.92ppm | 37.27ppm | 36.78 ppm |
| 37.29ppm | 37.04ppm | 35.47 ppm |
| 31.42ppm | 29.03ppm | 30.84 ppm |
| 28.16ppm | 28.30ppm | 30.00 ppm |
| 26.21ppm | 26.50ppm | 25.56 ppm |
| 25.23ppm | 24.38ppm | 25.35 ppm |
| 24.80ppm | 24.02ppm | 22.21 ppm |
| 22.81ppm | 22.82ppm | 21.39 ppm |
| 22.15ppm | 20.50ppm | 19.83 ppm |
The analysis of the data in the 13C NMR spectra follows a similar trend to the 1H NMR spectra before. The chemical shift values for the boat conformation are much closer to the literature values which supports the hypothesis about the correct conformation stated with respect to the data from the proton NMR. In particular the values (120.66ppm -> 120.90(lit.); 120.66 -> 120.90 ppm(lit.); 25.23ppm -> 25.35 ppm(lit.)) show how close most of the chemical shifts are. In contrast to the proton NMR, the computed values of the boat and chair conformation are very similar and close in magnitude for the two conformers (22.81ppm and 22.82ppm; 28.16ppm and 28.30ppm). This is because changes in conformation affect the location of hydrogen atoms much more dramatically as opposed to carbon atoms whose 3D alignments stays rather constant, hence chemical shifts are very similar for different conformations.
Second part: Analysis of the properties of the synthesised alkene epoxides
Both the Shi and the Jacobsen asymmetric epoxidation catalysts were studied in the following exercises: The catalyst's crystal structure, product (=epoxide) NMR spectra, absolute configuration and interactions in the active site were all investigated. The two epoxides styrene and 1,2-dihydronaphthalene were modeled as part of this experiment.
Crystal structures of the two pre-catalysts
Using the Conquest program in the Cambridge Crystallographic Database, 3D structures of both pre-catalysts 21 and 23 were generated via the Mercury program. Different aspects regarding their chemical structure and reactivity were analysed for both catalysts.
The Shi catalyst (21)
Shi anomeric effct |
In the case of the Shi catalyst the C-O bond lengths for any anomeric centre were measured. Anomeric centres appear in the presence of oxygen atoms in a ring system. The lone pair of the oxygen can donate electron density to the antibonding orbital of the carbon atom (nO -> σ*C-O), thereby triggering the formation of a C=O double bond which leads to bond weakening/shortening. Hence, one C-O bond becomes smaller and the other one remains as the larger one. This concept was observed when investigating the crystal structure of the Shi catalyst. Two carbon atoms were regarded with respect to the anomeric effect. For the one located in the 5-membered ring, a difference in the two O-C bonds was observed (0.141nm and 0.144nm) because of the reasons explained. In the case of the 6-membered ring, the two C-O bond lengths were of the same length, due to a lack of antiperiplanar arrangement which is a key condition for the anomeric effect to occur as a correct orbital arrangement needs to be present.
Further analysis of the structure shows that the Shi catalyst can only facilitate an epoxidation reaction of E-alkenes. This fact makes more sense when considering steric interactions, since the two 5-membered rings attached to the 6-membered ring in the catalyst structure, point upwards and downwards respectively, hence only making it possible for an E-alkene to approach to avoid any steric clashes.
The Jacobsen catalyst (23)
Shi anomeric effct |
In the analysis of the Jacobsen catalyst the close approach of the two adjacent t-butyl groups was investigated.
The distances between the hydrogen atoms of the two t-butyl groups were measured to be 0.264 and 0.253 for the shortest cases. These distances can therefore be considered as very short (almost electronic interactions). A result of this can be observed in the reactivity of the Jacobsen catalyst, reacting predominantly with Z-alkenes because the four t-butyl groups block the approach from any side other than via the cyclohexane substituent. Only Z-alkenes avoid steric clashes, since they can be considered as structured in a compact manner, and can therefore approach the metal (Mn) in a controlled and favoured way.
NMR analysis of the epoxides
The structures of the four epoxide products
(R,S)-1,2-dihydronaphtalene oxide
(S,R)-1,2-dihydronaphtalene oxide
were drawn in Avogadro, their energies were minimised and both 13C NMR and 1H NMR spectra were generated. It was recognised that spectra for enantiomers appeared to be identical. Therefore, arbitrarily only the spectra for one enantiomer each, were considered in the next part.
Styrene oxide
Both styrene oxide products are formed via the Jacobsen catalyst (Z-selective). The table below indicates the 1H NMR and 13C NMR for one of the enantiomers. Literature values were found for the 1H NMR but only limited and unreliable literature data was found in the case of the 13C NMR. The solvent used in both literature and the calculations was Chloroform, at 500MHz.


| 1H NMR styrene oxide | 1H NMR styrene oxide (lit.)[7] | 13C NMR styrene oxide |
| 7.49ppm (4H) | 7.4-7.3ppm (5H,m) | 135.11 ppm |
| 7.30ppm (1H) | 3.83ppm (1H,dd) | 124.12 ppm |
| 3.66ppm (1H) | 3.12ppm (1H,dd) | 123.41 ppm |
| 3.12ppm (1H) | 2.77ppm (1H,dd) | 122.96 ppm |
| 2.54ppm (1H) | n/a | 118.27 ppm |
| n/a | n/a | 54.02 ppm |
| n/a | n/a | 53.49 ppm |
A great match between the computed and in literature reported proton NMR can be observed. The first chemical shift (7.4-7.3ppm) must have been wrongly annotated, as also shown by the computed data, where two different chemical shifts were calculated, giving rise to a (4H) and (1H) region. This must be, as already mentioned in the previous NMR analysis, due to the fact that the ppm values are extremely close and must have overlapped, hence difficult to assign without computational tools. The same amount of peaks were recorded both in literature and via the computational way.
Dihydronaphthalene oxide
The other alkene product to be investigated via NMR was dihydronaphthalene oxide. Its formation proceeds via the Jacobsen catalyst (Z-selective).


Both 1H NMR and 13C NMR were calculated and compared to literature[8]. NMR spectra were recorded in Chloroform solvent at 500MHz
| 1H NMR dihydronaphthalene oxide | 1H NMR dihydronaphthalene oxide (lit.) | 13C NMR dihydronaphthalene oxide | 13C NMR dihydronaphthalene oxide |
| 7.49ppm (1H) | 7.28ppm (1H,d) | 133.84 ppm (1H) | 136.7ppm |
| 7.39ppm (2H) | 7.08-7.17ppm (1H,m) | 130.38 ppm (1H) | 132.6ppm |
| 7.20ppm (1H) | 6.98ppm (1H,d) | 125.56 ppm (1H) | 129.5ppm |
| 3.59ppm (1H) | 3.74ppm (1H,d) | 123.83 ppm (1H) | 128.4ppm |
| 2.88ppm (1H) | 3.62ppm (1H,m) | 123.42 ppm (1H) | 128.4ppm |
| 2.27ppm (1H) | 2.68 (1H,m) | 121.44 ppm (1H) | 126.1ppm |
| 2.22ppm (1H) | 2.44 (1H,m) | 56.43 ppm (1H) | 55.1ppm |
| 1.56ppm (1H) | 2.30 (1H,m) | 54.83 ppm (1H) | 52.7ppm |
| n/a | 1.65 (1H,m) | 28.04 ppm (1H) | 24.4ppm |
| n/a | n/a | 24.94 ppm (1H) | 21.8ppm |
In the case of both NMR spectra, a good match was attained between the calculated and the literature data. The data is sometimes not highly precise i.e. there are some differences in chemical shifts, nevertheless, the trend is correct for both NMR spectra, making it an accurate match. As explained before, misassignment of NMR data with respect to multiplicity is common in literature, and computational data is able to clarify in these instances.
Assigning the absolute configuration of the epoxides
As seen in the previous exercise, different enantiomers of the epoxides can be formed and hence there must be a way to differentiate between the two possible products. This exercise calculated the optical rotations of the epoxide products and considered transition states of one other epoxide formation, whereby the enantiomeric excess was calculated.
Calculation of the chiroptical properties using HPC
The first part compared computed optical properties of styrene and dihydronaphthalene (considering the two enantiomers in both cases) with literature values as long as these were provided. Optical properties were obtained when reentering the optimised output from the NMR exercises before, into the HPC system. Literature often gave many results, depending on temperature and wavelength, which made it difficult to comment on the accuracy of the values. Table 9 shows the computed results. Values for the optical rotations change in sign between enantiomers.
| (S)-styrene oxide[9] | (R)-styrene oxide[10] | (S,R)-dihydronaphthalene oxide[11] | (R,S)-dihydronaphthalene oxide[12] |
|---|---|---|---|
| -168.88 deg | 219.97 deg | -222.95 deg | 227.70 deg |
Chiroptical properties of trans-β-methyl styrene transition states (Shi catalyst)
In the second part of this exercise the transition states of trans-β-methyl styrene (Shi catalyst) were investigated for the epoxidation mechanism. The state with the lowest total energy was selected. The difference of the two energy values for an interconversion between the respective enantiomers [(R,R) to (S,S)] was calculated (ΔG) and with the formula ΔG=-RTlnK the equilibrium constant K could be obtained (R=8.314 J/Kmol; T=298K). This helped to obtain a value for the enantiomeric excess (EE) of the two enantiomers for the two catalytic reactions.
Shi catalyst transition states
| Gibbs free energy (ΔG) | equilibrium constant (K) |
|---|---|
| 20.218 kJ/mol | -3500 |
Table 10 provides the extracted values for the Gibbs free energy and the conversion to a value for the equilibrium constant for above stated enantiomeric transition(ΔG=-RTlnK). The enantiomeric excess can be worked out using the formula 'EE = (K-1)/(K+1) x100' to obtain a percentage value. In the case of the (S,S) to (R,R) trans-β-methyl styrene transition, the enantiomeric excess is 99.94%
Comments
The transition state considered is positive, meaning that the reverse transition would be negative i.e. thermodynamically favoured and proceed spontaneously. The values for the equilibrium constant is large and negative which highlights the same conclusion regarding the thermodynamics. For the calculation of the enantiomeric excess, the modulus of the value for 'K' was considered, resulting in the (S,S) enantiomer to be the preferred structure. The lowest transition state was the one in which the oxygen is detached and for the first time bonded to the alkene, eventually forming the epoxide functional group. This process was studied in more detail in the following two subsections.
Non-covalent interactions (NCI) in the active site ((S)-styrene oxide)
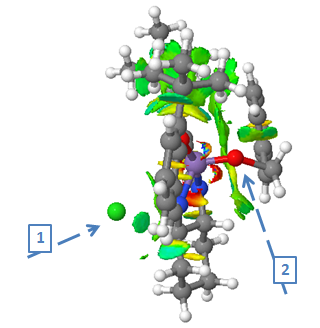
The figure shows the 1st transition state in the epoxide formation of styrene via the Jacobsen catalyst. The two arrows indicate the relevant atoms that play the key role in this transition state. It can be seen that the metal (Mn) is no longer bonded to the Chlorine atom (green atom, 1st arrow), as it is now connected to an oxygen atom (2nd arrow) which links to the alkene centre of the styrene molecule to become the asymmetric centre once the epoxide is formed. The oxygen atom (2nd arrow) is the one that will eventually detach from the metal (Mn) and form the epoxide functional group of (S)-styrene oxide. For a better understanding of the figure above, the colour coding of the free space around the active site stands for (blue = very attractive, green = mildly attractive, yellow = mildly repulsive and red = strongly repulsive). In the case of the transition state above, green colour can be detected, meaning that the oxygen atom is mildly attracted by the carbon atoms which is in favour of the epoxide formation. Little red colour can be spotted in close proximity of the metal (Mn), showing a repulsive force towards the oxygen atom, again favouring the epoxide formation.
Electronic topology (QTAIM) in the active site of (S)-styrene oxide
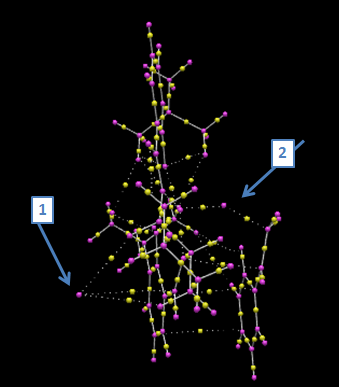
The electronic topology was calculated for the same transition state of the same epoxide product as was the NCI analysis (=(S)-styrene oxide). This exercise provides a better insight into the electronic interactions of the respective atoms, involved in the transition state. As before, the now disconnected Chlorine atom (1st arrow) can be observed to still have minor electronic interactions. The 2nd arrow points again at the oxygen atom which is in this transition state bound to both the styrene molecule, as well as the Jacobsen catalyst. This is the active site of the epoxidation reaction, where the oxygen atom is detached from the Mn atom and becomes fully bonded to the carbon atom, triggering the formation of the epoxide end-product. Finally a low but present electronic interaction of the styrene delocalised ring system and the opposite delocalised ring system of the Jacobsen catalyst can be observed which most probably enhances the kinetics of the transition state and thereby the overall reaction, making the epoxidation an 'easier' and faster process. The two arrows therefore highlight the bond critical points (BCP) relevant for this transition state. Finally, the Chlorine, as well as as the beneze ring of the styrene molecule only experience electronic interactions with the catalyst, whereby the oxygen is covalently bonded to both the alkene and the catalyst in this specific moment captured in this transition state.
Suggested new candidate for future investigation
The suggested new candidate (epoxide) for future investigation was cis r (+) pulegone oxide. This compound has an optical rotation of [alpha] = 853.925deg at 25°C in ethanol (c=0.03) for 324nm. Its molecular weight is 168.236 g/mol. Its alkene precursor can be purchased online, since it is a natural product, used in the human body (liver) but it is also present in other biological processes. The reaction scheme (above) shows how this epoxide could be made. The alkene part of the pulegone derivative is symmetrical i.e. neither cis nor trans really, making it even more interesting to study whether the epoxidation process would be triggered via either the Shi or the Jacobsen catalyst.
References
- ↑ Cristol, S. J.; Seifert, W. K.; Soloway, S. B. J. Am. Chem. Soc. 1960, 82, 2351
- ↑ Caramela P.; Quadrelli P.; Toma L. J. Am. Chem. Soc. 2002, 124 (7), pp 1130-1131 DOI:10.1021/ja016622h
- ↑ G. Liu , Z. Mi , L. Wang , and X. Zhang, '"Kinetics of Dicyclopentadiene Hydrogenation over Pd/Al2O3 by catalyst", Ind. Eng. Chem. Res., 2005, 44(11), 3846-3851. DOI:10.1021/ie0487437
- ↑ Prelog, V.; Barman, P.; Zimmermann, M. Helv. Cbim. Acta 1949, 32, 1975, 14, 528. 1284. Ibid. 1950, 33, 356. Prelog, V. J. Chem. SOC. 1950, 420
- ↑ W. F. Maier, P. Von Rague Schleyer, J. Am. Chem. Soc., 1981, 103, 1891. DOI:10.1021/ja00398a003
- ↑ L.A. Paquette, N.A. Pegg,D. Toops, G.D. Maynard and R.D. Rogers,J.Am.Chem.Soc.,1990,112,277-283.DOI:10.1021/ja00157a043
- ↑ J.M.Vega-Perez, I.Perinan, M. Vega-Holm, C.Palo-Nieto, F.Iglesias-Guerra;Tetrahedron,2011,67,7057-7065.
- ↑ K.Smith, C.Liu, G.El-Hiti,Org.Biomol.Chem.,2006,4,917.
- ↑ Vilf D. (S)-styrene ORP,D-Space,2014DOI:10042/27258
- ↑ Vilf D. (R)-styrene oxide ORP,D-Space,2014DOI:10042/27261
- ↑ Vilf D. (S,R)-dihydronaphthalene oxide ORP,D-Space,2014DOI:10042/27259
- ↑ Vilf D. (R,S)-dihydronaphthalene oxide ORP,D-Space,2014DOI:10042/27260


