Rep:Mod:DS4113 MGO
In this computational experiment, some thermodynamic properties (namely the Helmholtz Free Energy, Entropy and Heat Capacity at a constant volume) in the region from 0 to 1000 K at 0 GPa, as well as some additional ones - the DOS curve, of crystalline MgO were calculated using two different methods, the Quasi-harmonic approximation, and molecular dynamics. Understanding the behaviour of MgO under range of different conditions is vital for further advances in geological sciences, as Mg and O are the two most abundant species in Earth's mantle.[1] It is often considerably hard to obtain experimental data due to the extreme conditions in the Earth's mantle, so it is often the case that theoretical calculations are the only tool how to broaden our understanding.
All calculations were done on college computers, using Red Hat Enterprise Linux 6, DLV and GULP. They were generally, except for the molecular dynamics calculations, not very computationally demanding, and the results were usually obtainable in a matter of seconds. The structural files of the MgO system had been provided to us.
It was found that the results and trends obtained by both methods matched experimental data quite well.
The Quasi-harmonic Approximation
This simple, yet quite powerful, approximation assumes that the phononic vibrations in the crystal do not interfere with each other, so one can effectively treat them as independent harmonic oscillations. From this fact, the energy levels of the system can be established, and then, using computational power, the system's partition function, Z, can be calculated. It is then a matter of simple statistical thermodynamics to obtain the Helmholtz Free energy, from which all other thermodynamic properties can be calculated:
where
then
Knowing F, S and P, other thermodynamic functions, such as enthalpy, the Gibbs Free Energy, etc., can be calculated:
As a general rule, this approach is not suitable for very low or very high temperatures. At very low temperatures, the quantum effects start to play a more dominant role, this has to be often corrected which is beyond the scope of this experiment. At very high temperatures, the calculated properties deviate from the actual ones as well. To ensure the validity of the results of the Quasi-harmonic approach, the calculated thermal expansivity coefficient is often a posteriori compared to the experimental values. This idea shall be discussed more deeply bellow.
The DOS Curve
The Density of States (DOS) can defined as the number of states in a particular region around a a particular energy. When plotted, it often forms a continuous curve, and can tell us more about the distribution of levels with energy, which can be used to predict the behaviour of the system.
Ideally, to obtain precise results, one should sum over all possible k-points. Practically, that would be very computationally demanding, so often we only sum over a certain number of k-points which if often enough to obtain a good picture of the behaviour of the system.
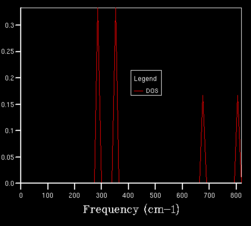
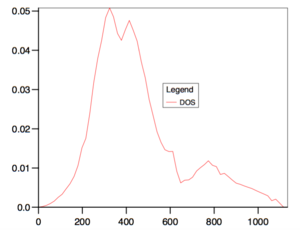
For the DOS curve, as the density of the grid of k-points increases, the DOS curve becomes more smooth. Bellow, two extreme cases can be seen (1x1x1 grid on the left -taken from the script[2], 50x50x50 on the right).
Fig. 1. The effect of the grid density on the DOS curve.
We can see that even though the DOS calculated for the 1x1x1 grid does not give us much useful data (results based on only one k-point (0.5000, 0.5000, 0.5000)), it hints on where the main to peaks in the actual DOS curve are (region around and ). It was found that grid sizes from 20x20x20 up gave almost smooth DOS curves, with the main peaks clearly visible, but with random, although minor, fluctuations along the curve. Due to limited computational power, grid size of 10x10x10 was initially used in the next part. Later, a 50x50x50 grid (biggest one that did not result in an error due to bad memory allocation) was used and the properties were recalculated. Both results were compared and it was found that the obtained HFE were the same to 5 significant figures.
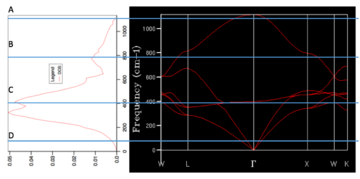
The calculations returned the graphs of phonon dispersion in our system. There is a relationship between the dispersion and the phonon DOS curve (Fig. 1.2., the graph of phonon dispersion taken from the script[2]). Qualitatively speaking, the higher density of 'lines' in some particular region of energy results in higher DOS as the lines in the graph of phonon dispersion represents energy states.
It can be expected that similar sizes should be appropriate for a similar oxide, as only the mass of of the metal changes in the calculations, the symmetry of the system remains the same, resulting in DOS of the approximately same accuracy. It was attempted to run the calculations using CaO, instead of MgO, but the calculations resulted in an error due to the Ca cations now have any positive charge, an obstacle that I was not able to overcome.
As for zeolites, their structure is more complicated, compared to simple MgO or CaO crystals, so it could be expected that higher grid density would be needed to collect all the necessary vibrations.
Situation for Li is not very clear, as I would expect lower grid density could be enough to sample over a regular metallic lattice with only one type of atoms. However, there could be some unexpected issues with the structure not being simply crystalline, but having a metallic character.
The Helmholtz Free energy, Heat Capacity and Entropy
In the next part of the experiment, the dependence of the Helmholtz free energy (HFE) at 300 K and 0 GPa on the grid density was calculated. The value of HFE for 1x1x1 grid was found to be -40.930301 eV, after increasing the density to 2x2x2, the value overshot to -40.926609 eV, and then gradually reached a stable value of around -40.92648 eV, as the grid size was increased up to 15x15x15. This can be seen bellow (Table 1, Fig. 2). Accuracy is included for comparison.
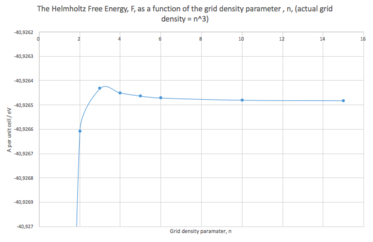
| Grid density | HFE per cell / eV | Accuracy / eV |
|---|---|---|
| 1x1x1 | -40.9303(0) | 0.1 |
| 2x2x2 | -40.9266(09) | 0.01 |
| 3x3x3 | -40.9264(32) | 0.001 |
| 4x4x4 | -40.9264(5) | 0.001 |
| 5x5x5 | -40.9264(63) | 0.001 |
| 6x6x6 | 40.9264(71) | 0.001 |
| 10x10x10 | 40.9264(8) | 0.001 |
| 15x15x15 | 40.9264(82) | 0.001 |
The effect of the grid density on entropy has been evaluated as well (see Fig. 3).
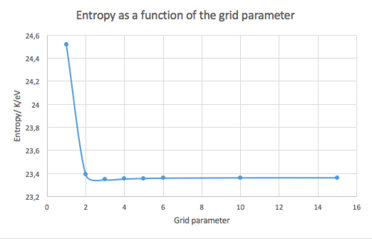
It can be seen that in this case, the density needed is even lower, and the system reaches an approximately constant value at even the 2x2x2 configuration. Nevertheless, as above, the value of entropy probably gets more accurate with rising grid density.
In the next part, the HFE, entropy and heat capacity were calculated as a function of temperature in the range 0 – 1000 K. Initially grid density of 10x10x10 was used. Calculations were then re-run using 50x50x50 grid density to see what, if any, effect would the change have on the thermodynamic properties.

First, lets examine the Helmholtz Free Energy, F. The plotted dependence can be seen in Figure 4. For raw data, see Appendix 1.
From thermodynamics, we know that F = U – TS. As the shape of the calculated dependence is somewhat hyperbolic, one could assume that the entropy itself is, at least in the region in discussion, also approximately linearly dependent on , giving the shape overall. Our discussion, however, does not need to stop here, as during the calculations, the entropy itself was calculated as well. The graphical dependence of entropy and heat capacity (all presented values of heat capacities are at constant volume) on temperature can be seen bellow (Fig. 5). The graph includes experimental data from literature as well. It can be seen that the computationally obtained data compare quite well with the calculated heat capacity reaching closely the actual experimental values as the temperature increases. As for entropy, there was a constant absolute difference between the computational and experimental values of about 0.04 meV/K.cell which was independent of temperature.
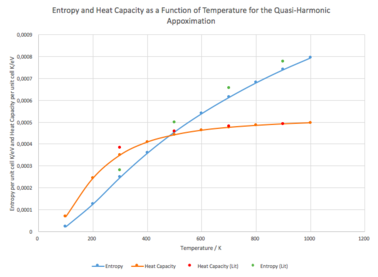
One can mention that the entropy actually really does rise somewhat linearly with temperature. There is a thermodynamic expression for the behaviour of entropy with temperature as well:
for system doing non-expansion work, this translates into
However, the above expression assumes constant heat capacity, which, at least at lower T, is not the case.
The behaviour of the heat capacity is as expected (see Einstein solid). As the temperature rises to infinity, the heat capacity (for our system) should be approaching per cell (0.51794 meV/K.cell). We can see that this theoretical conclusion agrees with the computational data (0.497 meV/K.cell at T = 1000 K), as well as the literature ones.
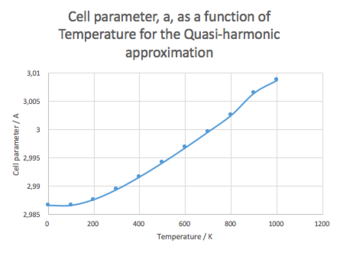
The also calculations yielded the value of optimal lattice size at each temperature. As expected, the lattice size grows with growing temperature (see Fig. 6).
At lower temperatures, the growth of the lattice parameter is slow, but as the temperature increased, the lattice parameter started to grow more rapidly. At temperatures above 600K, it growth became approximately linear.
Knowing the difference in temperatures, and the differences in lattice volumes, approximate coefficients of thermal expansions:
Physically, temperature is related to the average kinetic energy of the system. As the temperature increases, the kinetic energy increases as well. This results in molecules moving faster and having, on average, greater separation. Macroscopically this results in the material having a larger volume.
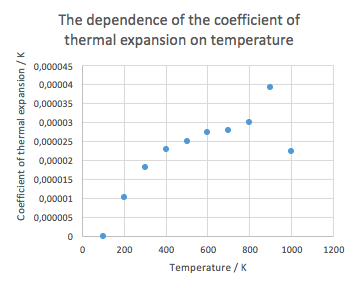
The results are, however, only approximate, as the difference between the temperatures used to calculate the coefficient was 100 K. Ideally the difference should be as small as possible.
The coefficients are clearly dependent on the temperature. At lower temperatures, the value of the coefficient grows rapidly, but at higher temperatures it seems to plateau. There is a large fluctuation at T = 900 K and T=1000 K. There could be two reasons behind it. It could really indeed by a random fluctuation, or, as we are nearing to the decomposition temperature (MgO is only stable at T bellow 700 K), it could mark some chemical/structural changes of the system. The former is probably closer to the truth, as the quasi-harmonic picture is rather static. This could also possibly mean that the quasi-harmonic approach is not very suitable for studying phase transition phenomena.
Interestingly enough, the calculated values were between 40 (at 300 K) to 25 (at 800 K) % smaller compared to the literature.[3] This is the lowest accuracy encountered during this experiment, as the other calculated properties matches the experimental ones quite well.
The Molecular Dynamics Results
'Grant and Richards defines molecular dynamics simply as ‘simulation of motions of a system of particles (atoms) with respect to the forces which are present’[4]. If we consider a system of particles, each at some position, r, and under an influence of some potential field (Buckingham repulsive potential in our case, but there are many others), we can then easily calculate the forces that the particles exert on each other. Using simple Newtonian mechanics, it can be shown that if we know the acting forces and initial velocities/momenta, as well as initial positions, we can calculate a dynamic evolution of the given system with time:

If we compare this result to the Taylor series for discplacement:

We can mention, that our solution only contains the first 3 terms, but not the rest. Generally, our solution is correct for infinitesimally small time-steps, but as the time-step gets bigger, this introduces some level of errors.[4]
Also, we assume that during the whole duration the step, the acceleration is constant, which, once again, introduces some errors. This error can be reduced either by using smaller time-steps, or, as it is the case for this experiment, using a so-called Leapfrog Verlet method[4]
The Leapfrom Werlet method calculates the avegare acceleration between t –dT and t+dT :

As , we can substitute back into the first equation to get:

In this equation, we don’t use both velocity and acceleration at the same time, which minimizes the errors.[4]'[5]
In our calculations, the system was set up and allowed to equilibrate (500 steps with time-steps of 1 fs), after which dynamical properties of the system were collected (again 500 steps with time-steps of 0.001 ps).
'When setting-up a calculation, it is importnant to decide what time-step to use. Generally, larger steps allows the system to equilibriate quicker (less steps needed), but, as discussed above, introduces some errors, which can even become significant (at large enough time-steps). Using smaller time-steps results in both more accurate and more precise results, but the system takes longer to equilibrate. It is also more time-demanding to run the simulation for longer times, as the number of steps needed to calculate is larger. It is therefore important to find a balance between these two extremes.'[5]
The calculations were run at 4 different temperatures: 300 K, 400 K, 500 K and 900 K. At each temperature, the values of the properties fluctuated, but the averaged results converged to a stable value in approximately 0.1 ps, and remained stable during the rest of the run.
The system consisted of 32 unit cells (64 atoms). Generally, more atoms should yield more accurate results, but the computations become more power-demanding. Based on the findings in the DOS part of this experiment, somewhere between 10x10x10 to 20x20x20 unit cells should be needed to give accurate results, as each additional unit cell represent an additional k-point that can be sampled in the MD simulations.
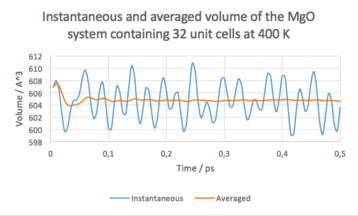
Among others, the calculations yielded averaged cell volumes. Results can be seen bellow.
| Temperature / K | Unit cell volume / |
|---|---|
| 300 | 18.8406 ± 0.0515 |
| 400 | 18.8940 ± 0.0889 |
| 500 | 18.9476 ± 0.0520 |
| 900 | 19.1894 ± 0.0094 |
Comparison between results obtained by Quasi-Harmonic approximation, dynamic calculations and experimental data can be seen bellow. As more data was available, basic error analysis for the dynamic calculations was done as well.

The calculations were run at p = 0 GPa, the experimental data were collected at p = 0.0001 GPa.[3] This could potentially affect the cell volumes gathered by experimental means, but the effect should not be very large. From Figure 9, it can be seen that as the temperature gets higher, the difference between the dynamic calculations and quasi-harmonic calculations becomes smaller, and both results become more accurate with respect to the experimental data. In the whole region of our focus, 300 – 900 K, the dynamic calculations yielded results closer to the experimental ones.It should be noted, however, that, as opposed to simple quasi-harmonic calculations, had to be left running overnight as they are more computationally demanding. It may not be a problem in our case, but in cases of more complex system containing more particles, this could become an obstacle. Thus, as usual in computational chemistry, there is some interplay between the accuracy of the results and the computational power needed to obtain the results. As for the expansion coefficients, only two could be calculated, as due to the method being computationally very demanding, a smaller range of temperature could be studied. Results can be seen in Table 3. Clearly, the results obtained using molecular dynamics calculations are more accurate, yet still obviously lower than the experimental values. As the temperature gets higher, one could expect that the MD calculations would should a transition to the liquid phase, as there is some dynamics in the system. The quasi-harmonic approximation is not expected to show any phase transitions.
| Temperature /K | [3] | ||
|---|---|---|---|
| 300 | 31.2 | 22.7634 | 28.3628 |
| 400 | 35.7 | 24.8244 | 28.3395 |
Conclusion
In this experiment, numerous thermodynamic properties of MgO were calculated using a simple quasi-harmonic approach as well is using molecular dynamics simulations. It was found that grid densities of 5x5x5 should yield reasonable accurate results, but as it is always more accurate using higher densities, a grid density of 10x10x10 was used throughout the experiment.
Is the next part, the DOS curve was calculated and plotted, showing three prominent peaks (at approximately 396, 468 and 792 cm-1). For comparison, DOS curves calculated using the grid densities of 1x1x1 and 50x50x50 were showed and the effect of the grid density on the quality of the curve explained.
For the 10x10x10 grid density, entropy, heat capacity and Helmholtz free energy were calculated in the region between 0 to 1000 K. It was found that the calculated values matched literature values quite well. Single cell volumes, lattice parameters and the thermal expansion coefficients were calculated as well, but it was found that these deviated from the literature values quite greatly (calculation results 25-40% lower than literature values).
In the last part, the cell volumes, and consequently the thermal expansion coefficients, were calculated using molecular dynamics simulations. It was found that the volumes were larger than the literature values, yet closer to reality compared to the quasi-harmonic approach. The thermal expansion coefficients were again lower that the ones found in literature.
Next time doing the experiment, I would:
- re-run the quasi-harmonic approximation calculations in the region between 900-1000 K to find what was behind the fluctuation of the thermal expansion coefficient in that region.
- try solve the problem that caused problems with creating my our systems, so that I could study the CaO and Li systems, to back up my speculations.
- try to find a structure file for the zeolite mentioned in the script, again to back up my speculations.
- try to run the MD simulations at larger temperature scale to examine the behaviour of the system as it undergoes phase transition from solid to liquid.
Overall, I've found this experiment very enjoyable. The script was very detailed and easy to understand. The calculation set-up was easy as well, yet it provided very useful and accurate results.
Thanks.
Appendix 1 - Raw Data
Quasi-harmonic approximation
| Temperature / K | HFE per unit cell / eV | a / A | Volume / | Entropy per unit cell / eV/K | Heat Capacity per unit cell (const. vol.) / ev/K | |
| 0 | -40.90097751 | 2.986564 | 18.837 | |||
| 100 | -40.90241883 | 2.986564 | 18.837 | 1.00865E-05 | 0.000022 | 0.000068 |
| 200 | -40.90937571 | 2.987609 | 18.856 | 1.80314E-05 | 0.000126 | 0.000244 |
| 300 | -40.92812222 | 2.989396 | 18.89 | 2.27634E-05 | 0.000248 | 0.00035 |
| 400 | -40.95859089 | 2.991637 | 18.933 | 2.48244E-05 | 0.000359 | 0.000409 |
| 500 | -40.9994319 | 2.994145 | 18.98 | 2.73973E-05 | 0.000456 | 0.000442 |
| 600 | -41.04931063 | 2.996834 | 19.032 | 2.78478E-05 | 0.00054 | 0.000463 |
| 700 | -41.10711372 | 2.999658 | 19.085 | 2.98664E-05 | 0.000614 | 0.000476 |
| 800 | -41.17188564 | 3.002605 | 19.142 | 3.91809E-05 | 0.000681 | 0.000485 |
| 900 | -41.24301122 | 3.00653 | 19.217 | 2.2376E-05 | 0.000741 | 0.000492 |
| 1000 | -41.31984077 | 3.0088 | 19.26 | 0.000795 | 0.000497 |
MD Simulations
Literature
- ↑ Jackson, I. (2000). The Earth's mantle. Cambridge: Cambridge University Press.pp. 311–378.
- ↑ 2.0 2.1 Ch.ic.ac.uk, (2016). Calculating the phonon modes of MgO. [online] Available at: http://www.ch.ic.ac.uk/harrison/Teaching/Thermal_Expansion/phonons.html [Accessed 25 Feb. 2016].
- ↑ 3.0 3.1 3.2 Anderson, O. and Zou, K. (1990). Thermodynamic Functions and Properties of MgO at High Compression and High Temperature. Journal of Physical and Chemical Reference Data, 19(1), p.69.
- ↑ 4.0 4.1 4.2 4.3 Grant, Guy H, and W. G Richards. Computational Chemistry. Oxford [England]: Oxford University Press, 1995. Print.
- ↑ 5.0 5.1 Saman, D. (2016). Liquid Simulations. [online] Available at: https://wiki.ch.ic.ac.uk/wiki/index.php?title=Mod:DS4113_LIQ [Accessed 25 Feb. 2016]. - In the MD part, I've cited few things from my previous lab report on MD.


