Rep:Mod:DJW300
Compulsory Section
Introduction
Inorganic computational module David Wilson
Structure Optimisations
Calculations performed
Two Calculations were performed to optimise the BH3 geometry, both identical but the second was carried out using the output of the first with a finer basis set (6-31G(d,p) instead of 3-21G). This allowed a more accurate optimisation of the structure.
Two more Calculations were carried out on similar structures, one where the ligands were changed from H to Br atoms and then another where the central atom was also changed, from B to Ga. The GaBr3 was carried out using pseudo potentials and the LANL2DZ basis set whereas the BBr3 calculation was done using different basis sets for each atom.
All calculations carried out converged.
| Calculation | BH3 (1) | BH3 (2) | GaBr3 | BBr3 |
|---|---|---|---|---|
| File type | .log | .log | .log | .log |
| Calculation Type | FOPT | FOPT | FOPT | FOPT |
| Calculation Method | RB3LYP | RB3LYP | RB3LYP | RB3LYP |
| Basis Set | 3-21G | 6-31G(d,p) | LANL2DZ | Gen |
| Final Energy (au) | -26.46226429 | -26.61532358 | -41.70082783 | -64.43645388 |
| Gradient (au) | 0.00008851 | 0.00008206 | 0.00000016 | 0.00000943 |
| Dipole Moment (debye) | 0.0003 | 0.0003 | 0.0000 | 0.0005 |
| Point Group | CS | CS | D3H | CS |
| Calculation Time | 19.0 seconds | 16.0 seconds | 14.0 seconds | 20.7 seconds |
| D-Space Link | 1 | 2 | GaBr3 D-Space | BBr3 D-Space |
Item Tables
BH3 Calculation (1)
         Item               Value     Threshold  Converged?
 Maximum Force            0.000220     0.000450     YES
 RMS     Force            0.000106     0.000300     YES
 Maximum Displacement     0.000940     0.001800     YES
 RMS     Displacement     0.000447     0.001200     YES
 Predicted change in Energy=-1.672478D-07
 Optimization completed.
    -- Stationary point found.
                           ----------------------------
                           !   Optimized Parameters   !
                           ! (Angstroms and Degrees)  !
 --------------------------                            --------------------------
 ! Name  Definition              Value          Derivative Info.                !
 --------------------------------------------------------------------------------
 ! R1    R(1,2)                  1.1948         -DE/DX =   -0.0002              !
 ! R2    R(1,3)                  1.1947         -DE/DX =   -0.0002              !
 ! R3    R(1,4)                  1.1944         -DE/DX =   -0.0001              !
 ! A1    A(2,1,3)              120.0157         -DE/DX =    0.0                 !
 ! A2    A(2,1,4)              119.986          -DE/DX =    0.0                 !
 ! A3    A(3,1,4)              119.9983         -DE/DX =    0.0                 !
 ! D1    D(2,1,4,3)            180.0            -DE/DX =    0.0                 !
 --------------------------------------------------------------------------------
BH3 Calculation (2)
         Item               Value     Threshold  Converged?
 Maximum Force            0.000204     0.000450     YES
 RMS     Force            0.000099     0.000300     YES
 Maximum Displacement     0.000875     0.001800     YES
 RMS     Displacement     0.000418     0.001200     YES
 Predicted change in Energy=-1.452109D-07
 Optimization completed.
    -- Stationary point found.
                           ----------------------------
                           !   Optimized Parameters   !
                           ! (Angstroms and Degrees)  !
 --------------------------                            --------------------------
 ! Name  Definition              Value          Derivative Info.                !
 --------------------------------------------------------------------------------
 ! R1    R(1,2)                  1.1928         -DE/DX =   -0.0002              !
 ! R2    R(1,3)                  1.1926         -DE/DX =   -0.0002              !
 ! R3    R(1,4)                  1.1924         -DE/DX =    0.0                 !
 ! A1    A(2,1,3)              120.0146         -DE/DX =    0.0                 !
 ! A2    A(2,1,4)              119.9866         -DE/DX =    0.0                 !
 ! A3    A(3,1,4)              119.9988         -DE/DX =    0.0                 !
 ! D1    D(2,1,4,3)            180.0            -DE/DX =    0.0                 !
 --------------------------------------------------------------------------------
GaBr3 Calculation
         Item               Value     Threshold  Converged?
 Maximum Force            0.000000     0.000450     YES
 RMS     Force            0.000000     0.000300     YES
 Maximum Displacement     0.000003     0.001800     YES
 RMS     Displacement     0.000002     0.001200     YES
 Predicted change in Energy=-1.282680D-12
 Optimization completed.
    -- Stationary point found.
                           ----------------------------
                           !   Optimized Parameters   !
                           ! (Angstroms and Degrees)  !
 --------------------------                            --------------------------
 ! Name  Definition              Value          Derivative Info.                !
 --------------------------------------------------------------------------------
 ! R1    R(1,2)                  2.3502         -DE/DX =    0.0                 !
 ! R2    R(1,3)                  2.3502         -DE/DX =    0.0                 !
 ! R3    R(1,4)                  2.3502         -DE/DX =    0.0                 !
 ! A1    A(2,1,3)              120.0            -DE/DX =    0.0                 !
 ! A2    A(2,1,4)              120.0            -DE/DX =    0.0                 !
 ! A3    A(3,1,4)              120.0            -DE/DX =    0.0                 !
 ! D1    D(2,1,4,3)            180.0            -DE/DX =    0.0                 !
 --------------------------------------------------------------------------------
BBr3 Calculation
         Item               Value     Threshold  Converged?
 Maximum Force            0.000016     0.000450     YES
 RMS     Force            0.000010     0.000300     YES
 Maximum Displacement     0.000067     0.001800     YES
 RMS     Displacement     0.000040     0.001200     YES
 Predicted change in Energy=-1.574159D-09
 Optimization completed.
    -- Stationary point found.
                           ----------------------------
                           !   Optimized Parameters   !
                           ! (Angstroms and Degrees)  !
 --------------------------                            --------------------------
 ! Name  Definition              Value          Derivative Info.                !
 --------------------------------------------------------------------------------
 ! R1    R(1,2)                  1.934          -DE/DX =    0.0                 !
 ! R2    R(1,3)                  1.934          -DE/DX =    0.0                 !
 ! R3    R(1,4)                  1.9339         -DE/DX =    0.0                 !
 ! A1    A(2,1,3)              119.9971         -DE/DX =    0.0                 !
 ! A2    A(2,1,4)              120.0011         -DE/DX =    0.0                 !
 ! A3    A(3,1,4)              120.0018         -DE/DX =    0.0                 !
 ! D1    D(2,1,4,3)            180.0            -DE/DX =    0.0                 !
 --------------------------------------------------------------------------------
Molecule Comparisons
Bond Distances
The optimised bond distances of the three molecules are shown below. With regards to the bond angles, they stayed around 120 degrees throughout. The following observations were made:
Changing ligands
Changing the ligand from H to Br in the molecule increased the length of the B - ligand bond. The average length increased from 1.19 to 1.93 Angstroms. This may be due to the Br being larger, so there is less overlap between the bonding AOs, and more electronegative, so the bond is more polar. Changing the ligands to Br makes the bond more negative on the ligand and more positive on the central atom. The bond angles were slightly closer to 120 degrees with the Br ligands. This suggests that due to the larger atoms the repulsion is larger and so the structure adapts so that there is maximal separation between ligands.
Changing central atom
Changing the central atom from Ga to Br in the molecule increased the length of the Center - ligand bond. The average length increased from 1.93 to 2.35 Angstroms. This is because Ga is larger than B, so there is poorer bonding AO overlap, and it is less electronegative than B, making the bond more polar. The bond angles were fixed at 120 degrees for GaBr3 so cannot be analysed.
| Molecule | BH3 | GaBr3 | BBr3 |
|---|---|---|---|
| Bond Distance 1 (Å) | 1.19243 | 2.35018 | 1.934 |
| Bond Distance 2 (Å) | 1.19276 | 2.35018 | 1.93398 |
| Bond Distance 3 (Å) | 1.19264 | 2.35018 | 1.93391 |
| Bond Angle 1 (•) | 119.987 | 120 | 119.997 |
| Bond Angle 2 (•) | 120.015 | 120 | 120.002 |
| Bond Angle 3 (•) | 119.999 | 120 | 120.001 |
Bonding in Gaussian
The bonding in Gaussview is based on the internuclear distances. If the nuclear distances are too long a bond will not be drawn even though the atoms could be described as sharing a 'bonding' interaction.
The IUPAC Gold Book[1] definition of a bond is:
There is a chemical bond between two atoms or groups of atoms in the case that the forces acting between them are such as to lead to the formation of an aggregate with sufficient stability to make it convenient for the chemist to consider it as an independent 'molecular species'.
This doesn't necessarily mean that bonding can be determined based on intermolecular distance alone. If there is significant electron density between the two atoms there may be a bond even if there is a long distance.
Frequency Analysis
Introduction to Frequency Analysis
Frequency analysis is carried out to analyse the vibrational characteristics of a molecule. This can be compared with an experimental IR spectrum to see whther a synthesised compound is matches the predicted structure. It also can be used to confirm that an optimisation has achieved a minimum energy rather than a transition state (transition states will give 1 negative vibrational frequency).
The same method and basis set must be used for both the optimisation and the frequency analysis calculations because the frequency calculations rely on the energy minimum being reached. If the optimisation was carried out using a different method or basis set then the structure may no longer be a minimum and so the calculated vibrations would be wrong.
The "Low frequencies" represent the frequencies associated with the motion of the centre of mass of the molecule and are much smaller than the other vibrations.
Calculations performed
The structures obtained from the optimisations were used to find the vibrational frequencies of the atoms.
| Calculation | BH3 | GaBr3 |
|---|---|---|
| File type | .log | .log |
| Calculation Type | FREQ | FREQ |
| Calculation Method | RB3LYP | RB3LYP |
| Basis Set | 6-31G(d,p) | LANL2DZ |
| Final Energy (au) | -26.61532364 | -41.70082783 |
| Gradient (au) | 0.00000001 | 0.00000011 |
| Dipole Moment (debye) | 0.0000 | 0.0000 |
| Point Group | D3H | D3H |
| Calculation Time | 9.0 seconds | 19.8 seconds |
| D-Space Link | 1 | GaBr3 D-Space |
Calculation Output
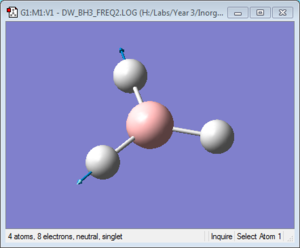
A frequency analysis was carried out on the optimised structure of BH3. This was done at a finer level than before in order to obtain accurate frequencies. Since all the frquencies are positive an energy minimum has been reached.
BH3
Low frequencies ---   -9.3741   -9.3588   -0.0753    0.0007    0.5350    2.4499
Low frequencies --- 1162.9902 1213.1495 1213.1497
GaBr3
Low frequencies ---   -0.5252   -0.5247   -0.0024   -0.0010    0.0235    1.2010
Low frequencies ---   76.3744   76.3753   99.6982
Vibrational Modes
Vibrational Spectrum
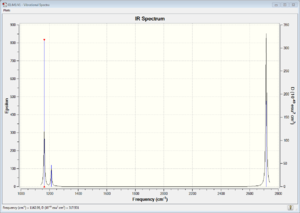
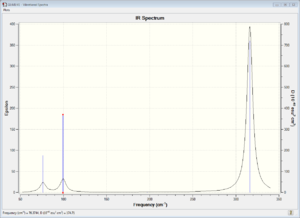
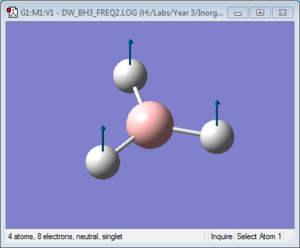
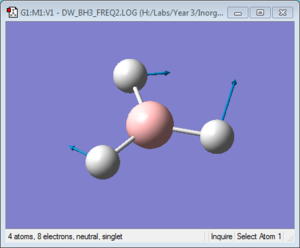
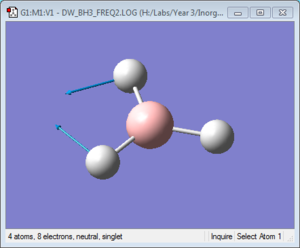
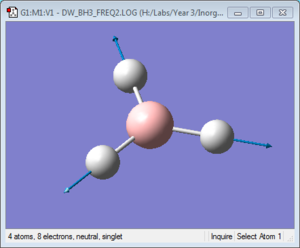
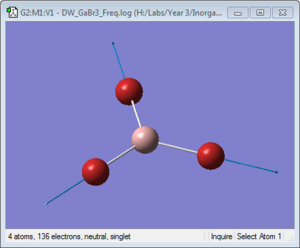
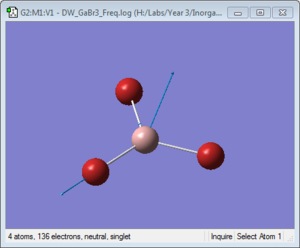
The vibrational spectrum of BH3 only shows 3 peaks rather than the 6 expected from 3N-6 because there are two pairs of vibrational modes with overlapping energies (at 121.cm-1 and 258.cm-1), which appear as a single peak, and also the vibration at 2583cm-1 has 0 intensity and so doesn't show on the spectrum. the reason that this frequency has zero intensity is that the vibration mode is completely symmetrical and so there is no associated change in dipole. Absorptions only occur when there is a change in the dipole moment associated with them.
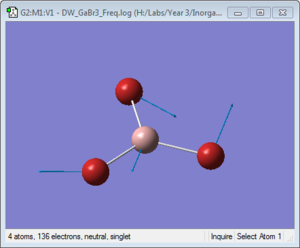
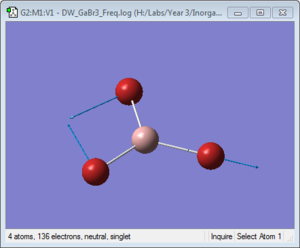
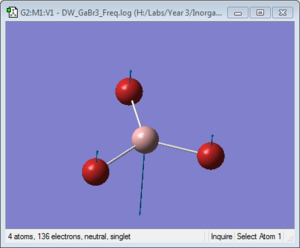
The large difference in the value of the frequencies for BH3 and GaBr3 indicates that the B-H bonds and the GaBr bonds differ in strength and that the atoms themselves have different masses.
The modes are in a different order in the two spectra, with A2" higher energy than E' in the GaBr3 spectrum and lower in energy than the E' in the BH3 spectrum.
The spectra both show 3 peaks and the energies are of the three peaks are similarly distributed with two low energy peaks closer together and one higher energy peak. The GaBr3 peaks are lower in energy and more closely spaced.
In both spectra the A2" and the E' and the A1 and the E' have quite similar energies. This is because the vibrational modes within both pairs are quite similar. In the lower energy pair (A2" and the E') the bonds don't change in length very much during the vibrations. For the other pair, the bonds vary dramatically in length throughout the vibration.
MOs Analysis
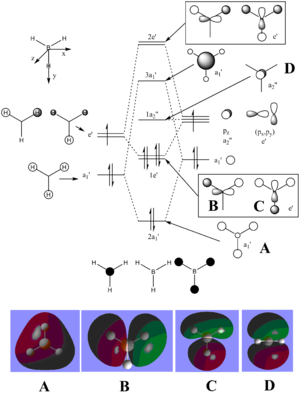
The LCAOs match the real orbitals for BH3 very closely. This suggests that MO theory could be quite useful to analyse the bonding in simple molecules. For larger molecules the bonding is more complex and so might not match the LCAO orbitals as closely.
| MO | Image | Symmetry group |
|---|---|---|
| A | 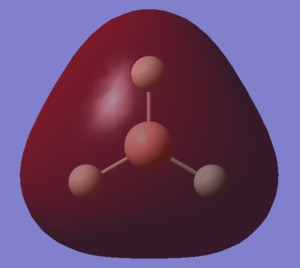 |
A2" |
| B |  |
E' |
| C | 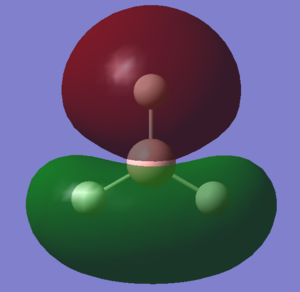 |
E' |
| D | 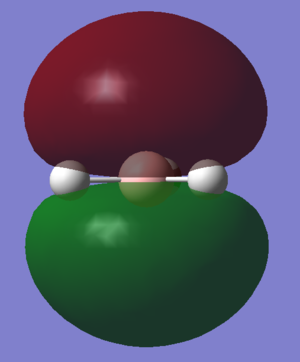 |
A1' |
NBOs Analysis
Calculation Summaries
| Calculation | NH3 (Opt) | NH3 (Freq) | NH3 (Pop) |
|---|---|---|---|
| File type | .log | .log | .log |
| Calculation Type | FOPT | FREQ | SP |
| Calculation Method | RB3LYP | RB3LYP | RB3LYP |
| Basis Set | 6-31G(d,p) | 6-31G(d,p) | 6-31G(d,p) |
| Final Energy (au) | -56.55776872 | -56.55776872 | -56.55776856 |
| Gradient (au) | 0.00000010 | 0.00000035 | 0.00000016 |
| Dipole Moment (debye) | 1.8465 | 1.8465 | 1.8465 |
| Point Group | C1 | C1 | C1 |
| Calculation Time | 1 minute 10.1 seconds | 34.0 seconds | 32.1 seconds |
| D-Space Link | NH3 (opt) D-Space | NH3 (freq) D-Space | NH3 (pop) D-Space |
         Item               Value     Threshold  Converged?
 Maximum Force            0.000000     0.000002     YES
 RMS     Force            0.000000     0.000001     YES
 Maximum Displacement     0.000001     0.000006     YES
 RMS     Displacement     0.000000     0.000004     YES
 Predicted change in Energy=-1.239174D-13
 Optimization completed.
    -- Stationary point found.
                           ----------------------------
                           !   Optimized Parameters   !
                           ! (Angstroms and Degrees)  !
 --------------------------                            --------------------------
 ! Name  Definition              Value          Derivative Info.                !
 --------------------------------------------------------------------------------
 ! R1    R(1,2)                  1.018          -DE/DX =    0.0                 !
 ! R2    R(1,3)                  1.018          -DE/DX =    0.0                 !
 ! R3    R(1,4)                  1.018          -DE/DX =    0.0                 !
 ! A1    A(2,1,3)              105.7444         -DE/DX =    0.0                 !
 ! A2    A(2,1,4)              105.7444         -DE/DX =    0.0                 !
 ! A3    A(3,1,4)              105.7444         -DE/DX =    0.0                 !
 ! D1    D(2,1,4,3)           -111.8634         -DE/DX =    0.0                 !
 --------------------------------------------------------------------------------
 Low frequencies ---   -7.6513   -5.9823   -3.2701    0.0012    0.0022    0.0022
 Low frequencies --- 1089.3490 1693.9240 1693.9288
Charge Distributions
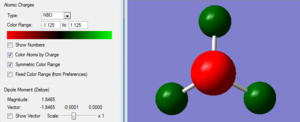
For NH3, the charges were -1.125 on the N and +0.375 on each H atom.
Association Energy
Calulation Summaries
| Calculation | NH3BH3 (Opt) | NH3BH3 (Freq) | NH3BH3 (Pop) |
|---|---|---|---|
| File type | .log | .log | .log |
| Calculation Type | FOPT | FREQ | SP |
| Calculation Method | RB3LYP | RB3LYP | RB3LYP |
| Basis Set | 6-31G(d,p) | 6-31G(d,p) | 6-31G(d,p) |
| Final Energy (au) | -83.22468909 | -83.22468909 | -83.22468949 |
| Gradient (au) | 0.00000001 | 0.00000009 | 0.00000000 |
| Dipole Moment (debye) | 5.5646 | 5.5646 | 5.5646 |
| Point Group | C3 | C3 | C3 |
| Calculation Time | 3 minutes 22.5 seconds | 1 minute 24.4 seconds | 35.9 seconds |
| D-Space Link | NH3BH3 (opt) D-Space | NH3BH3 (freq) D-Space | NH3BH3 (pop) D-Space |
         Item               Value     Threshold  Converged?
 Maximum Force            0.000000     0.000002     YES
 RMS     Force            0.000000     0.000001     YES
 Maximum Displacement     0.000000     0.000006     YES
 RMS     Displacement     0.000000     0.000004     YES
 Predicted change in Energy=-1.879536D-15
 Optimization completed.
    -- Stationary point found.
                           ----------------------------
                           !   Optimized Parameters   !
                           ! (Angstroms and Degrees)  !
 --------------------------                            --------------------------
 ! Name  Definition              Value          Derivative Info.                !
 --------------------------------------------------------------------------------
 ! R1    R(1,8)                  1.2098         -DE/DX =    0.0                 !
 ! R2    R(2,8)                  1.2098         -DE/DX =    0.0                 !
 ! R3    R(3,8)                  1.2098         -DE/DX =    0.0                 !
 ! R4    R(4,7)                  1.0185         -DE/DX =    0.0                 !
 ! R5    R(5,7)                  1.0185         -DE/DX =    0.0                 !
 ! R6    R(6,7)                  1.0185         -DE/DX =    0.0                 !
 ! R7    R(7,8)                  1.6677         -DE/DX =    0.0                 !
 ! A1    A(4,7,5)              107.8758         -DE/DX =    0.0                 !
 ! A2    A(4,7,6)              107.8758         -DE/DX =    0.0                 !
 ! A3    A(4,7,8)              111.0231         -DE/DX =    0.0                 !
 ! A4    A(5,7,6)              107.8758         -DE/DX =    0.0                 !
 ! A5    A(5,7,8)              111.0231         -DE/DX =    0.0                 !
 ! A6    A(6,7,8)              111.0231         -DE/DX =    0.0                 !
 ! A7    A(1,8,2)              113.8739         -DE/DX =    0.0                 !
 ! A8    A(1,8,3)              113.8739         -DE/DX =    0.0                 !
 ! A9    A(1,8,7)              104.5974         -DE/DX =    0.0                 !
 ! A10   A(2,8,3)              113.8739         -DE/DX =    0.0                 !
 ! A11   A(2,8,7)              104.5974         -DE/DX =    0.0                 !
 ! A12   A(3,8,7)              104.5974         -DE/DX =    0.0                 !
 ! D1    D(4,7,8,1)             60.0011         -DE/DX =    0.0                 !
 ! D2    D(4,7,8,2)           -179.9989         -DE/DX =    0.0                 !
 ! D3    D(4,7,8,3)            -59.9989         -DE/DX =    0.0                 !
 ! D4    D(5,7,8,1)           -179.9989         -DE/DX =    0.0                 !
 ! D5    D(5,7,8,2)            -59.9989         -DE/DX =    0.0                 !
 ! D6    D(5,7,8,3)             60.0011         -DE/DX =    0.0                 !
 ! D7    D(6,7,8,1)            -59.9989         -DE/DX =    0.0                 !
 ! D8    D(6,7,8,2)             60.0011         -DE/DX =    0.0                 !
 ! D9    D(6,7,8,3)           -179.9989         -DE/DX =    0.0                 !
 --------------------------------------------------------------------------------
 Low frequencies ---   -0.1419   -0.0600   -0.0212    2.3587    2.3918    7.4922
 Low frequencies ---  263.6238  632.9757  638.5004
Calculation
| Molecule | Energy (AU) |
|---|---|
| NH3 | -56.55776872 |
| BH3 | -26.61532364 |
| NH3BH3 | -83.22468909 |
ΔE = E(NH3BH3) - [E(NH3) + E(BH3)]
ΔE = -0.05159673AU = -135.5kJ/mol
Bond dissociation energy is therefore 135.5kJ/mol
This is significantly weaker than a methane C-H bond which is 439.3kJ/mol[2] but similar in magnitude to a I-I bond at 151.0kJ/mol[3]. This might be expected due to the dative nature of the bond where the highly electronegative N atom is donating an electron pair to the lewis acid BH3.
Investigation of Aromaticity Project
Introduction
Aromaticity is a concept that is familiar to every chemistry student to some degree but not really explained beyond 'delocalised pi electrons'. This project aims to investigate the aromatic character of four molecules and compare the computational results with common ideas about aromaticity.
The four moleclues investigated were; benzene, used as a reference for the other molecules, boratabenzene-, pyridinium+ and borazine. This allowed the elucidation of the effects of changing carbon atoms in benzene to other elements.
Calculations performed
For the aromaticity investigation the calculations were all done in one go on the molecules using exactly the same calulation method and basis set. The calulation carried out an optimisation of the geometry, followed by NBO analysis and frequency analysis. All the optimisation calculations successfully converged to a stationary point and not a transition state, as confirmed by the frequency analysis.
The optimised benzene geometry showed bond lengths of 1.40Å. This is very similar value to experiment at 1.39Å[4].
| Calculation | Benzene | Boratabenzene | Pyridinium | Borazine |
|---|---|---|---|---|
| File type | .log | .log | .log | .log |
| Calculation Type | FREQ | FREQ | FREQ | FREQ |
| Calculation Method | RB3LYP | RB3LYP | RB3LYP | RB3LYP |
| Basis Set | 6-31G(d,p) | 6-31G(d,p) | 6-31G(d,p) | 6-31G(d,p) |
| Charge | 0 | -1 | +1 | 0 |
| Final Energy (au) | -232.25820551 | -219.02052985 | -248.66807380 | -242.68458739 |
| Gradient (au) | 0.00009549 | 0.00015728 | 0.00008342 | 0.00006610 |
| Dipole Moment (debye) | 0.0001 | 2.8465 | 1.8732 | 0.0002 |
| Point Group | C1 | C1 | C1 | C1 |
| Calculation Time | 5 minutes 8.4 seconds | 5 minutes 8.6 seconds | 4 minutes 27.1 seconds | 4 minutes 9.7 seconds |
| D-Space Link | Benzene D-Space | Boratabenzene D-Space | Pyridinium D-Space | Borazine D-Space |
Benzene
         Item               Value     Threshold  Converged?
 Maximum Force            0.000212     0.000450     YES
 RMS     Force            0.000085     0.000300     YES
 Maximum Displacement     0.000991     0.001800     YES
 RMS     Displacement     0.000315     0.001200     YES
 Predicted change in Energy=-5.157444D-07
 Optimization completed.
    -- Stationary point found.
 Low frequencies ---  -17.2814  -14.5862   -9.6619    0.0004    0.0005    0.0006
 Low frequencies ---  413.7969  414.4697  620.8546
Boratabenzene
         Item               Value     Threshold  Converged?
 Maximum Force            0.000159     0.000450     YES
 RMS     Force            0.000068     0.000300     YES
 Maximum Displacement     0.000803     0.001800     YES
 RMS     Displacement     0.000321     0.001200     YES
 Predicted change in Energy=-7.121479D-07
 Optimization completed.
    -- Stationary point found.
 Low frequencies ---  -13.1258   -0.0009   -0.0007   -0.0004   15.0651   18.1748
 Low frequencies ---  371.3454  404.2332  565.2512
Pyridinium
         Item               Value     Threshold  Converged?
 Maximum Force            0.000129     0.000450     YES
 RMS     Force            0.000045     0.000300     YES
 Maximum Displacement     0.000964     0.001800     YES
 RMS     Displacement     0.000278     0.001200     YES
 Predicted change in Energy=-2.284852D-07
 Optimization completed.
    -- Stationary point found.
 Low frequencies ---   -1.3593   -0.0006   -0.0005    0.0003   16.6022   17.1077
 Low frequencies ---  392.3631  404.1329  620.4711
Borazine
         Item               Value     Threshold  Converged?
 Maximum Force            0.000093     0.000450     YES
 RMS     Force            0.000033     0.000300     YES
 Maximum Displacement     0.000338     0.001800     YES
 RMS     Displacement     0.000096     0.001200     YES
 Predicted change in Energy=-1.027048D-07
 Optimization completed.
    -- Stationary point found.
 Low frequencies ---  -17.1539  -10.8007   -6.2385    0.0009    0.0010    0.0011
 Low frequencies ---  288.8470  289.6791  404.1666
Electronic Analysis
Charge Distributions
| Molecule | Image |
|---|---|
| Benzene | 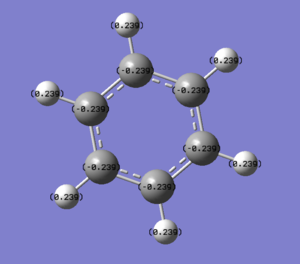 |
| Boratabenzene |  |
| Pyridinium | 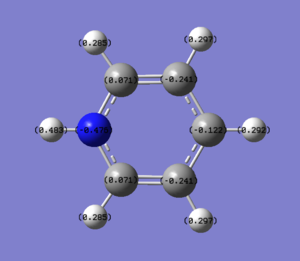 |
| Borazine | 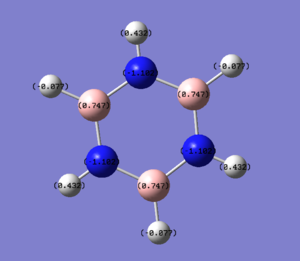 |
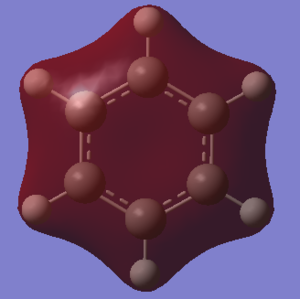
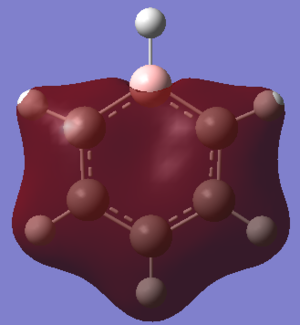
In benzene the charge density is evenly spread throughout the ring with all carbons having -0.239 and the hydrogens all having +0.239. This would be expected given the symmetry of the ring.
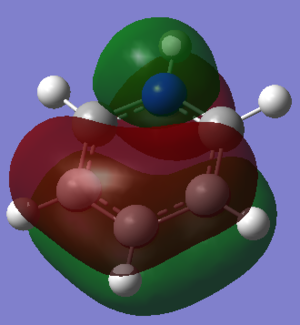
In boratabenzene one carbon has been replaced by a more electropositive Boron atom and the total charge is -1 rather than 0. As a result there is more electron density on the hydrogen attached to the boron and less on the boron (which is actually +0.202). The other carbon atoms in the ring have more electron density than in benzene, especially the carbons α (-0.588) and γ (-0.340). The β carbons only have slightly more electron density than in benzene (-0.250)
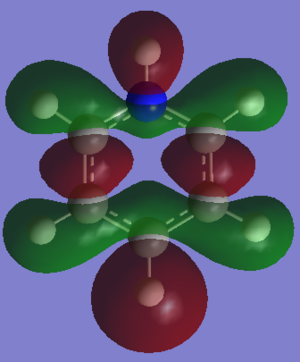
In pyridinium one carbon has been replaced by a nitrogen atom and the total charge is +1. Since N is highly electronegative there is significant electron density on the N and less on the carbon atoms in the ring. The magnitude of the change of electron density follows the same pattern as in boratabenzene with the carbons being, in order of magnitude of change from benzene, α (0.071) > γ (-0.122) > β (-0.241). Perhaps most suprising is that the β carbon has more electron density than in benzene, even though the molecule is positively charged and an electronegative atom has been added into the ring.
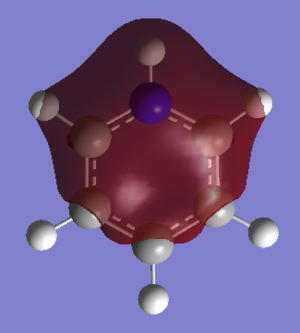
Borazine shows a charge distribution that might be expected after analysing the three previous molecules, with the electronegative nitrogen atoms carrying the most electron density and the electropositive boron atoms carrying the least. For the hydrogen atoms the more electropositive the atom to which they were bound, the more electron density they have.
MOs Analysis
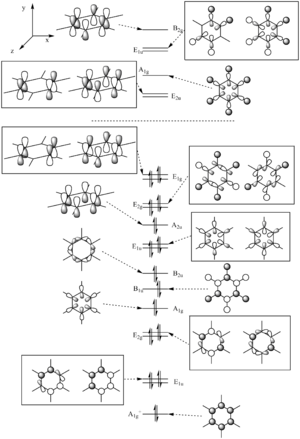
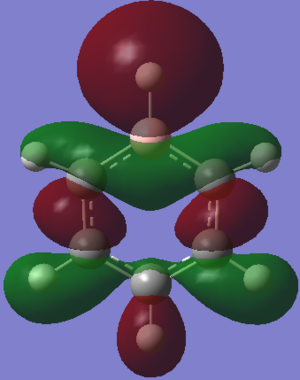
The common conception of aromaticity is that it is just the pi electrons that are delocalised around the ring and the 3 highest occupied orbitals and 3 lowest unoccupied orbitals are all just made up of pi orbitals. As these calculations show, there are two occupied orbitals of higher energy than the lowest energy purely pi orbital that is made up of sigma bonding orbitals.
Huckel's rule states that a system is aromatic if it contains 4n+2 pi electrons.
The MOs tend to show more diffuse orbitals around the boron atoms than the nitrogen atoms. This correlates with finding of lower electron density on the boron atoms than on the nitrogen atoms.
Comparing MO 1 across the four molecules, the orbitals are more diffuse around the boron atoms than around the nitrogen atoms. The orbital was lower in energy for the pyridinium than the boratabenzene. The borazine and benzene energies were similar. It was the HOMO for all of the molecules except for boratabenzene.
For MO 2, again the orbitals are more tightly bound to the nitrogen atoms and more diffuse around the boron atoms.
For MO 3, The MO is totally bonding and in all four molecules it was the first orbital above the core orbitals. The orbital shape follows the electron density with the cloud centered more on the electronegative atom. This means that in the pyridinium the electron cloud is shifted towards the nitrogen and in boratabenzene it is centered more away from the boron. In borazine the cloud is centered more on each of the nitrogen atoms.
Changing the atoms from benzene to boratabenzene and pyridinium broke the symmetry of the molecule (point group went from D6h to C2v) and so the degeneracy of the MOs was reduced. Going from benzene to borazine (point group went from D6h to D3h), the symmetry was not reduced as much and so the degeneracy of the MOs did not change.
NBO Bonding Analysis
The NBO bonding analysis shows the bonding in benzene as sp2 bonds between each adjacent pair of carbon atoms and between each carbon and hydrogen pair. There are then 3 C-C bonds composed exclusively of p orbitals.
This analysis doesn't give any indication of the aromaticity of the molecule because it tries to put the electrons into 2c-2e bonds. Aromaticity is due to delocalised electrons and so doesn't lend itself to a description using discrete 2c-2e bonds. This inevitably leads to a poor description of the bonding situation and is misleading in how localised it suggests the electrons are.
Vibrational Analysis
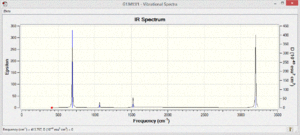
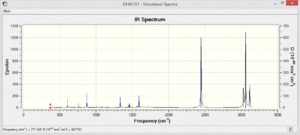
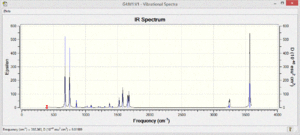
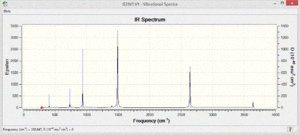
The vibrational spectra of the four molecules show different patterns. There are many more vibrational modes with non-zero intensity in the spectra of the polar pyridinium and boratabenzene molecules.
The benzene only shows four absorptions at 693,1066, 1525 and 3200cm-1 and they are very weak in intensity due to the low polarity of the bonds in the molecule.
The pyridinium only shows some low energy vibrations whereas the most significant absorptions in the boratabenzene spectrum are much higher in energy and stronger intensity.
Since Borazine is more symmetrical, fewer vibrational modes are expected, and fewer are observed. Due to the high polarity of the atoms in the molecule the intensity of the vibrations that are present is very high.
References
- ↑ IUPAC. Compendium of Chemical Terminology, 2nd ed. (the "Gold Book"). Compiled by A. D. McNaught and A. Wilkinson. Blackwell Scientific Publications, Oxford (1997). XML on-line corrected version: http://goldbook.iupac.org (2006-) created by M. Nic, J. Jirat, B. Kosata; updates compiled by A. Jenkins. ISBN 0-9678550-9-8. "IUPAC Gold Book - Bond".
- ↑ S. J. Blanksby and G. B. Ellison, Acc. Chem. Res., 2003, 36, 255–263."10.1021/ar020230d"
- ↑ M. Stans, NIST, 1972 "NSRDS-NBS31"
- ↑ R. C. Bingham and M. J. S. Dewar, 1972, 859, 9107–9112."10.1021/ja00781a020"

