Rep:Mod:DJJK1C
Conformational Analysis using Molecular Mechanics
The Hydrogenation of Cyclopentadiene Dimer
|
|
|
|
| Molecule | Total bond stretching energy / kcal/mol | Total angle bending energy / kcal/mol | Total torsional energy / kcal/mol | Total van der Waals energy / kcal/mol | Total electrostatic energy / kcal/mol | Total energy / kcal/mol |
|---|---|---|---|---|---|---|
| 1 | 3.543 | 30.774 | -2.731 | 12.801 | 13.014 | 55.373 |
| 2 | 3.465 | 33.195 | -2.951 | 12.356 | 14.186 | 58.191 |
| 3 | 3.311 | 31.941 | -1.472 | 13.635 | 5.119 | 50.446 |
| 4 | 2.823 | 24.685 | -0.378 | 10.637 | 5.147 | 41.257 |
Molecules 1 and 2 are both products of the dimerisation of cyclopentadiene. We would expect exo product (1) to be of lower energy than the endo product (2) and therefore the thermodynamic product due to the 5-memebered ring present in 2 being syn to the longest bridge in the molecule. This induces steric repulsions which are not present in 1 since the 5-membered ring in this case is anti to the longest bridge. This is confirmed computationally by optimising the geometry of both molecules using a MMFF94s force field. From Table 1, the total energy computed for product 1 was lower than that of product 2.
It is observed experimentally, however, that upon dimerisation of cyclopentadiene, the endo product (2) is formed preferentially to the exo product (1). This indicates that the dimerisation of cyclopentadiene is not under thermodynamic control. In other words, the reaction is under kinetic control. In which case there must be a more stable transition state along the reaction trajectory towards forming the endo product, compared to that of the exo product. An explanation of why the energy of the transition state reached when forming the endo product (2) is lower than that of the exo product (1) comes from studying the reaction mechanisms and molecular orbital pictures of the transition states.
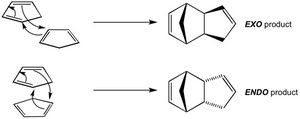
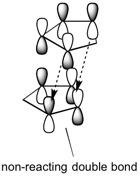
Cyclopentadiene dimerises via a Diels-Alder mechanism, whereby one of cyclopentadiene molecules provides the diene requirement and the other molecule acts as the necessary dienophile. The reaction can proceed in two ways, which are summarised in Figure 1. One possibility is that the double bond not taking part in the reaction is orientated away from the cyclopentadiene molecule that is acting as the diene. This results in the exo product (1) being formed. The non-reacting double bond being pointed away from the diene means its MOs do not engage in any stabilising/destabilising interactions in the transition state. The other possibility is that the double bond not taking part in the reaction is orientated towards the diene. This results in the endo product (2) being formed. In this case the orbitals on the non-reacting double bond can engage in stabilising/destabilising interactions in the transition state. More specifically, looking at the HOMO-LUMO orbitals in the transition state (Figure 2), one can see that there are attractive through-space interactions between the diene and dieneophile orbitals due to both having the same symmetry and phase. Extra stabilisation in the transition state for the endo product comes from the ability of the non-reacting double bond to engage in some through space interactions with the diene orbitals, due to its proximity to the diene. This cannot be said for the transition state of the exo product, whereby the non-reacting double bond is too far away to engage in such interactions.
Hydrogenation of molecule 2 leads to the reduction of a double bond to a single bond. Due to there being two double bonds present in the molecule, regioselectivity of hydrogen addition needs to be considered. From Table 1, the total energy of molecule 4 is lower than that of molecule 3. Molecule 4 is therefore the thermodynamic product and since the reaction is under thermodynamic control 4 would form preferentially to 3.
This implies that the double bond in the 6-membered ring is attacked preferentially to the that of the 5-membered ring. The greater thermodynamic stability of molecule 4 compared to molecule 3 is rationalised by looking at the different forms of energy contribution in Table 1.
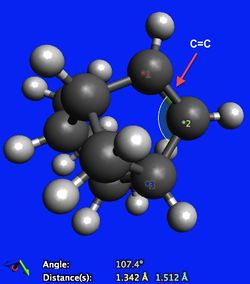
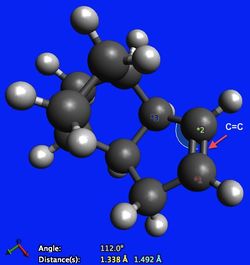
Looking at Table 1, it can be seen that most significant difference in the stability of the molecules manifests itself in the angle bending energy. The angle bending energy for molecule 3 is 7.256 kcal/mol larger than that of molecule 4. An explanation for this comes from analysing the hybridisation of carbon in a carbon-carbon double bond and the preferred geometry of such an arrangement. In both molecules there is significant angle strain due to the arrangement of the carbon-carbon double bond. The carbon atoms are sp2 hybridised and as such would ideally adopt a trigonal planar geometry, displaying bond angles of 120o with its substituents. From Figure 3, it can be seen that in molecule 3 however, the C-C=C bond angle is 107.4o (12.6o difference from ideality). From Figure 4, it can be seen that in molecule 4 the angle strain is less pronounced, since the C-C=C bond angle is 112.0o and is therefore closer to the preferred 120o (8.0o difference from ideality).
|
|
Molecules 5 and 6 are both possible intermediates in the synthesis of the drug Taxol. They are an example of a pair of atropisomers. Atropisomerism is a specific sub-class of stereoisomerism whereby facile rotation about a single bond (through which the isomers would interchange rapidly) is difficult due to a high steric strain energy barrier, allowing for isolation of both conformations. Via molecular modelling using a MMFF94s force field, it was determined computationally which isomer is the most thermodynamically stable.
| Molecule | Total bond stretching energy / kcal/mol | Total angle bending energy / kcal/mol | Total torsional energy / kcal/mol | Total van der Waals energy / kcal/mol | Total electrostatic energy / kcal/mol | Total energy / kcal/mol |
|---|---|---|---|---|---|---|
| 5 | 8.303 | 32.340 | 1.811 | 37.568 | 0.332 | 81.299 |
| 6 | 7.679 | 19.556 | 3.637 | 34.946 | -0.048 | 66.581 |

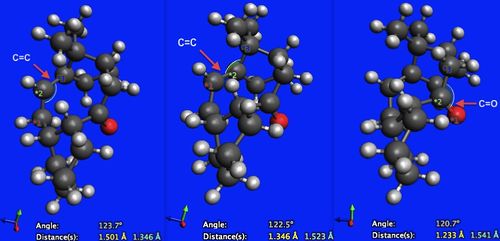
From Table 2, it can be seen that the most stable isomer is molecule 6. Again, the main reason for this seems to be the difference in their angle bending energies (angle bending energy for molecule 5 is 12.784 kcal/mol greater than that of molecule 6). This can again be rationalised by considering the hybridisations of the atoms in question. There are two particular bonds in each molecule that are of interest here. They are the carbonyl bond (C=O) and the carbon-carbon double bond (C=C). Each carbon is sp2 hybridised and so would ideally adopt a trigonal planar arrangement about the carbon atom, with a bond angle of 120o. Looking at Figures 5 and 6, it can be seen that for both of the carbonyl bonds their geometries are very close to the ideal value (a 0.3o difference from ideality for molecule 5 versus a 0.7o difference for molecule 6). The contribution of carbonyl to angle bending energy in both cases is therefore minimal. Looking at the C-C=C bond angles in both molecules however, it can be seen in Figure 5 that the bond angles for molecule 5 are quite different from the ideal bond angle (130.7o and 129.5o, resulting in a 10.7o and 9.5o difference from ideality respectively). This creates significant angular strain. Looking at Figure 6, the C-C=C bond angles for molecule 6 (123.7o and 122.5o, resulting in a 3.7o and 2.5o difference from ideality respectively), it can be seen that they are much closer to the ideal geometry than molecule 5. there is therefore less angular strain associated with molecule 6.
Building on previous studies, Maier and Von Rague Schleyer[1] defined a quantity they called 'olefin strain' (OS). Olefin strain is the energy associated with having a carbon-carbon double bond at the bridgehead of a ring system. The quantity is calculated by subtracting the total strain energy of the most stable conformational isomer of the parent alkane (i.e. a carbon-carbon single bond in place of a carbon-carbon double bond) from the total strain energy of the alkene. OS is directly proportional to the enthalpy of hydrogenation, ΔHHo, of the carbon-carbon double bond at the bridgehead, since this would reduce the double bond to a single bond and produce the parent alkane. In most cases the OS value is a positive quantity, since there is usually an element of ring strain and angle strain associated with having a double bond at the bridgehead (Bredt's rule[2]), making the alkene less stable (more energetic) than its parent alkane. There is however a special class of alkenes known as 'hyperstable olefins', wherein the OS value is negative. This indicates that the parent alkane is actually less stable than the alkene, due to the alkane being more strained. This explains why molecule 6 is less reactive (reacts more slowly) than one would otherwise expect. This extra stability of the alkene comes from the relief of strain associated with a large cage structure.
To test this assertion, the energies associated with the parent alkane were calculated for comparison with those of the alkene. Table 3 shows the results.
| Molecule | Total bond stretching energy / kcal/mol | Total angle bending energy / kcal/mol | Total torsional energy / kcal/mol | Total van der Waals energy / kcal/mol | Total electrostatic energy / kcal/mol | Total energy / kcal/mol |
|---|---|---|---|---|---|---|
| 5 | 8.303 | 32.339 | 1.811 | 37.568 | 0.332 | 81.299 |
| Parent alkane to molecule 5 | 8.192 | 33.186 | 9.529 | 37.670 | 0.000 | 89.120 |
| 6 | 7.679 | 19.556 | 3.637 | 34.946 | -0.048 | 66.581 |
| Parent alkane to molecule 6 | 6.713 | 25.449 | 11.529 | 32.982 | 0.000 | 77.271 |
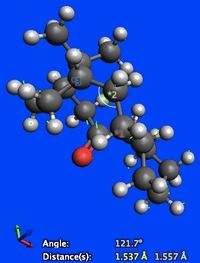
Looking at molecule 6, there is a 5.893 kcal/mol increase in angle bending energy upon hydrogenation of the alkene to its parent alkane. This can be explained by looking at the bond angle about the carbon-carbon double bond to which hydrogen addition takes place. In the parent alkane the carbon atom is sp3 hybridised and so would ideally adopt a tetrahedral geometry, with bond angles of 109.5o. The observed bond angle however was 121.7o (Figure 7). There is therefore significant angular strain present. For molecule 5, there isn't a significant difference between angle bending energy of the alkene and its parent alkane.
It is also observed that there is a significant increase in torsional energy within both molecules upon hydrogenation (7.718 kcal/mol and 7.892 kcal/mol for molecules 5 and 6 respectively). This is due to both molecules having to adopt an eclipsed conformation about the C-C bond upon hydrogenation, where a staggered conformation would normally be preferred. This results in significant torsional strain in the parent alkanes and accounts for the observation that both alkenes are more stable than their parent alkanes.
Spectroscopic Simulation using Quantum Mechanics
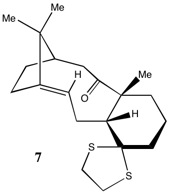
From the study above, it was decided that the Taxol intermediate with the oxygen atom pointing down (molecule 7) would be the most thermodynamically stable. The energies associated with this molecule are given in Table 4.
taxol18 |
| Total bond stretching energy / kcal/mol | Total angle bending energy / kcal/mol | Total torsional energy / kcal/mol | Total van der Waals energy / kcal/mol | Total electrostatic energy / kcal/mol | Total energy / kcal/mol | Gibbs free energy / kcal/mol |
|---|---|---|---|---|---|---|
| 15.065 | 30.645 | 9.776 | 49.598 | -6.075 | 100.558 | -1036309.063 |
The geometry of molecule 7 was optimised using a MMFF94s force field and the 1H NMR (Figure 8) and 13C NMR (Figure 9) spectra in C6D6 were calculated (DOI:10042/26696 ).

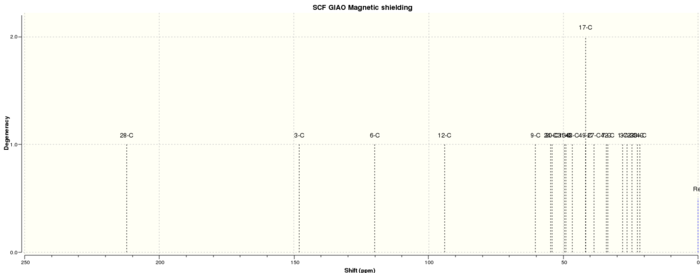
The computed NMR spectra were then compared to literature in order to assess the accuracy and applicability of the calculations (Table 5).
| 1H NMR calculated δ / ppm | 1H NMR experimental δ / ppm | 13C NMR calculated δ / ppm | 13C NMR experimental δ / ppm |
|---|---|---|---|
| 5.98 | 5.21 (m, 1 H) | 212.12 | 211.49 |
| 3.21 - 2.97 | 3.00 - 2.70 (m, 6 H) | 147.97 | 148.72 |
| 2.82 - 2.66 | 2.70 - 2.35 (m, 4 H) | 120.04 | 120.90 |
| 2.50 - 2.23 | 2.20 - 1.70 (m, 6 H) | 94.00 | 74.61 |
| 2.01 - 1.84 | 1.58 (t, J = 5.4 Hz, 1 H) | 60.32 | 60.53 |
| 1.64 - 1.54 | 1.50 - 1.20 (m, 3 H) | 54.78 | 51.30 |
| 1.31 - 1.21 | 1.10 (s, 3 H) | 54.09 | 50.94 |
| 0.99 - 0.93 | 1.07 (s, 3 H) | 49.59 | 45.53 |
| 0.64 | 1.03 (s, 3 H) | 49.03 | 43.28 |
| 46.67 | 40.82 | ||
| 41.67 | 38.73 | ||
| 38.63 | 36.78 | ||
| 34.02 | 35.47 | ||
| 33.54 | 30.84 | ||
| 28.05 | 30.00 | ||
| 26.36 | 25.56 | ||
| 24.44 | 25.35 | ||
| 22.52 | 22.21 | ||
| 21.61 | 21.39 | ||
| 19.83 |
For the 1H NMR the calculated chemical shifts are in good agreement with the literature. The computational method used was therefore both applicable and useful.
The presence of low field proton chemical shifts in the calculation is due to the proton in question being close to an electronegative substituent (e.g. sulfur), which results in a deshielding effect. This is further evidence that the calculation is consistent with the literature, where the same effect is observed.
The same cannot be said for the calculated 13C NMR chemical shifts. Except for a handful of peaks, the calculated chemical shifts differ in value considerably to the literature. What's more, there seems to be an extra peak reported in the literature which is absent in the calculated spectrum.
One source of error in the 13C NMR calculation is the presence of so-called 'heavy atoms' in the molecule, namely sulfur. A correction therefore needs to be applied to the chemical shifts. The value of this correction however is not yet known. It therefore could not be applied and the calculated chemical shifts are that far away from the literature that this correction may not even help.
Although the calculated chemical shifts were different to those in the literature, the relative positions of the shifts in the calculated 13C NMR spectrum due to the environments of each carbon (the degrees of shielding and deshielding) are consistent with the literature. The calculated chemical shift of the carbon attached to the sulfur atom is low field, as was the case with the 1H NMR calculations.
The other possibility of course is that an incorrect conformation of the molecule was produced when attempts at optimisation were made. The conformation on which the 13C NMR analysis in the literature was performed may not match the conformation obtained here. It should be noted however that if this were true, it would be reasonable to assume that the 1H NMR calculations would also not match the literature, which, as discussed above, was not the case.
Analysis of the properties of the synthesised alkene epoxides
The crystal structures of the Shi and Jacobsen catalysts
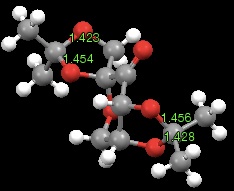
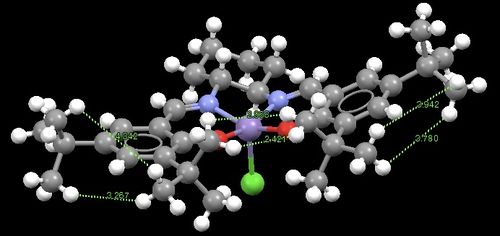
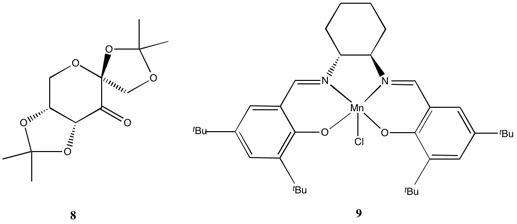
Molecules 8 and 9 are both asymmetric epoxidation catalysts. Molecule 8 is known as 'Shi's catalyst'. Preparation of the Shi catalyst was first reported by Z-X Wang, Y. Tu, J-R Zhang and Y. Shi[4] and involves the conversion of D-Fructose to a cyclic acetal, which is then oxidised to a ketone catalyst using pyridinium chlorochromate. The catalyst can then be used for asymmetric epoxidation and shows high yields when used with trans-alkenes. One notable feature of Shi epoxidation is the absence of metal catalysis. Molecule 9 is known as 'Jacobsen's catalyst'. Preparation of the Jacobsen catalyst was first reported by W. Zhang and E. N, Jacobsen[5] and involves the co-ordination of a Schiff base salen ligand to a manganese centre. This catalyst can also be used for asymmetric epoxidation, but unlike the Shi catalyst, promotes high yields when used with cis-alkenes.
The crystal structures of both catalysts were investigated by extracting their data from the Cambridge Crystal Database.
The Shi catalyst molecule has two anomeric centres. The bond distances at these centres are given in Figure 10. For both anomeric centres it is observed that one of the C-O bonds is shorter (and therefore stronger) than the other. This can be rationalised by assessing orbital interactions at the anomeric centres. The lone pair orbital on the oxygen atom of the shorter C-O bond in both cases is syn-periplanar to the C-O σ* orbital of the longer C-O bond. This arrangement allows for donation of the lone pair into the σ* orbital. Electrons being present in a (antibonding) σ* orbital reduces the bonding character of the C-O bond, making it longer (weaker) than expected. In other words, there is OLp/C-Oσ* conjugation. This is known as the anormeric effect.
Figure 11 shows the distances of closest approach of adjacent tertiary butyl groups. The presence of adjacent bulky groups leads to significant van der Waals interactions. In order to assess whether these interactions are favourable or not (attractive or repulsive), the van der Waals radius of the hydrogen atom needs to be known. If one considers two hydrogen atoms approaching one another, the interaction between them will be attractive until a separation equal to the sum of their respective van der Waals radii is reached, beyond which this value the interaction becomes repulsive, and hence unfavourable. The van der Waals radius of a hydrogen atom is 1.20 Å. In the instance outlined above, the sum of the van der Waals radii for the two approaching hydrogen atoms is therefore 2.40 Å. Looking at Figure 11, it is apparent that the distances of closest approach of the hydrogen atoms of the tertiary butyl groups all exceed the 2.40 Å threshold (the closest approach is in fact 2.43 Å) and so all interactions between tertiary butyl groups are attractive (favourable).
The calculated NMR properties of trans-β-methylstyrene oxide and 1,2-dihydronaphthalene oxide
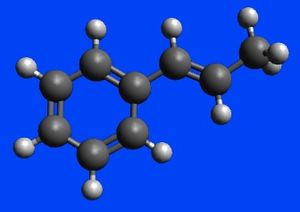
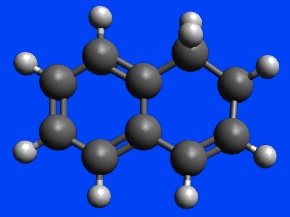
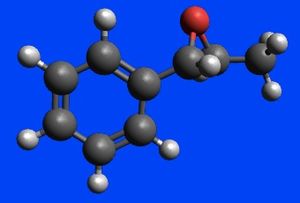
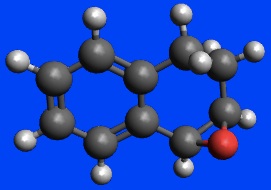
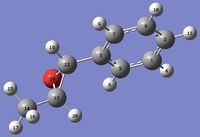
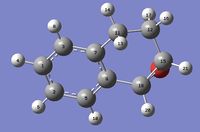
Trans-β-methylstyrene (Figure 12) and 1,2-dihydronaphthalene (Figure 13) can both be epoxidised to give trans-β-methylstyrene oxide (Figure 14) and 1,2-dihydronaphthalene oxide (Figure 15) respectively. For the purpose of NMR analysis stereochemistry of the products can be ignored for now.
The 1H and 13C NMR spectra of both compounds in CDCl3 were calculated for both epoxide products and were assigned according to the labels in Figure 16 for trans-β-methylstyrene oxide and Figure 17 for 1,2-dihydronaphthalene oxide. The 1H and 13C NMR spectra of trans-β-methylstyrene oxide are shown in Figure 18 and Figure 19 respectively. Similarly, the 1H and 13C NMR spectra of 1,2-dihydronaphthalene oxide are shown in Figure 20 and Figure 21 respectively. The computed spectra were then compared to the literature in order to assess the accuracy and applicability of QM calculations for these molecules (Tables 6 - 9).


| Proton | Calculated δ / ppm | Literature δ / ppm |
|---|---|---|
| 4, 6, 9, 10, 11 | 7.44 | 7.27 (m, 5 H) |
| 19 | 3.41 | 3.55 (d, 1 H, J = 2.5 Hz) |
| 20 | 2.79 | 3.12 (dq, 1 H, J = 6.8, 2.6 Hz) |
| 15, 16, 17 | 1.33 | 1.43 (d, 3 H, J = 6.8 Hz) |
| Carbon atom | Calculated δ / ppm | Literature δ / ppm |
|---|---|---|
| 5 | 135.0 | 137.7 |
| 1, 8 | 124.1 | 128.3 |
| 2 | 122.7 | 127.9 |
| 3, 7 | 120.6 | 125.4 |
| 13 | 62.3 | 59.4 |
| 12 | 60.6 | 58.9 |
| 14 | 18.8 | 17.8 |
| Proton | Calculated δ / ppm | Literature δ / ppm |
|---|---|---|
| 10 | 7.62 | 7.39 (d, 1 H, J = 7.4 Hz) |
| 4 | 7.39 | 7.26 (dd, 1 H, J = 7.4, 7.4 Hz) |
| 6 | 7.39 | 7.20 (dd, 1 H, J = 7.4, 7.4 Hz) |
| 8 | 7.25 | 7.09 (d, 1 H, J = 7.4 Hz) |
| 20 | 3.56 | 3.85 (d, 1 H, J = 4.5 Hz) |
| 21 | 3.48 | 3.74 - 3.73 (m, 1 H) |
| 13 | 2.95 | 2.79 (ddd, 1 H, J = 14.4, 14.4, 5.4 Hz) |
| 14 | 2.27 | 2.55 (dd, 1 H, J = 7.4, 7.4 Hz) |
| 16 | 2.21 | 2.44 - 2.39 (m, 1 H) |
| 17 | 1.87 | 1.77 (ddd, 1 H, J = 14.4, 14.4, 5.4 Hz) |
| Carbon atom | Calculated δ / ppm | Literature δ / ppm |
|---|---|---|
| 7 | 135.4 | 136.7 |
| 9 | 130.4 | 132.5 |
| 5 | 126.7 | 129.5 |
| 1 | 123.8 | 128.4 |
| 3 | 123.5 | 128.4 |
| 2 | 121.7 | 126.1 |
| 15 | 52.8 | 55.1 |
| 18 | 52.2 | 52.7 |
| 11 | 30.2 | 24.4 |
| 12 | 29.1 | 21.8 |
All of the calculated chemical shifts above are consistent with the literature. This indicates that for epoxides of this type QM calculations are very accurate and useful in predicting the NMR spectra.
Assigning the absolute configuration of trans-β-methylstyrene oxide and 1,2-dihydronaphthalene oxide
The reported literature for optical rotations
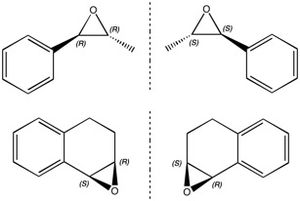
Trans-β-methylstyrene oxide and 1,2-dihydronaphthalene oxide each exist as a pair of enantiomers due to the presence of two chiral carbon centres in both (Figure 22). Trans-β-methylstyrene oxide has an (R,R) enantiomer and an (S,S) enantiomer and 1,2-dihydronaphthalene oxide has an (S,R) enantiomer and an (R,S) enantiomer. Each member of these enantiomeric pairs has an equal and opposite optical rotation to its corresponding enantiomer, at least one of which can be found in literature.
The optical rotation at 589 nm of (R,R)-trans-β-methylstyrene oxide is [α]D25 = +44.3o (c 0.32, CHCl3, ee 90%)[8] and (S,R)-1,2-dihydronaphthalene oxide [α]D25 = -39.0o (c 0.21, CHCl3, ee 99%)[9].
The calculated chiropractical properties of trans-β-methylstyrene oxide and 1,2-dihydronaphthalene oxide
Optical rotation (OR)
The optical rotation at 589 nm of each product and its possible enantiomers was calculated (Table 10).
| Enantiomer | Optical rotation / o |
|---|---|
| (R,R)-trans-β-methylstyrene oxide DOI:10042/26697 | +46.78 |
| (S,S)-trans-β-methylstyrene oxide DOI:10042/26698 | -46.77 |
| (S,R)-1,2-dihydronaphthalene oxide DOI:10042/26699 | -35.86 |
| (R,S)-1,2-dihydronaphthalene oxide DOI:10042/26700 | +35.86 |
Looking at Table 10, it is observed that the magnitude of the optical rotation for each member of the enantiomeric pair is the same. This demonstrates that the calculation has been run successfully and that a pair of enantiomers were indeed optimised. What's more, the calculated optical rotations are consistent with the experimentally obtained values, reported above.
The Electronic Circular Dichroism (ECD) spectra of the epoxide products
The UV-Vis and ECD spectra of the products were calculated (Figures 23 - 26).
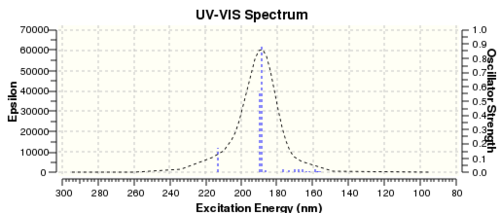
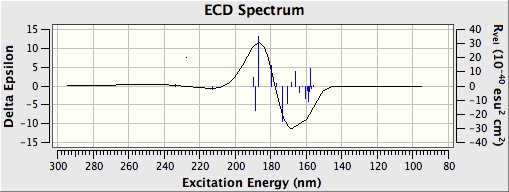
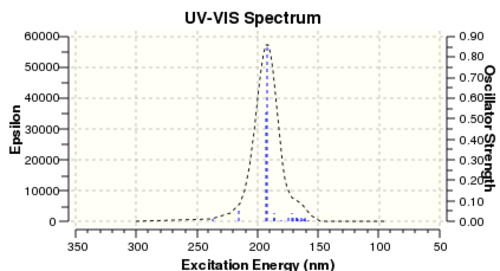
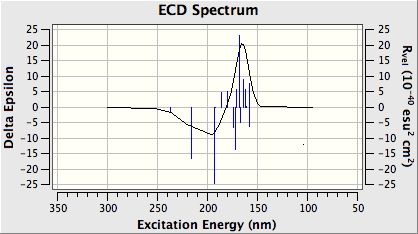
Not much can be said for the calculated UV-Vis and ECD spectra, since no appropriate chromophores exist in the molecules of the epoxide products.
The Vibrational Circular Dichroism (VCD) spectra of the epoxide products
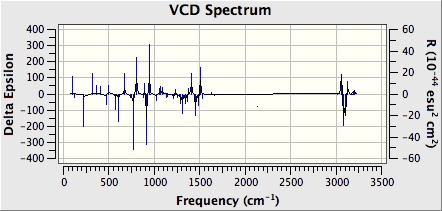
The IR and VCD spectra of each of the epoxide products were then calculated.
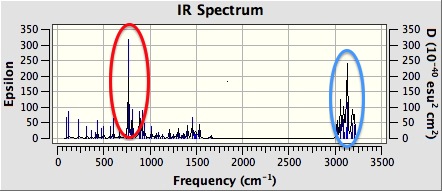
Figure 27 shows the computed IR spectrum of trans-β-methylstyrene oxide. There is a strong absorption between 750 and 900 cm-1 (red circle). This is likely due to C-O bond stretching in the epoxide ring. There is also a strong absorption between 3050 and 3100 cm-1 (blue circle). This is due to C-H bond stretching in the epoxide rings. Finally, there is a strong absorption between 3100 and 3200 cm-1 (blue circle). This is again due to C-H stretching, but this time in the phenyl group (blue circle).
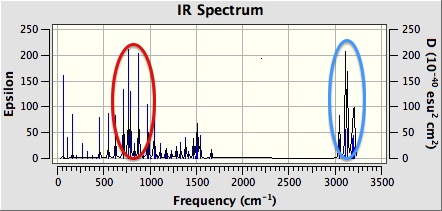
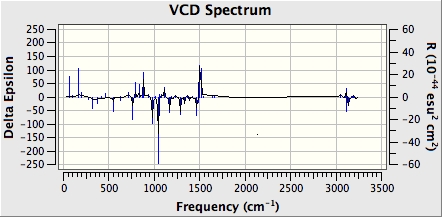
Figure 29 shows the computed IR spectrum of 1,2-dihydronaphthalene oxide. There is a strong absorption at around 750 cm-1 (red circle). This is likely due to C-O bond stretching in the epoxide ring. There is also a strong absorption between 3000 and 3100 cm-1 (blue circle). This is due to C-H bond stretching in the epoxide rings. Finally, there is a strong absorption between 3100 and 3200 cm-1 (blue circle). This is again due to C-H stretching, but this time in the phenyl group.
Using the calculated properties of transition state for the reaction of β-methyl styrene
Shi's catalyst
By analysing the possible transition states in the Shi epoxidation of trans-β-methylstyrene, the enantiomeric assignment of the epoxide product can be determined. For a fixed chirality of Shi catalyst, 8 transition states are possible for the transfer of oxygen from dioxirane. The transition state chosen can be either (R,R) or (S,S), can be the result of one of two dioxirane oxygen transfers, and can be either endo or exo.
Table 11 shows the calculated free energies of most stable transition states (with corrections for entropy, zero-point thermal energies and water solvation).
| Chirality of the transition state | Free energy / a.u. |
|---|---|
| (R,R) DOI:10.6084/m9.figshare.738037 | -1343.032443 |
| (S,S) DOI:10.6084/m9.figshare.739117 | -1343.024742 |
The change in free energy between configurations, ΔG, can then be calculated using Table 11.
ΔG = ΔG(R,R) - ΔG(S,S)
   = -1343.032443 a.u. - -1343.024742 a.u.
   = -0.007701 a.u.
   = -20.218977 kJ/mol
From this, the ratio of concentrations of the (R,R) and (S,S) transition states, K, can then be determined using
ΔG = -RTlnK
⇒ K = exp(-ΔG/RT)
     = exp(-(-20.218977 x 10<sup>3</sup>)/(8.3144 x 298))
     = 3499.6
The enantiomeric excess, ee, can then be determined using this K value. Let [R] = concentration of (R,R)-epoxide and [S] = concentration of (S,S)-epoxide, then
enantiomeric excess, ee = R% - S%
                         = ([R] - [S])/([R] + [S])
                         = ([R]/[S] - 1)/([R]/[S] + 1)
                         = (K - 1)/(K + 1)
                         = (3499.6 - 1)/(3499.6 + 1)
                         = 99.94%
The enantiomeric excess of the (R,R)-epoxide is 99.94% and is therefore formed preferentially to the (S,S)-epoxide when Shi's catalyst is used with the trans-alkene. This value is consistent with literature[4].
Jacobsen's catalyst
In a similar fashion to what was done with Shi's catalyst, but with cis-β-methylstyrene this time, the transition states of the Jacobsen epoxidation were analysed. For a fixed chirality of Jacobsen's catalyst there are 4 possible transition states. These possibilities arise from the choice of either an S,R or R,S chirality. For either chirality there is also the choice to be made about how the oxygen is transferred from Mn=O. Table 12 shows the calculated free energies of the most stable transition states (with corrections for entropy, zero-point thermal energies and water solvation).
| Chirality of the transition state | Free energy / a.u. |
|---|---|
| (S,R) DOI:10.6084/m9.figshare.740436 | -3383.259559 |
| (R,S) DOI:10.6084/m9.figshare.740437 | -3383.251060 |
The change in free energy between configurations, ΔG, can then be calculated using Table 12.
ΔG = ΔG(R,R) - ΔG(S,S)
   = -3383.259559 a.u. - -3383.251060 a.u.
   = -0.008499 a.u.
   = -22.314126 kJ/mol
From this, the ratio of concentrations of the (S,R) and (R,S) transition states, K, can then be determined using
ΔG = -RTlnK
⇒ K = exp(-ΔG/RT)
     = exp(-(-22.314126 x 10<sup>3</sup>)/(8.3144 x 298))
     = 8152.0
The enantiomeric excess, ee, can then be determined using this K value. Let [S,R] = concentration of (S,R)-epoxide and [R,S] = concentration of (R,S)-epoxide, then
enantiomeric excess, ee = S,R% - R,S%
                         = ([S,R] - [R,S])/([S,R] + [R,S])
                         = ([S,R]/[R,S] - 1)/([S,R]/[R,S] + 1)
                         = (K - 1)/(K + 1)
                         = (8152.0 - 1)/(8152.0 + 1)
                         = 99.97%
The enantiomeric excess of the (S,R)-epoxide is 99.97% and is therefore formed preferentially to the (R,S)-epoxide when Jacobsen's catalyst is used with the cis-alkene. This value is consistent with literature[10].
Investigating the non-covalent interactions (NCIs) in the active-site of the reaction transition state
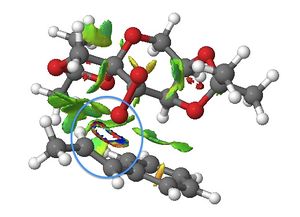
The NCIs of the lowest energy (R,R) transition state of the Shi epoxidation was investigated.
Looking at Figure 31, epoxide ring formation can be observed (blue circle) as a result of the transfer of one of the oxygen atoms of the dioxirane group of the Shi catalyst molecule to the carbon-carbon double bond in the trans-β-methylstyrene molecule. This interaction is of significant covalent character (termed 'half-covalent'), and so cannot strictly be described as an NCI.
The green cloud-like features in Figure 31 represent moderately attractive van der Waals interactions within the transition state. Specific interactions of note are between hydrogen atoms of adjacent methyl groups and those of the oxygen atoms at the anomeric centres with the hydrogen atoms of the methyl groups adjacent to them.
These interactions are all responsible for stabilisation of the transition state.
Investigating the Electronic topology (QTAIM) in the active-site of the reaction transition state
Carrying on from the NCI analysis, the electronic topology of the active-site of the (R,R) transition state was investigated. This allows for focus on the electron density of the covalent regions of the transition state, whilst still being able to analyse the non-covalent interactions.

From Figure 32, it can be observed that there are two covalent bonds between the carbon atom and the two oxygen atoms at one of the anomeric centres in the Shi catalyst molecule (red circle). Note that the BCPs (yellow spheres) are closer to the carbon atom due to the polarisation of the bond as a result of the electronegativity of oxygen (oxygen withdraws electron density from the the covalent bond towards itself).
There are also various non-covalent interactions present. There is a van der Waals interaction between a hydrogen atom of the Shi catalyst molecule and one of the carbon atoms in the benzene ring of the trans-β-methylstyrene molecule (green circle). In this case the BCP is ever so slightly closer to the hydrogen atom since the electronegativity of carbon is higher than that of hydrogen.
There is another van der Waals interaction between another one of the hydrogen atoms in the Shi catalyst molecule and one of the alkene carbon atoms in trans-β-methystyrene (blue circle). Again, the BCP is ever so slightly closer to the hydrogen atom since the electronegativity of carbon is higher than that of hydrogen.
Suggesting new candidates for investigations
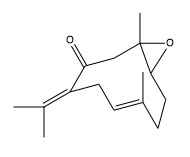
Using Reaxys with a query of an epoxide with an optical rotation greater than 500o, a molecule called germacrone-1,10-epoxide was found (Figure 33). The alkene precursor to this molecule is germacrone, which is an antiviral isolate of Geranium macrorrhizum[11]. This substance can also easily be sourced from Sigma Aldrich.
germ |
The optical rotation at 293 nm reported for the compound is [α]D25 = 786.5o (c 0.03, EtOH)[12].
References
- ↑ W. F. Maier and P. Von Rague Schleyer, J. Am. Chem. Soc., 1981, 103, 1891. DOI:10.1021/ja00398a003
- ↑ J. Bredt, Liebigs Ann., 1924, 437, 1-13. DOI:10.1002/jlac.19244370102
- ↑ L. Paquette, N. A. Pegg, D. Toops, G. D. Maynard and R. D. Rogers, J. Am. Chem. Soc., 1990, 112, 277-283. DOI:10.1021/JA00157a043
- ↑ 4.0 4.1 Z-X. Wang, Y. Tu, M. Frohn, J-R. Zhang and Y. Shi, J. Am. Chem. Soc., 1997, 119, 11224. DOI:10.1021/ja972272g
- ↑ W. Zhang and E. N. Jacobsen, J. Org. Chem., 1991, 56, 2296. DOI:10.1021/jo00007a012
- ↑ 6.0 6.1 H. Hachiya, Y. Kon, Y. Ono, K. Takumi, N. Sasagawa, Y. Ezaki and K. Sato, Synthesis, 2012, 44, 1672-1678. DOI:10.1055/s-0031-1290948
- ↑ 7.0 7.1 T. Niwa and M. Nakada, J. Am. Chem. Soc., 2012, 134, 13538-13541. DOI:10.1021/ja304219s
- ↑ O. A. Wong, B. Wang, M-X. Zhao and Y. Shi, J. Org. Chem., 2009, 74, 6335-6338. DOI:10.1021/jo900739q
- ↑ H. Lin, J. Qiao, Y. Liu and Z-L. Wu, J. Mol. Catal. B: Enzym., 2010, 67, 236-241. DOI:10.1016/j.molcatb.2010.08.012
- ↑ E. N. Jacobsen, W. Zhang, A. R. Muci, J. R. Ecker and L. Deng, J. Am. Chem. Soc., 1991, 113, 7063-7064. DOI:10.1021/ja00018a068
- ↑ Q. Liao, Z. Qian, R. Liu, L. An and X. Chen, Antiviral research, 2013, 100, 578-588. DOI:10.1016/j.antiviral.2013.09.021
- ↑ W. Reusch and C. K. Johnson, J. Org. Chem., 1963, 28, 2557. DOI:10.1021/jo01045a016


