Rep:Mod:DJJK111
3rd Year Computational Lab: Inorganic
Week 1: Compulsory section
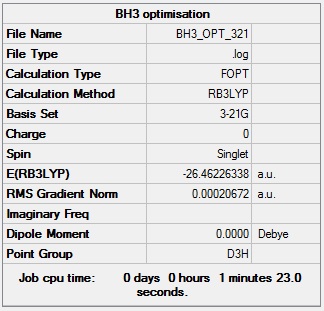
BH3 optimisation using a 3-21G basis set
BH3 3-21G optimisation log file: Media:BH3_OPT_321.LOG
BH3 3-21G optimisation calculation summary:
BH3 3-21G optimisation - evidence of convergence:
    Item               Value     Threshold  Converged?
 Maximum Force            0.000413     0.000450     YES
 RMS     Force            0.000271     0.000300     YES
 Maximum Displacement     0.001610     0.001800     YES
 RMS     Displacement     0.001054     0.001200     YES
 Predicted change in Energy=-1.071764D-06
 Optimization completed.
    -- Stationary point found.
Optimised H-B-H bond angle = 120.0°
optimised B-H bond length = 1.19 Å
Total energy of optimised BH3 molecule = -26.4623 a.u.
BH3 optimisation using a 6-31G(d,p) basis set
BH3 6-31G(d,p) optimisation log file: Media:BH3_OPT_631DP.LOG
BH3 6-31G(d,p) optimisation calculation summary:
BH3 6-31G(d,p) optimisation - evidence of convergence:
    Item               Value     Threshold  Converged?
 Maximum Force            0.000005     0.000450     YES
 RMS     Force            0.000003     0.000300     YES
 Maximum Displacement     0.000019     0.001800     YES
 RMS     Displacement     0.000012     0.001200     YES
 Predicted change in Energy=-1.305135D-10
 Optimization completed.
    -- Stationary point found.
Optimised H-B-H bond angle = 120.0°
Optimised B-H bond length = 1.19 Å
Total energy of optimised BH3 molecule = -26.6153 a.u.
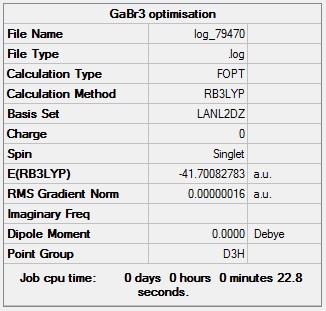
GaBr3 optimisation
GaBr3 optimisation log file: Media:Log_79470.log
Link to D-space entry: https://spectradspace.lib.imperial.ac.uk:8443/dspace/handle/10042/25212
GaBr3 optimisation calculation summary:
GaBr3 optimisation - evidence of convergence:
    Item               Value     Threshold  Converged?
 Maximum Force            0.000000     0.000450     YES
 RMS     Force            0.000000     0.000300     YES
 Maximum Displacement     0.000003     0.001800     YES
 RMS     Displacement     0.000002     0.001200     YES
 Predicted change in Energy=-1.282679D-12
 Optimization completed.
    -- Stationary point found.
Optimised Br-Ga-Br bond angle = 120.0°
Optimised Ga-Br bond length = 2.35 Å
This computed bond length is consistent with a literature value for the Ga-Br bond length using the B3LYP method, which presented a value of 2.35 Å.Cite error: Invalid parameter in <ref> tag
Total energy of optimised GaBr3 molecule = -47.7008 a.u.
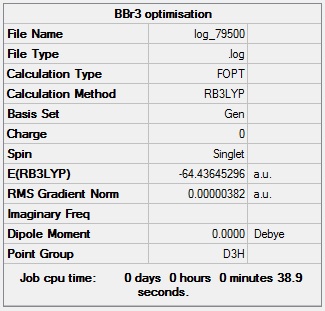
BBr3 optimisation
BBr3 optimisation log file: Media:Log_79500.log
Link to D-space entry: https://spectradspace.lib.imperial.ac.uk:8443/dspace/handle/10042/25230
BBr3 optimisation calculation summary:
BBr3 optimisation - evidence of convergence:
    Item               Value     Threshold  Converged?
 Maximum Force            0.000008     0.000450     YES
 RMS     Force            0.000005     0.000300     YES
 Maximum Displacement     0.000036     0.001800     YES
 RMS     Displacement     0.000023     0.001200     YES
 Predicted change in Energy=-4.027604D-10
 Optimization completed.
    -- Stationary point found.
Optimised Br-B-Br bond angle = 120.0°
Optimised B-Br bond length = 1.93 Å
Total energy of optimised BBr3 molecule = -64.4365 a.u.
Bond length comparison
| Molecule (AX3) | A-X bond length / Å |
|---|---|
| BH3 | 1.19 |
| GaBr3 | 2.35 |
| BBr3 | 1.93 |
Comparing BH3 and BBr3, it is observed that there is an increase in bond length. This is due to the increase in size from H to Br. Increasing the size of the ligand increases the steric repulsions between each of the ligands. The Br ligand therefore needs to move further away from the central B atom than the H ligand does, in order to minimise the potential energy due to steric repulsions. H is also closer to B in the periodic table than Br is to B, so H and B orbitals will be more similar in size than B and Br orbitals. Orbitals being similar in size leads to greater orbital overlap and hence a stronger (shorter) bond. There will therefore be greater orbital overlap in BH3. The B-H bond is stronger than the B-Br bond due to these reasons.
H and Br are similar in the sense that they both need only one electron to fill their outer shell. This means that they both tend to form a single bond to another substituent. They both also form a diatomic in their elemental form. They differ in size, i.e. Br is much larger than H, and other physical properties. H only possesses a s-orbital and B possesses both s and p-orbitals.
Comparing GaBr3 and BBr3, it is observed that there is a decrease in bond length. This is due to the fact that Ga has a very low electronegativity compared to Br. This means that the orbitals surrounding a Ga atom are very large and diffuse. This leads to poor overlap between Ga and Br atomic orbitals, resulting in a weak bond. B is more electronegative than Ga, and therefore has smaller, more concentrated atomic orbitals. These orbitals will be better matched to the Br atomic orbitals, leading to better overlap, and hence a stronger bond.
Ga and B are similar in the sense that they are both Group 13 elements and, as such, both tend to form three single bonds with other atoms and adopt a trigonal planar arrangement. They are different in so much as Ga is much larger than B and is less electronegative, meaning Ga has larger and more diffuse orbitals. Ga also has access to d-orbitals, while b only has s and p-orbitals.
Representation of bonding in Gaussview
A bond is a description of the electron density between two atoms. Here, we will only be addressing intramolecular bonds (bonds within a single molecule). A covalent bond between two atoms forms as a result of electrostatic forces of attraction between nuclei and electrons, which are said to be 'shared' between the two nuclei. Electrons in a covalent bond aren't always shared equally. We say that the bond is 'polar' if this is the case. Polarity arises from a phenomenon called electronegativity. Electronegativity is the ability of a covalently bonded atom to attract electron density from the bond towards itself. The difference in electronegativity between two covalently bonded atoms dictates where the electrons spend most of their time (or more accurately, nearer to which atom the electrons are most likely to be found).
In MO theory, a covalent bond is formed by the overlap of atomic orbitals to produce molecular orbitals. MO theory uses a linear combination of atomic orbitals (LCAO) to produce molecular orbitals, which describe the behaviour of the electrons in a molecule under the influence of the nuclei present. MOs are described as being bonding, anti-bonding and non-bonding. Electrons placed in a bonding orbital strengthen the bond, electrons placed in an anti-bonding orbital weaken the bond, and electrons placed in a non-bonnding orbital have no effect on the strength of the bond. By constructing a so-called 'MO diagram, whereby orbitals are arranged according to their energy, one can predict the nature of a bond in a molecule.
Another type of chemical bond is the ionic bond. This type of electrostatic attraction occurs between atoms which have a large difference in electronegativity, so large that we can now consider them to be ions (one positive, one negative). Ionic bonds are much stronger than covalent bonds.
Gaussview draws bonds based on a pre-defined distance criteria, so even though the program has not drawn bonds it does not mean they are not there. Bonds are drawn on Gaussview simply to help visualise the connectivity of a molecule. After optimisation it was observed that bonds where now included in the structure. This is due to all of the atoms occupying the correct position and orientation for the molecule to in fact exist. The otimisation brings the molecule into the pre-defined distance criteria set out by the program.
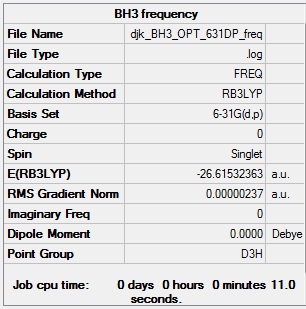
BH3 frequency analysis
BH3 frequency analysis log file: Media:DJK BH3 OPT 631DP FREQ.LOG
BH3 frequency calculation summary:
BH3 frequency analysis - evidence of convergence:
    Item               Value     Threshold  Converged?
 Maximum Force            0.000005     0.000450     YES
 RMS     Force            0.000002     0.000300     YES
 Maximum Displacement     0.000019     0.001800     YES
 RMS     Displacement     0.000009     0.001200     YES
 Predicted change in Energy=-1.323376D-10
 Optimization completed.
    -- Stationary point found.
BH3 low frequencies:
 Low frequencies ---   -0.9033   -0.7343   -0.0054    6.7375   12.2491   12.2824
 Low frequencies --- 1163.0003 1213.1853 1213.1880
These 'low frequencies' indicate that a minimum has in fact been found and the molecule was successfully optimised.
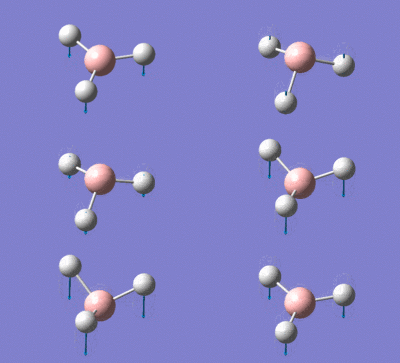
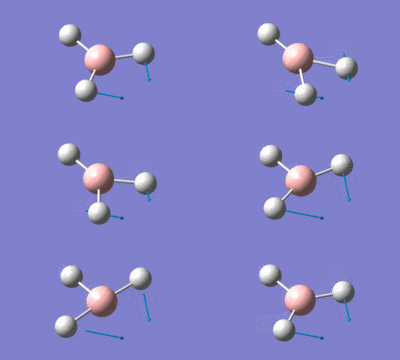
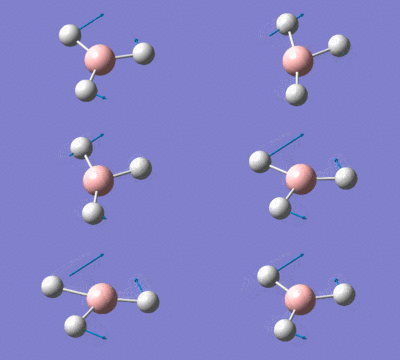
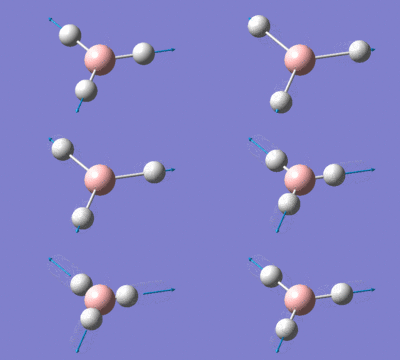
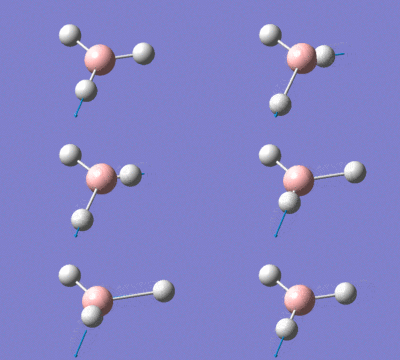
BH3 vibrational modes:
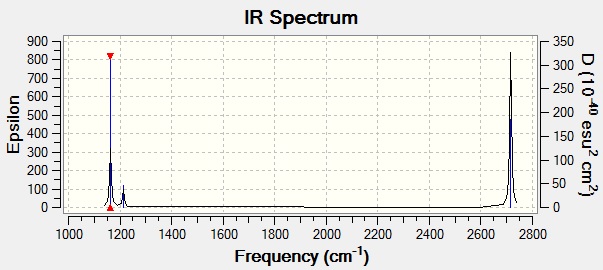
BH3 IR spectrum:
Looking at the spectrum it is observed that there are only 3 peaks in the IR spectrum when the table above contains 6 vibrational modes. one of the reasons for this is that only certain vibrational modes are IR-active. Only vibrational modes that result in a change in dipole moment of the molecule are IR-active. The vibration with A1′ symmetry is not IR-active since it is completely symmetrical, so there is no change in dipole moment.
There is also two sets of degenerate (E′) vibrational modes. One set corresponds to modes 3 and 4 in the table, the other set to modes 5 and 6. Both of the modes in a degenerate set have the same energy and therefore the same frequency. This means that on the IR spectrum the peaks responsible for both of these vibrational modes appear at the same frequency and intensity. The peaks are therefore superimposed upon each other and appear as a single peak.
GaBr3 frequency analysis
GaBr3 frequency analysis log file: Media:Log_79579.log
Link to D-space entry: https://spectradspace.lib.imperial.ac.uk:8443/dspace/handle/10042/25270
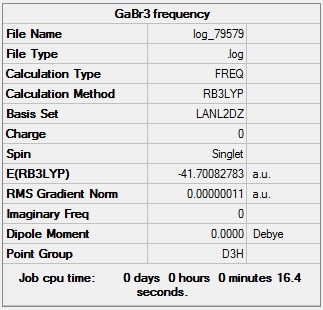
GaBr3 frequency calculation summary:
GaBr3 frequency analysis - evidence of convergence:
     Item               Value     Threshold  Converged?
 Maximum Force            0.000000     0.000450     YES
 RMS     Force            0.000000     0.000300     YES
 Maximum Displacement     0.000002     0.001800     YES
 RMS     Displacement     0.000001     0.001200     YES
 Predicted change in Energy=-6.142863D-13
 Optimization completed.
    -- Stationary point found.
GaBr3 low frequencies:
Low frequencies ---   -0.5252   -0.5247   -0.0024   -0.0010    0.0235    1.2010
Low frequencies ---   76.3744   76.3753   99.6982
These 'low frequencies' indicate that a minimum has in fact been found and the molecule was successfully optimised.
GaBr3 vibrational modes:
| Number | Form of vibration | Frequency / cm-1 | Intensity | Symmetry (D3h point group) |
|---|---|---|---|---|
| 1 |  |
79 | 3 | E′ |
| 2 | 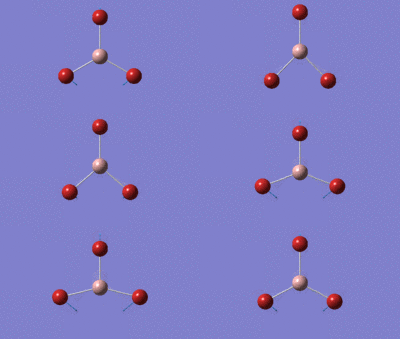 |
76 | 3 | E′ |
| 3 |  |
99 | 9 | A2′ |
| 4 |  |
197 | 0 | A1′ |
| 5 |  |
316 | 57 | E′ |
| 6 | 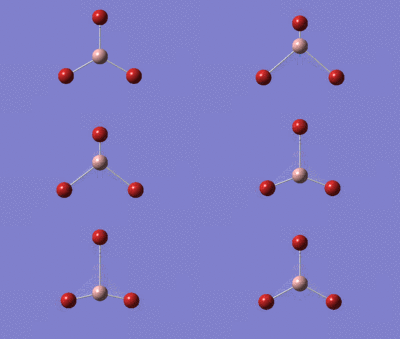 |
316 | 57 | E′ |
GaBr3 IR spectrum:
BH3 and GaBr3 frequency comparison
| Symmetry label | BH3 frequency / cm-1 | GaBr3 frequency / cm-1 | Mode in BH3 | Mode in GaBr3 |
|---|---|---|---|---|
| A1′ | 2582 | 197 | 4 | 4 |
| A2′ | 1163 | 100 | 1 | 3 |
| E′ | 1213 | 76 | 2 | 2 |
| E′ | 1213 | 79 | 3 | 1 |
| E′ | 2715 | 316 | 5 | 5 |
| E′ | 2715 | 316 | 6 | 6 |
Looking at the table above, it can be seen that the frequencies for BH3 are much higher than the ones for GaBr3. This is due to the fact that the B-H bond is stronger than the Ga-Br bond. Since the B-H bond is stronger than the Ga-Br a higher frequency (and therefore higher energy) of IR radiation is needed to bring about the same vibrations in BH3 that are observed in GaBr3. Ga and Br are also heavier than B and H, so their reduced mass is larger. Reduced mass influences the frequency of vibrations according to the formula f = √(k/μ), where k = force contsant and μ = reduced mass. Therefore as μ increases f decreases.
There has been a reordering of vibrational modes. This may be due to differences in MOs and reduced masses between the two molecules.
Both IR spectra are similar in the sense that they both only have 3 observable peaks. This is due to the reasons outlined above in the BH3 frequency analysis.
For both spectra two modes lie fairly closely together, the A2' and E' modes and then the other two modes which also lie fairly close together are the A1' and E' modes, but higher in energy. This is due to the fact that the latter set of modes are as a result of bond stretching, whereas the other modes are as a result of changing bond angles (wagging). There is higher energy associated with bond stretching.
Methods, basis sets and frequency analysis
The same method and basis set must be used for both optimisation and frequency calculations since it provides the conditions and assumptions from which the entire computational process is based on. If a particular method and basis set were used for the optimisation and then others were used for the frequency calculation, then this frequency calculation would not correspond to the said optimisation and would hence be irrelevant and misleading.
The purpose of a frequency analysis is to ensure that we do in fact have a minimum structure as a result of the otimisation. We can also gather from a frequency analysis the number of vibrational modes present in a molecule, how they appear, and of what frequency and intensity they are. A predicted IR spectrum can also be generated.
The 'low frequencies' represent the '-6' frequencies from the formula used to calculate the number of vibrational modes (3N-6). They are NOT the frequencies of any of the vibrational modes present in the molecule.
BH3 molecular orbitals
BH3 population analysis log file: Media:Log_79708.log
Link to D-space entry: https://spectradspace.lib.imperial.ac.uk:8443/dspace/handle/10042/25343
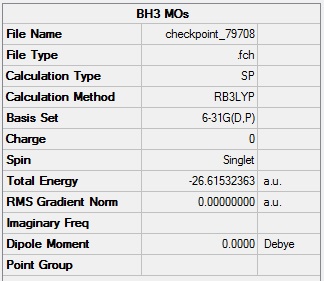
BH3 population analysis calculation summary:
BH3 MO diagram:
Looking at the MO diagram above, it can be seen that there are no significant differences between the LCAO MOs that have been drawn and the computed 'real' MOs, i.e. the same phase patterns are observed. This therefore suggests that in this case qualitative MO theory is useful in predicting accurately the MOs present in the BH3 molecule.
NH3 optimisation
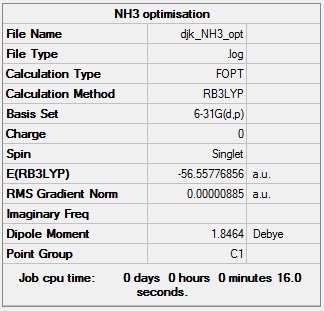
NH3 optimisation log file: Media:DJK_NH3_OPT.LOG
NH3 optimisation calculation summary:
NH3 optimisation - evidence for convergence:
     Item               Value     Threshold  Converged?
 Maximum Force            0.000024     0.000450     YES
 RMS     Force            0.000012     0.000300     YES
 Maximum Displacement     0.000079     0.001800     YES
 RMS     Displacement     0.000053     0.001200     YES
 Predicted change in Energy=-1.629715D-09
 Optimization completed.
    -- Stationary point found.
NH3 frequency analysis
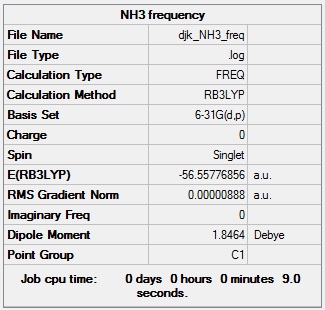
NH3 frequency analysis log file: Media:DJK_NH3_FREQ.LOG
NH3 frequency calculation summary:
NH3 frequency calculation - evidence for convergence:
     Item               Value     Threshold  Converged?
 Maximum Force            0.000021     0.000450     YES
 RMS     Force            0.000009     0.000300     YES
 Maximum Displacement     0.000077     0.001800     YES
 RMS     Displacement     0.000039     0.001200     YES
 Predicted change in Energy=-1.603127D-09
 Optimization completed.
    -- Stationary point found.
NH3 low frequencies:
 Low frequencies ---  -30.7764   -0.0011    0.0015    0.0018   20.3142   28.2484
 Low frequencies --- 1089.5557 1694.1237 1694.1868
These 'low frequencies' indicate that a minimum has in fact been found and the molecule was successfully optimised.
NH3 population analysis
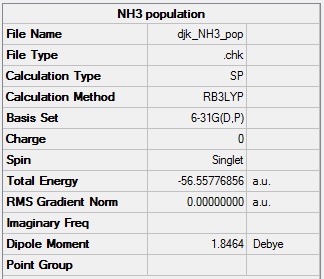
NH3 population analysis log file: Media:DJK_NH3_POP.LOG
NH3 population analysis calculation summary:
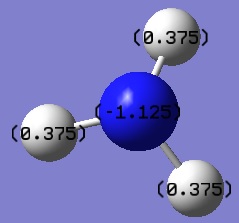
NH3 NBO analysis
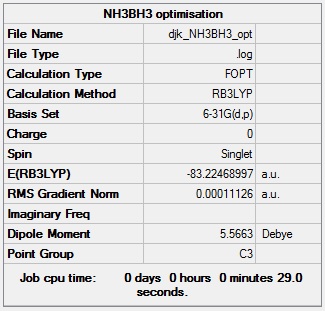
NH3BH3 optimisation
NH3BH3 optimisation log file: Media:DJK_NH3BH3_OPT.LOG
NH3BH3 optimisation calculation summary:
NH3BH3 optimisation - evidence for convergence:
      Item               Value     Threshold  Converged?
 Maximum Force            0.000232     0.000450     YES
 RMS     Force            0.000083     0.000300     YES
 Maximum Displacement     0.001201     0.001800     YES
 RMS     Displacement     0.000370     0.001200     YES
 Predicted change in Energy=-4.015840D-07
 Optimization completed.
    -- Stationary point found.
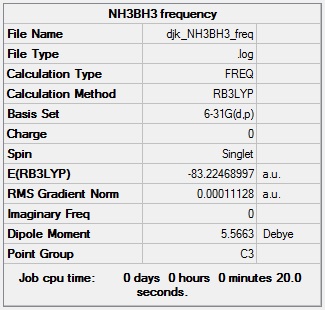
NH3BH3 frequency analysis
NH3BH3 frequency calculation log file: Media:DJK_NH3BH3_FREQ.LOG
NH3BH3 frequency calculation summary:
NH3BH3 - evidence for convergence:
     Item               Value     Threshold  Converged?
 Maximum Force            0.000349     0.000450     YES
 RMS     Force            0.000111     0.000300     YES
 Maximum Displacement     0.001349     0.001800     YES
 RMS     Displacement     0.000454     0.001200     YES
 Predicted change in Energy=-5.205619D-07
 Optimization completed.
    -- Stationary point found.
NH3BH3 low frequencies:
 Low frequencies ---   -0.1107   -0.0839   -0.0133   16.4522   16.4642   41.2577
 Low frequencies ---  265.3888  634.4498  639.9117
These 'low frequencies' indicate that a minimum has in fact been found and the molecule was successfully optimised.
Association energy calculation: NH3BH3
E(NH3) = -26.6153 a.u.
E(BH3) = -56.5578 a.u.
E(NH3BH3) = -83.2247 a.u.
ΔE = -0.0516 a.u. = -135.5 kJ/mol
This ΔE value is consistent with typical bond energy values, and so indicates that the reult of the calculations is reasonable.
Week 2: Mini project - Ionic liquids
[N(CH3)4]+ optimisation
[N(CH3)4]+ optimisation log file: Media:Djjk_NCH3_opt.log
Link to D-space entry: https://spectradspace.lib.imperial.ac.uk:8443/dspace/handle/10042/25506
[N(CH3)4]+ optimisation calculation summary:
[N(CH3)4]+ optimisation - evidence of convergence:
     Item               Value     Threshold  Converged?
 Maximum Force            0.000074     0.000450     YES
 RMS     Force            0.000017     0.000300     YES
 Maximum Displacement     0.001369     0.001800     YES
 RMS     Displacement     0.000358     0.001200     YES
 Predicted change in Energy=-5.535155D-08
 Optimization completed.
    -- Stationary point found.
Optimised bond angles:
C-N-C = 109.4°
N-C-H = 108.9°
H-C-H = 110.1°
All of these bond angles are from tetrahedral geometries. The bond angles are close to the ideal bond angles for a tetrahedral structure, which is 109.9°. This means that the structure has been optimised to a configuration which is energetically favourable. Steric hindrance is not an issue in this molecule since all of the bonds were able to adopt angles close to the ideal value for a tetrahedral arrangement.
Optimised bond lengths:
N-C = 1.51 Å
C-H = 1.09 Å
These bond lengths are consistent with the expected N-C and C-H bond lengths of 1.47 Å and 1.06 Å respectively.Cite error: Invalid parameter in <ref> tag. This shows that the molecule has been optimised correctly to create an energetically favourable molecule.
[N(CH3)4]+ frequency analysis
[N(CH3)4]+ frequency calculation log file: Media:Djjk_NCH3_freq.log
Link to D-space entry: https://spectradspace.lib.imperial.ac.uk:8443/dspace/handle/10042/25515
[N(CH3)4]+ frequency calculation summary:
[N(CH3)4]+ frequency calculation - evidence of convergence:
     Item               Value     Threshold  Converged?
 Maximum Force            0.000072     0.000450     YES
 RMS     Force            0.000021     0.000300     YES
 Maximum Displacement     0.000800     0.001800     YES
 RMS     Displacement     0.000254     0.001200     YES
 Predicted change in Energy=-4.969440D-08
 Optimization completed.
    -- Stationary point found.
[N(CH3)4]+ low frequencies:
 Low frequencies ---  -13.0199   -0.0005   -0.0005    0.0008    6.1789   11.9613
 Low frequencies ---  179.8989  278.8683  285.7126
These 'low frequencies' indicate that a minimum has in fact been found and the molecule was successfully optimised.
[N(CH3)4]+ molecular orbitals
[N(CH3)4]+ population analysis log file: Media:DJJK_NCH3_MO.LOG
[N(CH3)4]+ population analysis calculation summary:
Examples of non-core [N(CH3)4]+ MOs:
[N(CH3)4]+ NBO analysis
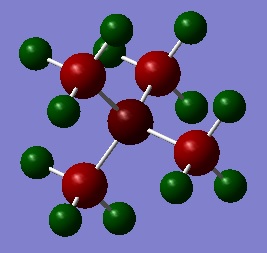
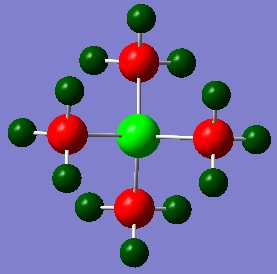
[P(CH3)4]+ optimisation
[P(CH3)4]+ optimisation log file: Media:Djjk_PCH3_opt.log
Link to D-space entry: https://spectradspace.lib.imperial.ac.uk:8443/dspace/handle/10042/25557
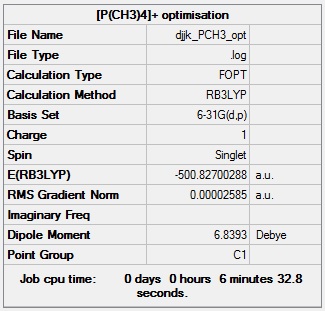
[P(CH3)4]+ optimisation calculation summary:
[P(CH3)4]+ optimisation - evidence for convergence:
     Item               Value     Threshold  Converged?
 Maximum Force            0.000148     0.000450     YES
 RMS     Force            0.000033     0.000300     YES
 Maximum Displacement     0.000960     0.001800     YES
 RMS     Displacement     0.000313     0.001200     YES
 Predicted change in Energy=-1.854508D-07
 Optimization completed.
    -- Stationary point found.
Optimised bond angles:
C-P-C = 109.4°
P-C-H = 110.0°
H-C-H = 109.0°
All of these bond angles are from tetrahedral geometries. The bond angles are close to the ideal bond angles for a tetrahedral structure, which is 109.9°. This means that the structure has been optimised to a configuration which is energetically favourable. Steric hindrance is not an issue in this molecule since all of the bonds were able to adopt angles close to the ideal value for a tetrahedral arrangement.
Optimised bond lengths:
P-C = 1.82 Å
C-H = 1.09 Å
These bond lengths are consistent with the expected P-C and C-H bond lengths of 1.80 Å and 1.06 Å respectively.Cite error: Invalid parameter in <ref> tag. This shows that the molecule has been optimised correctly to create an energetically favourable molecule.
[P(CH3)4]+ frequency analysis
[P(CH3)4]+ frequency calculation log file: Media:Djjk_PCH3_freq.log
Link to D-space entry: https://spectradspace.lib.imperial.ac.uk:8443/dspace/handle/10042/25558
[P(CH3)4]+ frequency calculation summary:
[P(CH3)4]+ low frequencies:
 Low frequencies ---  -16.6401    0.0020    0.0025    0.0034    4.1146   16.1794
 Low frequencies ---  153.2912  183.0746  190.9458
These 'low frequencies' indicate that a minimum has in fact been found and the molecule was successfully optimised.
[P(CH3)4]+ molecular orbitals
[P(CH3)4]+ population analysis log file: Media:DJJK_PCH3_MO.LOG
[P(CH3)4]+ population analysis calculation summary:
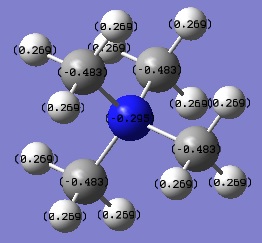
[P(CH3)4]+ NBO analysis
[S(CH3)3]+ optimisation
[S(CH3)3]+ optimisation log file: Media:Djjk_SCH3_opt.log
Link to D-space entry: https://spectradspace.lib.imperial.ac.uk:8443/dspace/handle/10042/25566
[S(CH3)3]+ optimisation calculation summary:
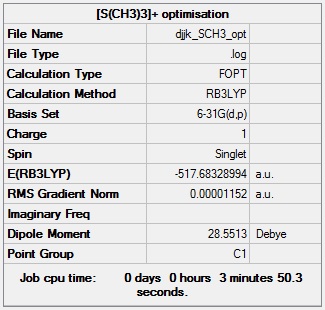
[S(CH3)3]+ optimisation - evidence of convergence:
     Item               Value     Threshold  Converged?
 Maximum Force            0.000018     0.000450     YES
 RMS     Force            0.000010     0.000300     YES
 Maximum Displacement     0.000252     0.001800     YES
 RMS     Displacement     0.000094     0.001200     YES
 Predicted change in Energy=-1.310349D-08
 Optimization completed.
    -- Stationary point found.
Optimised bond angles:
C-S-C = 102.8°
S-C-H = 107.3°
S-C-H (proton anti-periplanar to lone pair on S) = 110.6°
H-C-H = 109.4°
H-C-H (proton anti-periplanar to lone pair on S) = 111.1°
All of these bond angles are from tetrahedral geometries. The bond angles are close to the ideal bond angles for a tetrahedral structure, which is 109.9°. This means that the structure has been optimised to a configuration which is energetically favourable. Steric hindrance is not an issue in this molecule since all of the bonds were able to adopt angles close to the ideal value for a tetrahedral arrangement.
Optimised bond lengths:
S-C = 1.82 Å
C-H = 1.09 Å
These bond lengths are consistent with the expected N-C and C-H bond lengths of 1.82 Å and 1.06 Å respectively.Cite error: Invalid parameter in <ref> tag. This shows that the molecule has been optimised correctly to create an energetically favourable molecule.
[S(CH3)3]+ frequency analysis
[S(CH3)3]+ frequency calculation log file: Media:Djjk_SCH3_freq.log
Link to D-space entry: https://spectradspace.lib.imperial.ac.uk:8443/dspace/handle/10042/25577
[S(CH3)3]+ frequency calculation summary:
[S(CH3)3]+ low frequencies:
 Low frequencies ---   -0.0050   -0.0040   -0.0035   13.0380   16.6313   30.4044
 Low frequencies ---  160.2038  197.0879  200.4579
These 'low frequencies' indicate that a minimum has in fact been found and the molecule was successfully optimised.
[S(CH3)3]+ molecular orbitals
[S(CH3)3]+ population analysis log file: Media:DJJK_SCH3_MO.LOG
[S(CH3)3]+ population analysis calculation summary:
[S(CH3)3]+ NBO analysis
Charge distribution comparison
| Molecular ion | Charge on central atom | Charge on C | Charge on H |
|---|---|---|---|
| [N(CH3)4]+ | -0.295 | -0.483 | +0.269 |
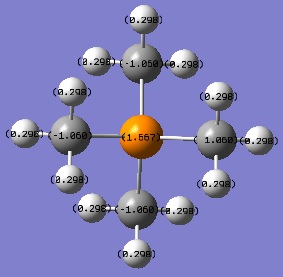
| [P(CH3)4]+ | +1.667 | -1.060 | +0.298 |
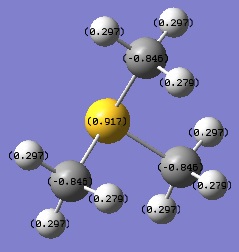
| [S(CH3)3]+ | 0.917 | -0.845 | +0.279, +0.297 |
Looking at the table above, it can be seen that the N atom is by far the most negatively charged of all the central atoms studied. This due to nitrogen being a very electronegative element, much more electronegative than carbon. This draws electron density away from the C atom towards N. Notice also that the C atom in [N(CH3)4]+ is the least negatively charged. This supports the idea of N withdrawing electron density towards itself.
The above phenomenon is far less pronounced for P and S. This is due to the relatively low electronegativities of phosphorus and sulfur, which are, more importantly, very similar to that of carbon, leading to a very low bond polarity. Sulfur has an ever so slightly greater electronegativity than carbon, so S the S atom draws electron density away from the C atom. Comparing with [P(CH3)4]+, this leads to a less positively charged central atom and less negatively charged C atom in [S(CH3)4]+. Phosphorus is less electronegative than carbon so the reverse is true in this case, i.e. the C atom withdraws electron density from the C atom, leading to a more positively charged central atom and a more negatively charged C atom in [P(CH3)4]+ compared to the other two complexes.
The effects described above do occur with the H atoms also, but to a very small extent (charges on H atoms are very similar for all the complexes). This is due to proximity of the H atoms from the central atom, i.e. they are too far away to be affected by the presence of electronegative elements. In [S(CH3)3]+ it is observed that in each methyl group there are two protons with the same charge and are more positively charged than the remaining proton. To understand why this is the case we have to look at σ/σ* conjugation. In this system we have σSLp/σ*C-H conjugation. The proton with the lower positive charge has an anti-periplanar relationship with the lone pair of electrons on the S atom. This allows the S atom to donate the lone pair into the C-H σ* orbital, therefore lowering the charge on the proton by increasing the electron density surrounding it, making it lower in charge than the other two protons.
Relative contribution of the C and heteroatom to the C-X bond
| Molecular ion | Contribution of C / % | Contribution of heteroatom / % |
|---|---|---|
| [N(CH3)4]+ | 33.65 | 66.35 |
| [P(CH3)4]+ | 59.56 | 40.44 |
| [S(CH3)3]+ | 48.67 | 51.33 |
The C and heteroatom contributions to the C-X bond given in the table above are consistent with the relative charge distributions discussed earlier. The above results can easily be rationalised with simple electronegativity arguments. It is observed that the more positively charged the heteroatom is, the greater the contribution of C to the bond.
From the table above, it is apparent that the C atom contributes to the bond in the order C(P)>C(S)>C(N) and from the relative charge distribution table it is shown that the positive charge on the central atom decreases in the order P>S>N. This supports the observation above.
This is due to the more electronegative element 'holding onto' its share of the electron density so this electron density is not used in the bond. The C atom therefore has to make up for this by donating more of its own electron density into the bond, and so contributes more. The N atom does this most effectively since it is the most electronegative, followed by S and then P.
[NR4]+ and formal charge
 Formal charge is the charge given an atom in a molecule if the effects of electronegativity are completely ignored, i.e. the electrons in a covalent bond are considered to be shared equally among both of the atoms bonded together.
The formal charge on an atom can be determined using the formula FC = V - N - B/2, where V = the number of valence electrons the atom possesses prior to bonding, N = the number of non-bonding electrons the atom possesses, and B = the number of electrons shared in bonds.
Using this for [NR4]+ compounds, where R is an alkyl group, V = 5, N = 0 and B = 8.
FC = 5 - 0 - 8/2 = +1
A formal 1+ charge is therefore placed on the N atom in the [NR4]+ Lewis structure.
In reality however, the nature of charge in [NR4]+ is very different.
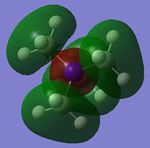
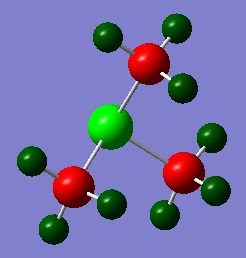
Looking at the NBO analysis of [N(CH3)4]+ above, it can be seen that the N atom is in fact ever so slightly negatively charged, as indicated by their dark red colouration. The positive charge manifests itself mostly in the methyl protons of the ligands, as indicated by their green colouration. This observation is completely contrary to the traditional representation of molecular charge as seen in Lewis structures. Therefore use of formal charges and the Lewis structure given above are both not valid in providing an accurate representation of a [NR4]+ molecular ion.
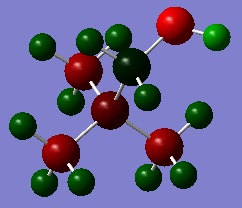
[N(CH3)3(CH2OH)]+ optimisation
[N(CH3)3(CH2OH)]+ optimisation log file: Media:Djjk_NOH_opt.log
Link to D-space entry: https://spectradspace.lib.imperial.ac.uk:8443/dspace/handle/10042/25637
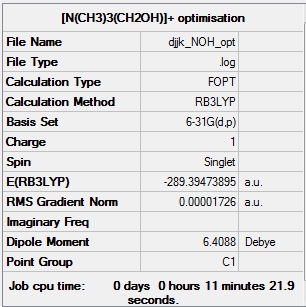
[N(CH3)3(CH2OH)]+ optimisation calculation summary:
[N(CH3)3(CH2OH)]+ optimisation - evidence of convergence:
     Item               Value     Threshold  Converged?
 Maximum Force            0.000077     0.000450     YES
 RMS     Force            0.000011     0.000300     YES
 Maximum Displacement     0.001223     0.001800     YES
 RMS     Displacement     0.000313     0.001200     YES
 Predicted change in Energy=-3.692574D-08
 Optimization completed.
    -- Stationary point found.
[N(CH3)3(CH2OH)]+ frequency analysis
[N(CH3)3(CH2OH)]+ frequency calculation log file: Media:Djjk_NOH_freq.log
Link to D-space entry: https://spectradspace.lib.imperial.ac.uk:8443/dspace/handle/10042/25638
[N(CH3)3(CH2OH)]+ frequency calculation summary:
[N(CH3)3(CH2OH)]+ low frequencies:
 Low frequencies ---   -0.0006    0.0004    0.0010    9.8176   22.9903   23.6956
 Low frequencies ---  136.0803  212.9894  256.6923
These 'low frequencies' indicate that a minimum has in fact been found and the molecule was successfully optimised.
[N(CH3)3(CH2OH)]+ molecular orbitals
[N(CH3)3(CH2OH)]+ population analysis log file: Media:DJJK_NOH_MO.LOG
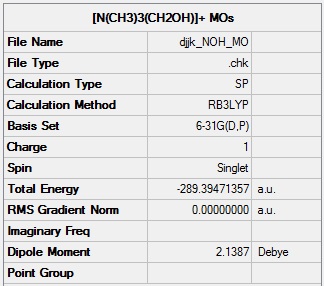
[N(CH3)3(CH2OH)]+ population analysis calculation summary:
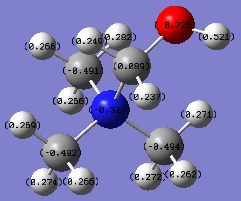
[N(CH3)3(CH2OH)]+ NBOs
[N(CH3)3(CH2CN)]+ optimisation
[N(CH3)3(CH2CN)]+ optimisation log file: Media:Djjk_NCN_opt.log
Link to D-space entry: https://spectradspace.lib.imperial.ac.uk:8443/dspace/handle/10042/25622
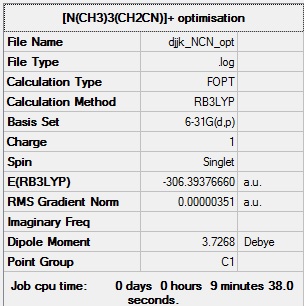
[N(CH3)3(CH2CN)]+ optimisation calculation summary:
[N(CH3)3(CH2CN)]+ optimisation - evidence of convergence:
     Item               Value     Threshold  Converged?
 Maximum Force            0.000005     0.000450     YES
 RMS     Force            0.000001     0.000300     YES
 Maximum Displacement     0.000234     0.001800     YES
 RMS     Displacement     0.000061     0.001200     YES
 Predicted change in Energy=-8.870706D-10
 Optimization completed.
    -- Stationary point found.
[N(CH3)3(CH2CN)]+ frequency analysis
[N(CH3)3(CH2CN)]+ frequency calculation log file: Media:Djjk_NCN_freq.log
Link to D-space entry: https://spectradspace.lib.imperial.ac.uk:8443/dspace/handle/10042/25629
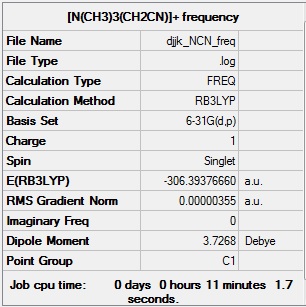
[N(CH3)3(CH2CN)]+ frequency calculation summary:
[N(CH3)3(CH2CN)]+ low frequencies:
 Low frequencies ---   -6.8302   -4.0426   -0.0004    0.0011    0.0011   14.9043
 Low frequencies ---   91.7571  154.3923  212.6461
These 'low frequencies' indicate that a minimum has in fact been found and the molecule was successfully optimised.
[N(CH3)3(CH2CN)]+ molecular orbitals
[N(CH3)3(CH2CN)]+ population analysis log file: Media:DJJK_NCN_MO.LOG
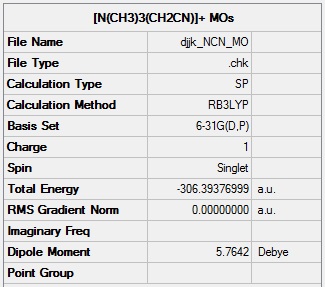
[N(CH3)3(CH2CN)]+ population analysis calculation summary:
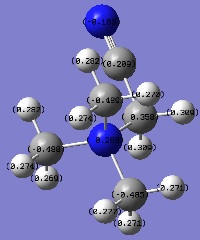
[N(CH3)3(CH2CN)]+ NBOs
Effects of OH and CN on charge distibution
| Molecular ion | Charge on adjacent C atom | Charge on central atom |
|---|---|---|
| [N(CH3)3(CH2OH)]+ | +0.089 | -0.322 |
| [N(CH3)3(CH2CN)]+ | +0.358 | -0.289 |
OH is an electron donating group, despite the high electonegativity of oxygen, due to the fact that the O atom is very electron rich (possesses two lone pairs). These lone pairs of electrons can donate into the system (resonance effect), increasing the negative charge on the adjacent C atom and central atom. this is evidenced by the data above, whereby C atom adjacent to the OH group in [N(CH3)3(CH2OH)]+ is less positive than in [N(CH3)3(CH2CN)]+ and the central atom is more negative in [N(CH3)3(CH2OH)]+ than in [N(CH3)3(CH2CN)]+.
CN is an electron withdrawing group, despite the fact that the N atom possesses a lone pair of electrons which are potentially available to be donated into the system. The reason this doesn't in fact happen can be explained by looking at the nature of the CN triple bond. The triple bond consists of a σ bond and two π bonds. These π bonds are orthogonal to each other and the σ bond points towards the C atom. This means that the only conceivable position for the N lone pair to be in would be in the opposite direction to the σ bond. As a result of this there is no way for the lone pair to interfere with the resonance of the structure and effectively stays on the N atom. Since nitrogen is electronegative, this withdraws electron density away from the adjacent C atom, leaving it electron deficient. In order to eliminate this deficiency the system will try to donate electron density to the C atom, so the CN group as a whole is electron withdrawing. This phenomenon is validated by the results in the table above. Notice that compared to the [N(CH3)3(CH2OH)]+ ion, the [N(CH3)3(CH2CN)]+ has a less negatively charged central atom and a more positively charged adjacent C atom. This is due to electron density being withdrawn from the central atom and the C atom adjacent to CN to the CN group, via the mechanism described above.
HOMO-LUMO comparison
| Molecular ion | Appearance of HOMO | Appearance of LUMO | Energy of HOMO / a.u. | Energy of LUMO / a.u. |
|---|---|---|---|---|
| [N(CH3)4]+ | 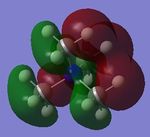 |
 |
-0.5793 | -0.1331 |
| [N(CH3)3(CH2OH)]+ | 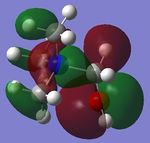 |
 |
-0.4887 | -0.1247 |
| [N(CH3)3(CH2CN)]+ | 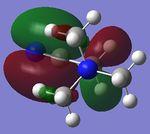 |
 |
-0.5005 | -0.1818 |
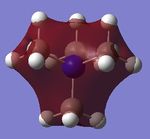
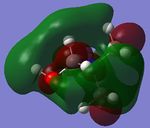
Looking at the shapes of the orbitals, it can be seen that in [N(CH3)4]+ we have simple p-orbital overlap (pure σ interactions), covering all of the molecule. On replacing CH3 with OH or CN, it can be seen that there are now some π interactions, and not all of the molecule is covered by the MO. The LUMOs of all the molecules show very strong anti-bonding character.
On replacing the methyl group with CN or OH, the energy of the HOMO increases (becomes more positive) in the order CH3<CN<OH. This however is not observed for the LUMOs, where the energy of the LUMO increases in the order CN<CH3<OH.
The HUMO-LUMO gap is largest for [N(CH3)4]+. This would indicate that it is the least reactive of all the complexes studied since the LUMO is of too high an energy to overlap well with an incoming reactant and is not close enough to the HOMO to allow significant interaction between the two.
The HUMO-LUMO gap is smallest for [N(CH3)3(CH2CN)]. This would indicate that this is the most reactive of all the complexes studied since the LUMO is low enough in energy to interact with the HOMO and any incoming reactant.
The reactivity of [N(CH3)3(CH2OH)]+ is somewhere in between.
This change of HUMO-LUMO gap is due to the electron inductive effects of the CN and OH ligands.

