Rep:Mod:Cranberry
COMPUTATIONAL LABORATORIES AUTUMN 2008 - Module 3 (physical)
The Cope Rearrangement – An Introduction and Tutorial
Introduction
The Cope rearrangement of 1,5-cyclohexadiene is an example of a [3,3]-sigmatropic shift reaction, generally considered to occur by a concerted mechanism. It can be represented as follows:
Figure 1
The transition state of this rearrangement can take either a chair or boat form, the boat considerably higher in energy than the chair. Using theoretical models, these transition states have been located and optimised, and their energies and geometries compared.
Optimising the Reactants and Products
In obtaining the energy and geometry of a particular transition state, there must first be analysis and optimisation of the reactants and products.
1,5-hexadiene can be drawn with either an anti or gauche linkage between the central four carbons. There are then many possible conformations of these two, formed as a result of rotation of the two terminal alkene bonds relative to each other. All these have slightly different energies. On optimisation, an anti or gauche molecule formed manually with Gaussview could take any one of these conformations as a local energy minimum depending on the initial geometry of the input structure.
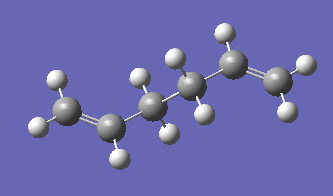
A molecule of anti 1,5-hexadiene was optimised using the Hartree Fock method and 3-21G basis set. The optimised structure appeared as follows:
Figure 2
It has energy of -231.69253596 a.u. and point group Ci. It corresponds to the structure anti 2 shown in Appendix 1, and has exactly the same energy.
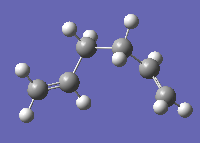
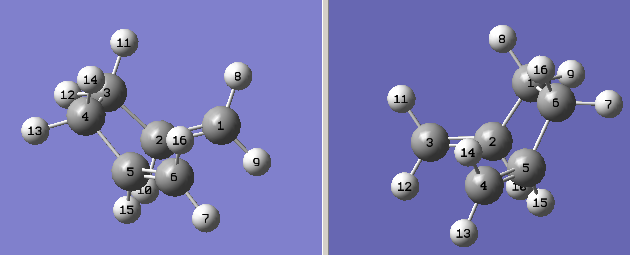
Gauche forms would be expected to have slightly higher energy than anti forms due to the increased, destabilising steric interactions associated with putting the terminal atoms of the chain closer together. However, on optimising the gauche form, the following structure was obtained, with a lower energy of -231.69266122 a.u. and point group C1:
Figure 3
This structure has the same geometry and energy as gauche 3 shown in Appendix 1, and is the lowest energy structure for 1,5-cyclohexadiene.
The energy of this gauche conformer is 0.0786kcal/mol lower than that of the anti, which, as implied above, is not what would be expected. On drawing the Newman projections of the two structures (figure 4), it is clear that there will be much greater steric interactions present in the gauche conformer. Based purely on steric considerations, one would expect the anti 2 conformer to be the lowest in energy:
Figure 4
However, in putting the two alkene bonds close together as in the gauche conformer allows for a favourable interaction between the π orbital of one double bond with the vinyl hydrogen atom of the other, an interaction believed to be hydrogen bond like. This interaction cannot occur in the anti conformer as the orbitals are simply too far away. One must conclude that the stabilisation gain in forming this interaction is greater than that lost by steric repulsions. However, it is very important to not here that the energy difference between them is only 0.0786kcal/mol and recent publication[1] has questioned the quantitative accuracy of some computational methods in establishing the energy minima of hexadiene conformations. It is considered that some methods treat hexadiene too much like n-butadiene, in which energy differences between conformers are much greater: the two alkene bonds are much closer together and so the π-CH overlap is much stronger and more significant. Importantly, different modelling methods and basis sets have been shown to give different orderings in energy. The conformer anti 1, for example, has also been shown repeatedly to be the global minimum[1] [2] (difference in energy of only 0.04kcal/mol from gauche 3). Indeed, the energies of all hexadiene conformers are very similar, and with the levels of accuracy available in modelling softwares today, one must perhaps consider a large number of hexadiene conformers degenerate. Some are, however, considerably higher energy forms, which all models show.
In theory, any conformer of hexadiene should be able to be used in the prediction and calculation of the transition state of the Cope rearrangement. However, as shall be seen, many work better than others.
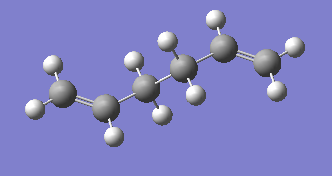
Initially, the Ci anti conformer was tried. It first had to be optimised further, (HF/3-21G is a fairly low level basis set), and so the optimisation was repeated using the DFT method and 6-31G* basis set. The structure appeared as follows:
Figure 5
As can be seen on comparison with figure 1, there is no evident change in geometry between the two structures, and the point group is still Ci. However, analysis of the bond lengths show that higher level optimisation has increased the length of the double bonds but decreased the length of the single bonds. The angles between bonds at each carbon have also marginally increased following higher level optimisation. This can perhaps imply that there is now more electron conjugation present throughout the entire structure (all the bonds are more equal in length). This will result in slight stabilisation, and should lower the energy of the structure. On comparison of the energies of the structures from the two levels of theory, it can be seen that this is the case: the energy has indeed decreased quite considerably on higher level optimisation.
Table 1
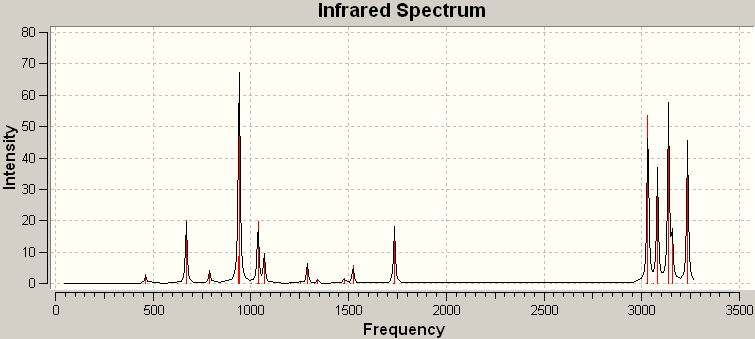
However, confirmation that the structure is definitely an energy minimum requires calculation of the frequencies of vibrations present within the molecule. The IR spectrum of the optimised anti structure is shown below. As can be seen, all vibrations are real and positive, and therefore the modelled structure is indeed an energy minimum. If the structure was in fact a transition state, negative, imaginary frequencies would be seen. This is because one or more vibrational mode will involve the stretching or bending of a bond, or bonds, that are not yet properly formed, and therefore, their corresponding energies must be guessed.
Figure 6
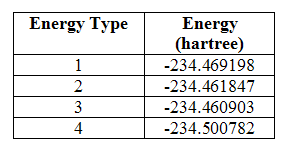
In addition to this, data provided in the output of a calculation of the frequencies includes four energy values: the sum of the electronic and zero-point energies (1), the sum of the electronic and thermal energies (2), the sum of the electronic and thermal enthalpies (3) and the sum of the electronic and free energies (4). These were given as:
Table 2
These values are very important when it comes to calculating the activation energy of the reaction in which it is involved. The anti 2 structure is the reactant of the Cope rearrangement, and it is therefore, these energies from which the transition state energies must be compared. There is more discussion of this later.
These energies are very marginally higher than those given in the Results Table. However, the difference is not considered great enough (the largest discrepancy is only 0.0056kcal/mol) to suggest a different energy minimum structure has been formed, especially as the initial 3-21G optimised structure used were of the same energy. However, it can provide an indication of the level of success of the optimisation and this slight difference must be remembered during later analysis and comparison.
Optimising the Chair and Boat Transition Structures
As mentioned above, the Cope rearrangement can proceed via a chair or boat transition state. Computer modelling can be used to predict the structure and energy of these transition states, and allow for the activation energy to be calculated when occurring through each of the two states. Though not to be applied in this case, this can then allow for the determination of the thermodynamic versus kinetic product of a reaction: the kinetic product has the lower energy transition state.
There are two different methods for the location of an energy minimum transition state, each requiring a different input. The first, the Berny method, takes the structural fragments involved in forming the transition state and locates and calculates its structure and energy from these. They are separated by the bonds yet to be broken or formed, and it is these reaction coordinates, together with the rest of the structure, that are to be optimised. The second, the QST2 method takes optimised structures of the reactants and products, and the transition state structure is located and optimised from these. In both cases, the input structure(s) must be arranged in such a way that resembles the transition state structure fairly closely for the calculation to be a success.
Both the chair and boat transition states in the Cope rearrangement consist of two C3H5 allyl fragments positioned about 2.2Ǻ apart, with either C2h symmetry as in the chair transition state or C2v as in the boat.
The Chair – Force Calculation and the Redundant-Coordinate Editor – the Berny Optimisation Method
The first method described above can also be approached in one of two ways. The first of these involves calculation of the force constant matrix. In order to initially optimise a transition state, the reaction coordinate must be located and this is made easier if a reasonably accurate guess at the structure is first provided. The force constant can then be calculated at the first step and adapted as the optimisation of the whole structure proceeds. However, this carries the risk that a structure is located as a local energy minimum that is not correct. This will occur because the change in curvature of the potential energy surface is great enough (there must be a certain cut off point set by the software) for it to optimise to that point and structure.
If a reaction coordinate is ‘frozen’, however, the structure of the input transition state will be unable to ‘move’ enough for an alternative minimum to be found. The calculation will be forced to optimise only the rest of the structure, the possible energy minima forms of which will be much less. Following the optimisation of the rest of the structure, the reaction coordinate can then be ‘released’ and this optimised. This is done using the redundant coordinate editor and is the second of the two possible approaches to a Berny transition state optimisation. Both of these approaches were carried out on the ‘chair’ structure of the Cope rearrangement transition state.
Initially, the optimisation calculation was set up using a structure that had been created manually and then improved slightly by setting the bond forming/breaking distances to 2.2Ǻ using the ‘modify bond’ tool in Gaussview. This was optimised to a Berny transition state with calculation of the force constant at the start of the optimisation, and a frequency calculation was run. The method used was Hartree Fock, and the basis set 3-21G. There was, as required, a single negative frequency of vibration. This has been pictured below (figure 7), and it can be seen that it is the vibration corresponding to the Cope rearrangement. It has a frequency of -817.952cm-1.
Figure 7
Figure 7 also shows the geometry of the resulting structure, and it can be seen that the chair structure has indeed been adopted. There is more detailed analysis of its geometry below. This transition state has an energy of -231.61932249 a.u.
Due to the success of this calculation (the correct structure of the transition state has been located), it would be suitable for use in higher level optimisations and any further analysis or calculation that is required. However, the transition state was also located and optimised by freezing and then optimising the reaction coordinate.
The reaction coordinates, in this case the distance between the terminal carbons of each allyl fragment, were frozen to 2.2Ǻ. The transition state was optimised to a minimum (a minimum is now used because the reaction coordinate of the transition state cannot be optimised), and a structure was produced very similar to that following the initial ‘force constant’ calculation, although the bond forming/breaking distances were exactly 2.2Ǻ. The reaction coordinates were then released, and a calculation set up that optimised the entire structure but also, and most importantly, the reaction coordinates. Again, the final optimised structure appeared just as that after the initial optimisation with force constant calculation. However, more detailed analysis showed there were some slight geometric differences and the energy was also slightly greater, now -231.61932239 a.u, (although the difference between their energies is exceptionally small and not considered great enough to be significant.)
Table 3 compares some important geometric parameters of the two:
Table 3
The first important result from the table above is that not all the C-C bond lengths are equal: the force constant calculation method showed all bond lengths to be different, meaning the transition state had no C2 axis, nor σh plane of symmetry; the ‘redundant co-ordinate editor’ calculation method showed the two bonds within each allyl fragment to be different, but the same differences were seen in both fragments. This gave the transition state structure C2 symmetry. These results are a little strange, but are perhaps simply because there is not yet full electron conjugation throughout the two fragments. Higher level optimisation should, and does, rectify the problem. Furthermore, the differences between the lengths are very small, and it does not seem to have had any considerable effect on the energies, which are both the same as those given in Appendix 1. The bond forming/breaking distances are slightly greater following force constant calculation, which may have caused the slight variation in energy. Again, however, the difference is not great.
The Boat – the QST2 Optimisation Method
The boat transition state was optimised using the alternative method described above: the QST2optimisation method. In this method, the calculation must know what reaction has actually occurred: this requires both the structure of the product(s) in, as shall be seen, an appropriate orientation. In order to show it what reaction has occurred, it must know the changes that have occurred at each atom in going from the product to the reactant. This is done by appropriately labelling the atoms in the two structures so that they match up. It will then, hopefully, be able to create a transition structure for it.
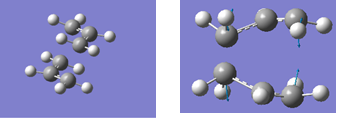
In the initial attempt at locating the boat transition state, the anti 2 structure was used. However, it was clear from the result that the boat structure could not be located with the reactant and product molecules arranged in this way (rotation around the central bond was not even considered, let alone tested). Just as with the redundant coordinate editor and Berny optimisation method, therefore, the calculation must be assisted by providing initial geometries close to the transition state it is to locate and optimise. The 1,d-hexadiene product and reactant molecules were, therefore, adapted to be more like the boat transition structure. The input structures appeared as follows.
Figure 8
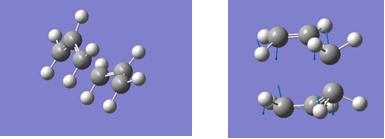
The calculation was then set up to minimise to a QST2 transition state and the resulting structure was much more successful: the boat conformation had clearly been located. If this had not succeeded, the QST3 method could have been applied, which allows for the additional input of a transition state structure. This helps the location of the correct structure and a better, and faster, optimisation. The final structure is shown below, together with a visualisation of the negative vibration corresponding to the Cope rearrangement. The structure has energy -231.60280219cm-1, and the expected C2v symmetry. The frequency of the vibration was a much greater -839.558cm-1.
Figure 9
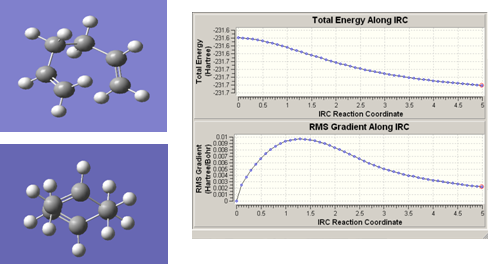
On analysis of the chair and boat transition state, it is apparent that it is impossible to determine the geometry of the hexadiene molecule from which they were formed. However, IRC calculations can be used to determine this. IRC calculations provide a reactant structure by creating a ‘geometric path’ from the transition state (small geometry steps are taken to create this), that tracks the potential energy surface where the gradient is steepest. The success of this calculation depends, among other things, on the number of geometric steps it takes. An initial calculation was carried out on the chair transition state, in which 50 points were used. This gave the following conformation of hexadiene, which can perhaps give some indication of which structure will be seen. The IRC graph, however, shows that a minimum reactant structure has not yet been reached: the two lines are not yet straight.
Figure 10
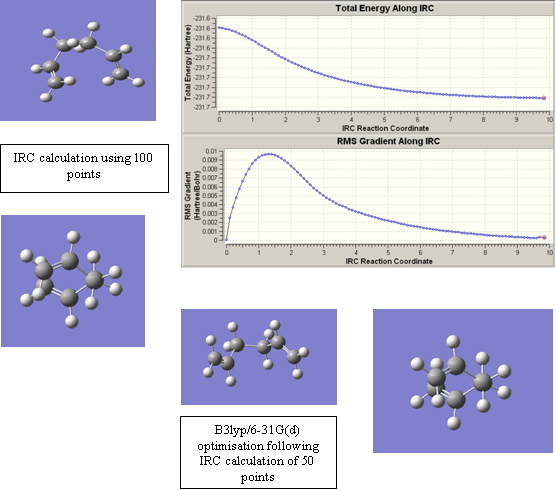
In order to improve on this, the structure can then either be optimised to a minimum as normal, or more steps can be taken. Another option is to calculate the force constants at every step but this was not done. The optimisation to a minimum used the B3lyp/6-31G(d) method and basis set and the new IRC calculation used 100 points. The results from these improvement changes are shown in figure 11.
Figure 11
As can be seen, the resulting structures are extremely similar following the two different methods, and the IRC graph now shows a minimum has been reached (the line is now straight). This minimum appears to be the gauche 2 conformation. However, the results should, (I think!), have given the anti 2 conformation instead. The reason it did not is because Newman projections of the gauche 2 conformation show the three atoms that make up the allyl fragments of the transition state are all ready orientated relative to each other in a, slightly distorted, chair arrangement. This means, that small geometry steps from a chair transition state, will arrive first at the gauche 2 as an energy minimum reactant structure (it is structurally the most similar conformation to the transition state). Perhaps the anti structure would have been formed if force constants had been calculated at every step. (I don’t quite understand this, wouldn’t the gauche 2 obviously form? But surely the anti structure should have been formed if that is what we then used for the activation energy calculation?)
An important application of a located transition state and its energy is in the subsequent calculation of the activation energy of the reaction in which it appears. However, computer modeling uses a number of approximations and assumptions, and therefore its predictions often differ from experimental results. Comparison with experimental results can show up limitations with the modeling software, which can allow improvements to be made or show what errors must be taken into account when calculating activation energies of other reactions. For reasonable comparison to be made, the transition states must be first be optimised using a higher level of theory than that of the HF/3-21G. In addition to this, a frequency calculation must be run in order to provide the energies required. In this case, the boat and chair transition states were optimised using the DFT level of theory and B3lyp/6-31G* method and basis set. Images of the resulting structures are shown below:
chairhighopt |
Chair
boathighopt |
Boat
The activation energy is the energy difference between the reactant structure and transition state structure. However, the energy of the reactant and transition state varies with temperature, and therefore, it is essential that the correct energy values are used in any comparisons. The energies provided in the output following a frequency calculation are those at 298.15K, which have been computed using certain ‘correction’ figures. However, one figure that remains the same whatever the temperature used, is the sum of the electronic and zero-point energies. The zero-point energy is simply the energy of the molecule at 0K and so will, by definition, be unchanged by variations in external temperature. If the same structure is started with, the zero-point energy should always be the same. The value for the sum of the electronic and zero-point energies provided in the output can, therefore, be used to provide an activation energy for the reaction at 0K. This can then be compared to experimental results.
If the activation energy is required for higher temperatures, it is the sum of the electronic and thermal energies value that must be used for both reactant and product. This value has taken into account the changes in total energy that will be seen if heat is put into the system. Increased temperatures will result in a faster translation for the molecules, faster vibration, faster rotation and so on.
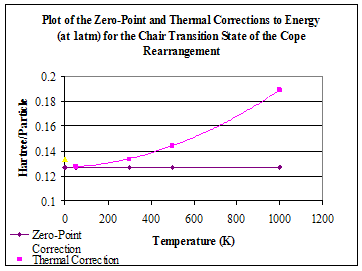
As an extra investigation, the freqchk function provided by Gaussian was used to obtain energy value at a range of various temperatures. The output of this calculation gives the correction figures that must be applied to the electronic energy in order to then obtain a value for the type of energy value that is needed. The graph below shows the correction values for the zero-point energy and thermal energy. As expected, the zero-point energy correction remains the same whatever the temperature. The thermal energy correction value increases quadratically with temperature.
Figure 12
For some reason, the correction figures at 298.15K, those obtained from the output of the frequency calculation and so not calculated using freqchk, were much greater than what would be expected from the freqchk results and did not fit the pattern whatsoever. The correction figure for the thermal energy (0.147974) was greater than that at 300K. There was also an apparent anomaly (shown in yellow) with the result at 0K, although this was calculated using freqchk. The thermal correction value for this was greater than 50K, and only just below that of 300K. However, it must be remembered that at 0K, there is no thermal energy and perhaps the functions used in the calculation cannot be applied at that temperature. There are also the usual problems associated with the use of a value of 0 in calculations, which may have effected the result. It would perhaps have been more suitable to use 0.5K, for example. (Is this right? I may also have done something wrong!! The results couldn’t be saved so I couldn’t check them).
For this comparison, however, only the energy values at 0K and 298.15K are required. The table below provides these values for the chair and boat transition states (the numbers apply to the type of energies described earlier – they are all obtained through a B3lyp/6-31G* optimisation and frequency calculation):
Table 4
These values can then be used to calculate the activation energy of reaction through the two states by subtracting the energy of the transition states from the reactant and converting the resulting figure to kcal/mol by multiplication by 627.509. The results of this are shown below together with the experimental values measured at 0K[3]:
Table 5
It can be seen that the modeled results have overestimated the chair transition state at 0K but quite considerably underestimated it for the boat transition state. As the activation energy should decrease on increased temperatures, one can assume that the modeling has also overestimated the energy of the chair structure at 298.15K, and again underestimated it for the boat transition state, although there is no evidence for this. The differences between the modeled results and experimental results are much greater for the boat structure than the chair. It is evidently a lot less stable than thought. Unfortunately not enough is known of how the models work and the theory behind them to provide a proper explanation as to why the differences are seen and there was not really time to look into it fully. However, it is known that the Hartree-Fock level of theory is based on the independent particle model and, therefore, does not take into account electron-electron repulsions. This means it underestimates the average separation of the electrons and overestimates the total energy. This may explain the result for the chair transition state.
These differences highlight the quantitative inaccuracies present in the use of theoretical models, although it is possible to use higher basis sets and perhaps get better results. This also shows how the behaviour of structures and their electronic properties are so much more complicated than can be predicted, and perhaps there are simply too many factors that control these things for perfectly accurate models to ever be produced. There is also the factor, however, that the activation energies are calculated from the anti 2 conformer of the reactant, but, as has been established, it must first rotate into an orientation suitable to adopt the transition state structure and this will require an input of energy.
The results from the higher level optimisation also allow for another comparison to be made: that between the geometries and energies of the structures now and those following the lower level optimisation. The table below compares these figures:
Table 6
As with the anti 2 structures, there is considerable lowering of energies in both structures following higher level optimisation. There is also an increase in all the C-C bond lengths of the allylic fragments in both structures and they are now all equal. This change suggests better conjugation and may be a reason for the lowering of energy. The bond forming/breaking distances change in differing ways, however. In the boat transition structure, this distance is increased quite considerably; in the chair transition structure, it is decreased. This effect is seen perhaps because the boat transition structure experiences greater steric repulsion if the fragments are put close together.
The Diels-Alder Cycloaddition – Ethylene and cis-Butadiene
Introduction
Cycloaddition reactions are another example of a pericyclic reaction and involve the joining together of two or more conjugated systems, with the formation of two or more new sigma bonds. Consequentially, there is also reduction in length of the original conjugated systems. As with all pericyclic reactions, they are stereospecific and subject to strict symmetry rules. The Diels-Alder cycloaddition between butadiene and ehtylene is the most simple of all Diels-Alder reactions, and strips it down to its bare essentials[4]. If arrow-pushing is used, the mechanism for the reaction can be shown as follows, although the movement of the electrons is again concerted:
Figure 13
This reaction is can be described as a [4+2] cycloaddition because it involves the movement of four π electrons through one of the components (the π orbitals of the butadiene), and two π electrons through the other (the π bond of the ethylene).
The two sigma bonds are formed from the ‘head-on’ overlap of the p orbitals at the ends of the two conjugated systems. This means that the ethylene must approach from the top or bottom of the butadiene, as shown below, to allow the sigma bond to form:
Figure 14
It can be seen from the dashed lines in figure 14 that the two sigma bonds are forming on the same side of both the butadiene and ethylene molecules. It is also evident that this is the only possibility as neither molecule are long and flexible enough to reach round and form one sigma bond on the other side to the other. This means that this reaction is described as all suprafacial, and is symbolised by the subscript ‘s’ in the new way of ‘labelling’ the reaction: π4s+ π2s. As the reaction can only involve all suprafacial overlap, the type of orbitals with the correct phase and symmetry for this immediately becomes restricted. One symmetry rule states that for a ground state pericyclic change to occur, the total number of (4q+2)s and (4r)a components must odd, where n and q are integers[4]. In this case there is just one (4q+2)s component, in which q=1. In order for the two new sigma bonds to form, the HOMO of one of the components must interact with the LUMO of the other. The reaction will, also, only proceed if there is significant orbital overlap, which requires similar energies and the same symmetry properties.
A ground state transition state of a pericyclic reaction involving 4n+2 electrons (no. of e- = 6, n=1) displays Huckel aromaticity and its transition state, therefore, is associated with a plane of symmetry. It is this plane that is used in determining the symmetry properties of the orbitals that may be involved.
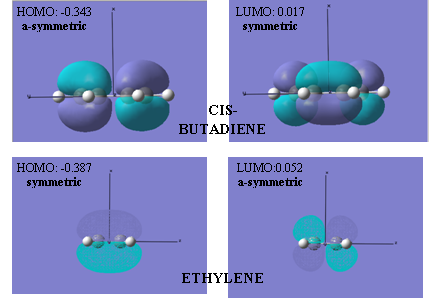
Figure 15 below pictures the required orbitals and gives their symmetries, respective to the plane parallel to the x-axis pointing up.
Figure 15
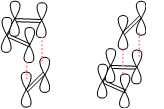
It can now be seen, therefore, that this cycloaddition reaction is ‘symmetry-allowed’ with overlap of the HOMO of butadiene and LUMO of ethylene and the LUMO of butadiene and HOMO of ethylene. The transition states of these two alternatives are shown below:
Figure 16
For comparison purposes, it can be shown that concerted overlap between the HOMOs of both components is not possible because on one side there is a repulsion between the p-orbitals of the two components. The sigma bond cannot, therefore, form at the same times as the other and the reaction would have to occur stepwise. This explains why overlap of orbitals of different symmetry is ‘symmetry-forbidden’ in pericyclic reactions:
Figure 17
Optimising the Transition State
Now that the symmetry rules have been established, the transition state for the reaction must be located. As with the boat and chair transition states for the Cope rearrangement, this can again be done with either the fragment and Berny transition state method or the reactant and product QST2 method. It was decided that both would be attempted to ensure they both could be done and perhaps examine any differences between the results.
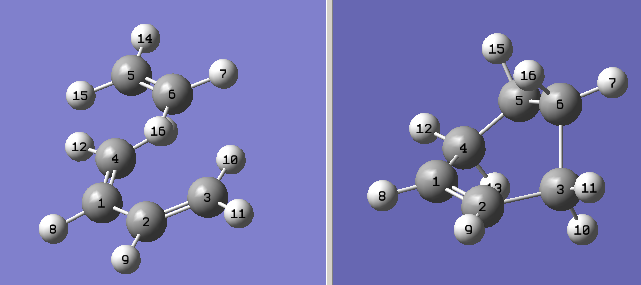
The first method was carried out first. The initial guess at the transition state structure was constructed by taking the bicyclic structure provided and removing the bottom CH2CH2 fragment and the bond that is yet to be formed. The distance between the carbons involved in the bond forming process were set at approximately 2.2Ǻ apart. Although it was considered that the guessed geometry was fairly accurate and simply calculating the force constant once may have provided a reasonable structure, it was decided that the reaction coordinate would be frozen immediately. Therefore, the carbons involved in the bond forming process were frozen to 2.2Ǻ and the structure then optimised to a minimum. This initial low level optimisation used the Hartree-Fock method and 3-21G basis set. The resulting geometry was very similar to the initial guess, although slight ‘neatening up’ changes had clearly occurred.
The reaction coordinate and transition state structure were then optimised with a calculation of the derivative of the reaction coordinate, and HF/3-21G Berny optimisation to a transition state. The frequency calculation was also run. The frequency calculation was run to confirm the resulting structure was a transition state. Just for precaution sake, the keyword opt=noeigen was entered to ensure the calculation would be completed even if the geometry was not quite as good as thought. If the calculation was not successful, the results from this would show what then needed to be changed to better the input structure.
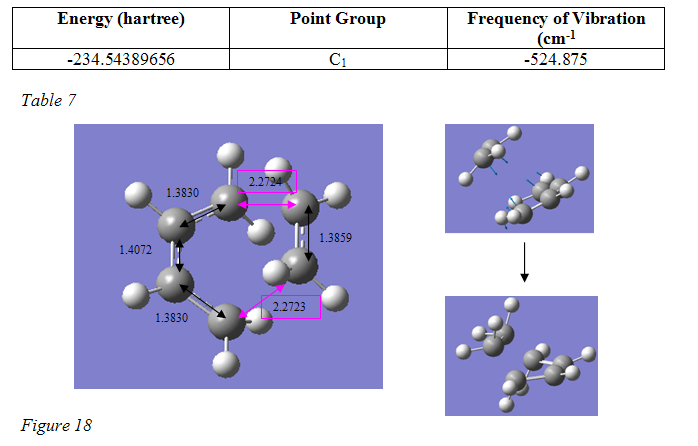
However, the resulting transition state did show the correct geometry and a single vibration was present, which clearly represented the reaction about to occur (figure 18 below). There were, however, parts of the structure that were a very unexpected. The input structure of the transition state was drawn with one double bond between the central carbons in cyclobutadiene and a single bond in the ethylene. The optimised output structure, on the other hand, showed a conjugated bond between the central carbons in butadiene, and then double bonds between the terminal carbons and a double bond in the ethylene. If I understand correctly, however, the bonds shown in Gaussview have little significance, and so this should not be a problem. ??Is this right?? – the calculation did work fine so I presume it is.
As the vibration and energy of the structure appeared reasonable, the process was continued anyway. It was optimised again using the higher B3lyp/6-31G* method and basis set and another frequency calculation was run. The resulting structure appeared as shown in figure 18. On the picture are shown important bond lengths, and the reacting coordinate bond distances. The energy, point group, negative vibrational frequency and a visualisation of the vibrational mode are also given:
Analysis of these results follows the description of the second method, that of the QST2 method.
First, optimised structures of butadiene and ethylene were put into a window in a Gaussview molgroup. The ethylene molecule was placed directly above the ends of the conjugated system of the butadiene about 2.2 Ǻ away, though this was only set using the ‘modify bond’ tool in Gaussview. Added to this was an optimised molecule of cylcohexene. As with the ‘boat’ transition state, the atoms were labelled so that they all matched up. The input appeared as follows:
Figure 19
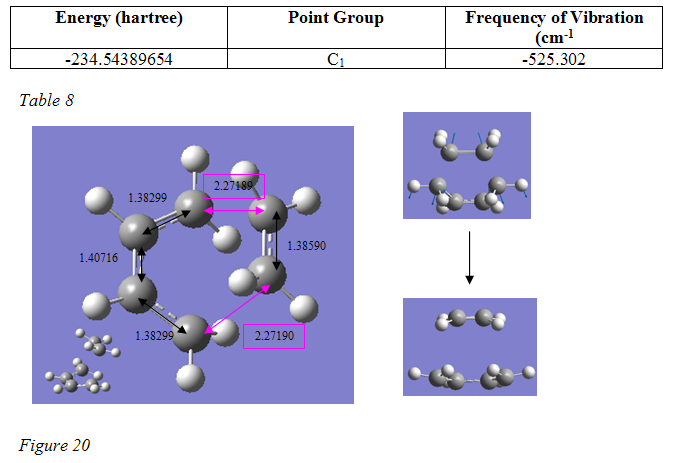
This was then submitted for a QST2 transition state optimisation, using the HF/3-21G method and basis set. Fortunately, the calculation was a success and again a single negative frequency was shown, clearly representing the cycloaddition reaction. The transition state provided had an overall geometry just like that from the first method. This was optimised again, this time to a Berny transition state using the higher level B3lyp/6-31G* method and basis set. The resulting structure, important parameters, and vibrational mode are shown in figure 20.
version1 |
On comparison of the results from the two methods, it can be seen that the two methods give extremely similar results, which should, of course, be the case. It can be seen that in both cases, the transition states have an open envelope-type structure, resulting from the ethylene approaching from the top or bottom of the butadiene, parallel to its sigma bonds.
The bond lengths provide for very interesting analysis. A normal sp3 C-C sigma bond is 1.54Ǻ, and a normal sp2 C=C pi bond length is 1.35 Ǻ[5]. It can be seen therefore, that the two terminal bond lengths of the butadiene and the ethylene bond length are a little longer than a full double bond but considerably less than a proper single bond. The middle C-C bond in the butadiene molecule is slightly less than a proper single bond, but considerably more than a double bond. This can show absolutely, therefore, that the structures shown are transition states for the Diels-Alder reaction that is about to occur.
The bond lengths of an optimised transition state can also illustrate the stage of the reaction at which the energy minimum transition state is formed. (This is, of course, the highest energy point during the reaction.). One would conclude from the bond length results, that the transition states represent the reaction at a fairly early stage. This can also be inferred form the bond forming distances (2.27Ǻ), which are much greater than a C-C single bond. Indeed, the van der Waals radius for a carbon atom is only 1.70Ǻ, which implies that when drawn as above, there is no overlap at all. However, when the vibration is taken into account, at one point the atoms are considerably closer and enough overlap is possible so that the flow of electrons can occur and allow the reaction to happen.
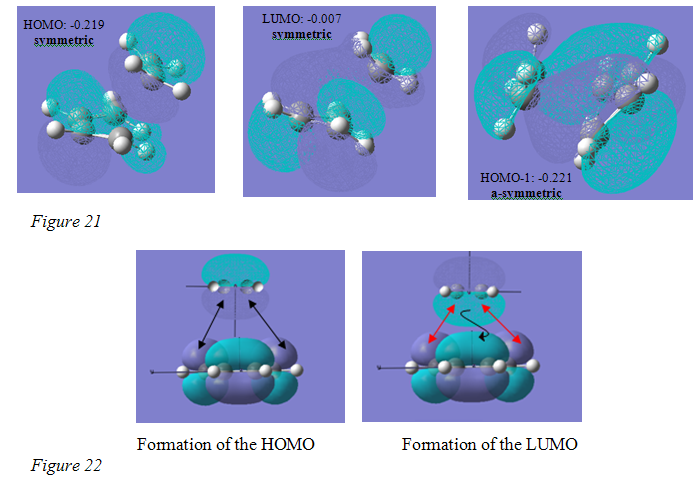
Analysis of the MOs is also very useful in providing information regarding the mechanisms of the reaction. The shape of the MOs were exactly the same from both methods, differing in relative energies by 0.001 on only one occasion, and therefore, only one set of pictures are shown. These are the MOs of the transition state formed from the QST2 method. The HOMO of the transition state is shown to be symmetric with respect the plane (figure 21 below).
It can be concluded from the pictures shown in figure 21 that it is the overlap of the HOMO of the ethylene and LUMO of the butadiene that results in the formation of this molecular orbital. The HOMO of the transition state shows a bonding pi orbital lobe on the ethylene and a bonding pi orbital on the central carbon atoms of the butadiene. These are lobes seen previously in the HOMO of the ethylene and LUMO of butadiene. The pi orbital seen on the butadiene is initially unoccupied because that central bond is the single bond. On reaction with ethylene, there is overlap of the underside of the ethylene HOMO with the two smaller lobes on the terminal carbon atoms of the LUMO of the butadiene, all of which have the same phase. This occupies the bonding pi orbital between the central carbon atoms, resulting in the formation, or partial formation, of a double bond. It is this double bond character that proves the mechanism for the reaction expected to occur will happen and explains why its bond length is shorter than that of a normal C-C single bond.
Figure 22 shows the overlap that is occurring to forming the HOMO of the transition state. The reaction is symmetry allowed because both these orbitals are symmetric with respect to the plane, and as can be seen orbitals of the same phase match up perfectly. (Please note that the phase of the orbitals (the colours) between the orbital pictures in figure 21 and figure 22 sometimes do not match – this should be ignored – they bear no relation to each other in this respect).
The LUMO of the transition state also shows that it is the ethylene HOMO and butadiene LUMO that are involved in the formation of the frontier orbitals because it is clearly the orbital that is formed if all the phases on either the ethylene or butadiene MOs are reversed. Figure 22 again shows what is occurring with the red arrows showing the approach of oppositely phased orbitals, which will repel and fail to overlap. The black arrow shows how the orbital on the underside of the ethylene HOMO has reached over and overlapped with the pi orbital present on the central carbon atoms of the butadiene, which is of the same phase. This is the strangely shaped, large purple orbital lobe that can be seen in the transition state LUMO.
The HOMO-1 orbital of the transition state is a very interesting orbital and very useful at showing the distortion of the butadiene HOMO orbitals towards the LUMO of the ethylene as the overlap and bonds start to form. It shows that there is some overlap, although it is not yet advanced enough for the bond to be formed. The distorted orbitals still have substantial pi character and will explain the relatively low values obtained for the terminal butadiene C-C bond lengths. It appears that it is the HOMO-1 that results from the alternative symmetry-allowed overlap between the LUMO of the ethylene and HOMO of the butadiene. These orbitals are more similar in energy than the ethylene HOMO and butadiene LUMO, and so it would make sense for their overlap to result in a slightly lower energy MO.
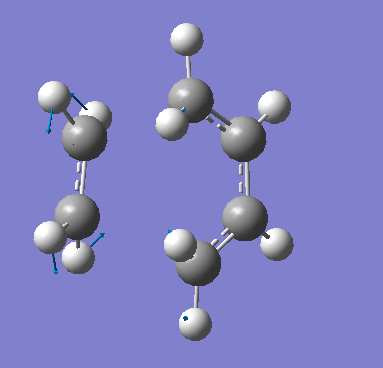
The vibrational mode that corresponds to the reaction path at the transition state shows the formation of the two bonds to be synchronous. This would be as expected because both reactant molecules are symmetric with respect to the plane used previously. In a concerted reaction between completely symmetric reactant molecules, there would be no reason for one bond to have developed to a greater extent than the other when the energy minimum transition state is formed. The lowest energy positive vibration, on the other hand, appeared as visualised in figure 23. This shows an asynchronous bond formation: at each extreme of the vibration, one end of the ethylene molecule is closer to the nearby butadiene carbon bond than the other. (?I’m not sure about this – I’m not entirely sure that this means its asynchronous because the when the ethylene moves close to the butadiene at each extreme, this distance is the same on both sides?). The mode of the vibration is also different, with neither molecule distorting from their planar geometry:
Figure 23
The Diels-Alder Cycloaddition – Cyclohexa(1,3)diene and Maleic Anhydride
This example of a Diels-Alder cycloaddition can be used to show the effects of substituents in the rate, stereochemistry and regiochemistry of the reaction. There are two possible products in the reaction between cyclohexadiene and maleic anhydride: the more stable, thermodynamic product, the exo adduct, and the less stable, kinetic product, the endo adduct. The reaction can be shown as follows:
exo endo
Figure 24
Irreversible Diels-Alder cycloadditions are said to be kinetically controlled and so in this reaction the endo product should have the lower energy transition state and should form first.
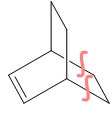
The transitions states for the two adducts must first be located. This was done using the Berny method described above. The initial guess structure was formed by taking the bicyclic structure shown in figure 25 and removing the bonds marked with the wavy lines, thus creating the envelope-like structure again.
Figure 25
The maleic anhydride, minus its double bond, was then positioned next to it pointing in the appropriate direction (either up or down if drawn next to the structure above) to form the two adducts as shown in figure 24. The H2CCH2 group of the maleic anhydride was placed just below the bend in the envelope cyclohexene structure.
It was again decided to freeze certain coordinates in place immediately. The endo and exo adducts can be formed from each other by rotation of the OCOCO group of the maleic anhydride relative to the double bond of the six membered ring. It follows, therefore, that the dihedral angle between the OCOCO carbons of the maleic anhydride and carbons of the alkene bond is what must be fixed to ensure the structure of the adducts remain correct, together with the distance between the fragments. The important distance between the fragments is that between the carbon atoms at the bend of the envelope-structure and the H2CCH2 carbon atoms of the maleic anhydride. This is the reaction coordinate and these were frozen to 2.2Ǻ. The dihedral angle was then also frozen, although no value was initially set. The greater internal angle present in a five-membered ring compared to that in a six prevented them being set to 0o and 180o as these angles could not be possible on both sides of the molecule. An alternative could have been set but since all that had to be ensured was that the maleic anhydride group could not move round to form the other adduct or some alternative structure, it was considered that them simply set in place as they had been drawn would be sufficient.
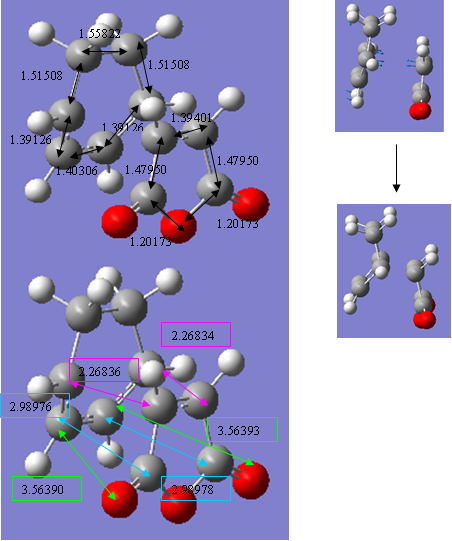
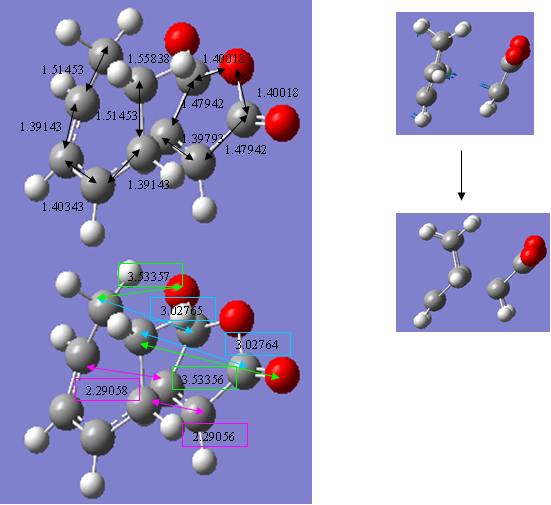
This guess structure was then optimised to a minimum using the HF/3-21G method and basis set. The resulting geometries were clearly that of the endo and exo adducts and so the bond forming distances and dihedral angles were released and the structure optimised to a Berny transition state using the same level of theory. The resulting structures both showed a single negative vibrational mode, which followed the reaction path of the Diels-Alder cycloaddition. Following this successful result, the structures were optimised again using the higher B3lyp/6-31G method and basis sets. The resulting structures appeared as follows, important bond lengths and distances have been added and pictures visualising the negative vibration are shown also. Discussion of these follows. The only slight concerning factor is that the OCOCO group in the exo adduct has not moved down slightly to adopt the more stable ‘open-envelope’ structure five-membered rings usually adopt to relieve strain:
endo |
Figure 26 - endo
exo |
Figure 27 - exo
The table below compares the energy, point group, dihedral angles (between the carbon atoms of the HCCH group and carbon atom of the OCOCO group) and negative vibrational frequency of the two transition state structures.
As can be seen, the energy of the endo transition structure is, as expected, of lower energy than the exo.
However, the difference in energy between them is only 2.56kcal/mol, a surprisingly small value and considerably less than that between the endo and exo transition states involved in the reaction between maleic anhydride and cyclopentadiene, for example. There must be a very fine balance between the factors that stabilise or destabilise one structure relative to the other. Although many factors may contribute in some respect to these relative stabilities, there are two that appear to have the most significant effect.
The first of these is the steric interactions present within the molecule. The exo transition state should suffer from greater steric repulsions than the endo because in the exo structure, the OCOCO group is eclipsed with a H2CCH2 group, whereas in the endo, it is eclipsed with a less bulky HCCH group. This effect will also contribute in detabilising the final exo product. It is interesting to note here that, although the OCOCO group is eclipsed with a more bulky group, it has compensated for this by moving slightly further away from it. The distance between the OCOCO group and HCCH groups in the endo adduct is less, 2.98976(8), shown in the blue boxes, than the 3.02764(5) distances between the OCOCO and H2CCH2 in the exo adduct. However, this is ignoring the effect of the additional hydrogen atoms and these will cause some steric repulsion. Furthermore, the dihedral angle between the eclipsing H2CCH2 and OCOCO groups in the exo structure is slightly less (48.801o) than the eclipsing HCCH group and OCOCO group in the endo structure (54.783o). This may have been made possible by a slight lengthening of the C-C bonds in the maleic anhydride of the endo structure. This would lower the steric repulsions in the endo structure and add more to its relative stabilisation.
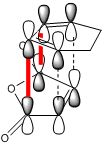
The second of these factors is the secondary orbital interaction believed to be present in the endo structure of the transition state. This secondary orbital overlap affect is usually said to stabilise the endo adduct because it allows for a bonding interaction between the orbitals of the pi bond that is developing in the six membered ring and the orbitals of the carbonyl group of the maleic anhydride below. The diagram below shows how this would appear in the case of the maleic anhydride-cyclohexadiene reaction (the red line is the secondary orbital interaction described):
Figure 28
This favourable secondary interaction does not lead to any formation of bonds but plays an important role in stabilising the endo transition state relative to the exo. It also contributes to speeding the reaction up. In forming the above transition states, the molecules must align in a very precise away and close enough to allow all bonds to be formed at once. This results in a large negative entropy of activation as considerable order must be made in order for the molecules to line up next to each other. Secondary orbital overlap present in some endo transition states helps hold the molecules together until that precise orientation has been found and then pulls the groups close enough to react.
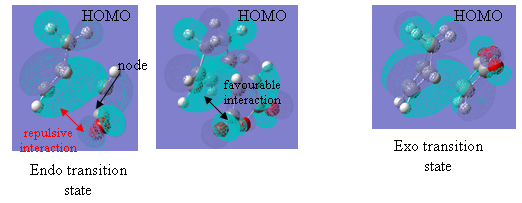
However, molecular orbitals of the transition states show that, in this case, a very different type of interaction is occurring. Figure 29 shows the HOMOs of the two transition states.
Figure 29
The first noticeable feature is the absence of any form of lobe showing the secondary orbital overlap talked about above, although this, it is believed, is as expected because no bonds are actually formed through this interaction. The orbital lobes that are present, however, show simple p-orbitals on the carbonyl and central oxygen atoms of the maleic anhydride, and a bonding pi orbital over the carbonyl carbon and its adjacent carbon. However, this overlap is only on the underside of the anhydride molecule and there is quite clearly a node on the upper side of that carbonyl carbon (see figure 29). The OCOCO group has effectively been separated from the rest of the structure. This is where the secondary interaction is meant to be occurring.
In addition to this, the oxygen p orbitals shown are lying parallel to the plane of the maleic anhydride molecule and the lobe on the left hand side of the oxygen atom and, therefore, the lobe closest to the underside lobes of the cyclohexadiene are of opposite phase. This will result in repulsion and slight destabilisation of the endo transition state. Any favourable interaction with the developing pi bond above can only occur with the right-hand side of the oxygen p-orbital, but this involves covering a fairly long distance and avoiding the closer, oppositely phased orbital. (The degree of this destabilisation is not believed to be great but there is certainly no favourable interaction present in the HOMO).
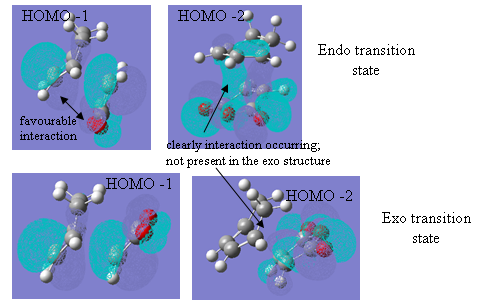
However, the HOMO-1 and HOMO-2 orbitals show that some favourable overlap is still possible, which will reduce the destabilising effects described above to a certain extent. The HOMO-1, in which the p orbitals on the oxygen are now perpendicular to the plane of the molecule and pointing up towards the developing C=C bond, are of the same phase and would result in an allowed and favourable overlap. Furthermore, examination of the HOMO-2 orbital shows a very interesting picture. It can be seen that in the exo-adduct, the HOMO-2 is described purely by interactions within the maleic anhydride molecule. The same orbital in the endo adduct, however, shows a very clear bonding interaction through space between the two molecules. This helps stabilise the molecule and can show how the two molecules are held together by these additional interactions present in the endo adduct. This will also explain the lower C-C bond forming distances shown in the structure pictures above.
Figure 30
Another interesting observation is that the HOMO and HOMO-1 orbitals shown here have appeared to ‘switch over’ with respect to the HOMO and HOMO-1 of the transition states for the ethylene-butadiene reaction. It is thought the reason for this is that the electron-withdrawing effect of the OCOCO group has lowered the energy of the maleic anhydride HOMO orbitals. This has increased the energy gap between the maleic anhydride HOMO and butadiene LUMO, resulting in a weaker overlap and reduced stabilisation. The resulting MO will now be higher in energy than that formed through overlap of the butadiene HOMO and maleic anhydride LUMO.
One can conclude, therefore, that the relative energies of the final products and transition states must be determined by a compromise set up between greater destabilising steric interactions present in the exo adduct and slight destabilising secondary orbital interactions present in the endo transition state. The extent to which these factors play a part are then, themselves, controlled by slight distortions in both structures and the degree of favourable secondary orbital overlap that can occur in the endo form. One must conclude from the energy values obtained in this experiment that it is the lowered steric repulsions in the endo transition state that just win out. This can also show that any destabilising secondary interactions that may be present in the endo structure must be very weak.
Additional Research - the Hajos-Parrish-Eder-Sauer-Wiechert reaction
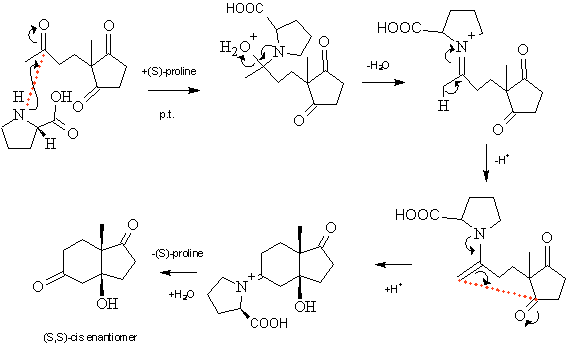
In module 1, https://www.ch.ic.ac.uk/wiki/index.php/Mod:Apple, the stereoselectivity of the Hajos-Parrish-Eder-Sauer-Wiechert reaction was investigated. The reaction appears as follows:
Figure 31
In this reaction, there is almost complete stereoselectivity for the –cis isomer over the –trans, and then further preference for the (S,S) enantiomer of the –cis isomer over the (R,R). Reasons for the cis selectivity have been deliberated over for many years with many propositions for the reaction mechanism being made[6] in an attempt to explain it. It has now been widely accepted that the reaction occurs via an enamine intermediate and transition state (figure 31), the relative energies of which can explain the seen stereoselectivity. As the techniques learnt in this module were not known then, literature transition state structures had to be used to explain the formation of the products that had been modelled and analysed in the mini-research project. It was hoped that now the required analysis could be done independently. Unfortunately, time restraints meant that full analysis of such a complicated transition structure could not be done (see later – one structure was made), so instead analysis was done using the same reaction, but when catalysed by methylamine rather than (S)-proline.
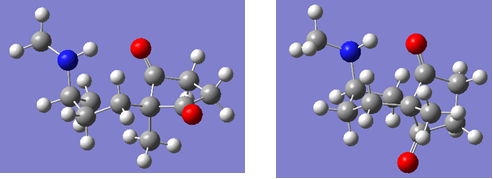
The guess transition structures were formed by taking the product molecule that had been optimised in module 1, and simply removing the bond that was yet to be formed and adding a NH2CH3 group instead of the carbonyl group on the linear chain that is to become the six-membered ring on reaction. What was then important was giving the transition state a negative charge because during the reaction, the reacting carbonyl group picks up a hydrogen atom from the reaction mixture in proton transfer to form the OH group. This reaction mixture is, of course, not present in a computer modelling so it had to be left as an O- atom. (Would it make a difference that the negative charge could not be localised onto the oxygen atom when locating the transition state?)
Forcing the linear carbon chain to adopt a six-membered ring is not a favourable action due to the increased strain that is present in cyclic structures. Therefore, in order for the transition state structure to be held in place and prevent the chain rotating back to a linear form, the bond forming reaction coordinate had to be frozen in place. In both cases, it was frozen to 2.1Ǻ. This structure was then optimised to a minimum using the HF/3-21G method and basis set. Following this, the reaction coordinate was then released, and the structure optimised to a transition state, again using the Berny method and HF/3-21G level of theory. A frequency calculation was also run. The resulting structures appeared as follows:
Cis lowopt |
Cis isomer
Trans lowopt |
Trans isomer
Figure 32
The cis isomer transition state is supposedly more stable than the trans for two reasons. Firstly, there are considerably greater diaxial interactions present in the trans, a result of having a bulky axially orientated methyl group, rather than equatorially orientated as seen in the cis. Secondly the orientations of the soon-to-be six membered ring and five membered ring in the cis isomer are meant to allow for a shorter and, therefore, stronger hydrogen bond between the enamine NH hydrogen and CO oxygen of the carbonyl group undergoing reaction. This stabilises the structure and holds reacting centres in closer proximity and a better orientation.
The results from this calculation did indeed show the cis isomer to be lower in energy than the trans: -627.60576340 a.u. as compared to -627.56165309 a.u. The bond forming distance was also considerably less in the cis: 2.41970Ǻ as compared to 2.96465Ǻ. It may at first appear that these distances are too great, especially in the trans isomer, to suggest any interaction can be present, but, as shall be seen, vibrational and molecular orbital analysis appear to show that they are.
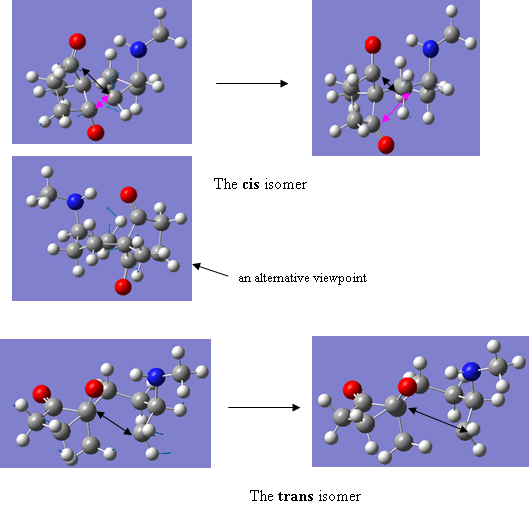
However, further analysis of the geometries and vibrational modes of the structures indicated that something had, in fact, gone slightly array. The NH-OC hydrogen bond distances, meant to be lower in the cis isomer, were a greater 2.03704Ǻ compared to 2.02500Ǻ in the trans. It was then noticed that the five membered ring in the cis isomer, on release of the reaction coordinate, had rotated around so that both carbonyl groups were equidistant from the reacting alkene bond. This would not be so possible in the trans isomer because the positioning of the methyl group blocks the rotation and forces the five-membered ring into an orientation that renders the second carbonyl group inaccessible. On visualising the negative vibration for the cis isomer, it can be seen that the movement is actually rotation of the five membered ring that brings both carbonyl groups towards the alkene bond. The terminal carbon of the alkene bond similarly rotates. What should happen is the vibration shown for the trans isomer below those of the cis: this clearly shows the movement of the alkene bond towards the only accessible carbonyl group of the five-membered ring. It is thought that the cis isomer transition state was lower in energy then the trans purely because of the effects of diaxial interactions, although the errors associated with the cis isomer transition state will have greatly affected its energy, making any form of comparison a little suspect.
Figure 33
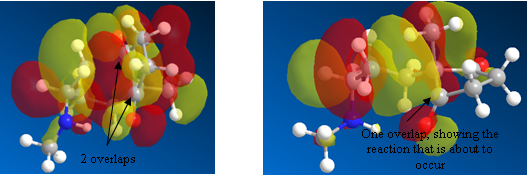
The same conclusions can be drawn from analysis of the HOMOs of the two structures. It can be seen that the large red, pi orbital of the reacting alkene bond has overlapped with the carbons of both carbonyl groups (figure 34). The HOMO of the trans isomer shows perfectly the distortion of this pi orbital (lobe now yellow) as it starts to overlap and form a sigma bond to the carbonyl carbon atom. Very interesting, further analysis could be made of these MOs, but unfortunately time (and energy!) restraints made it not possible. Hopefully, full analysis can be made of these sometime in the future.
Figure 34
Unfortunately, there was not time to attempt it again, but if it were, more coordinates would be frozen in to try and force the correct structure of the –cis transition state and perhaps the reacting coordinates will be shortened a little. (This was tried: it was shortened to 1.8Ǻ, but the results were a disaster - perhaps 1.95Ǻ would be suitable?).
SIDE THOUGHT (printed in italics): It has just suddenly occurred to me what this may mean. (Note, however, this thought arrived very late in the day. I have to hand the report in now and so I have been unable to look into, or check it, properly. It may be completely wrong, especially because I only had still images available.)
Hajos and Parrish[7], who first carried out the reaction and characterised its product stated that a single crystal x-ray diffraction study had shown the –cis product to in fact have an axially orientated methyl and equatorial hydroxyl or O-. However, all subsequent literature, including the work by Houk and Cheong[8], which provided an explanation for the (S,S) enantiomeric selectivity of the cis isomer over the (R,R), used structures with an equatorial methyl and axial hydroxyl group. They made no reference to the alternative confomer that had been produced by Hajos and Parrish. Houk and Cheong’s conformer should, of course, be the more stable.
This caused great confusion in module 1: both were made and analysed and shown to be (S,S) enantiomers and yet initially, the connection between them could not be found. When the connection was finally discovered, the reasons for it not to be mentioned, let alone discussed, in the literature was not (and still is not) fully understood. However, the results here have made me think that perhaps two conformers can be formed because reaction is possible at both carbonyl groups. Attack at one carbonyl gives one conformer, and attack at the other carbonyl gives the other conformer. In fact, if both are produced, which could very well be the case, this is another reason for the cis selectivity: the alkene bond can attack at two carbon centres rather than one. There is another possibility. Brief examination of the pictures can also suggest that attack at one would form a chair structure in the partially formed six membered ring of the transition state, and attack at the other would form the less stable boat. Perhaps this would mean two could form, but only one does. This is just a thought, but I shall look into it and see what results I get.
It was finally attempted to try and get one transition state structure for the actual Hajos-Parrish-Eder-Sauer-Wiechert reaction, that catalysed by (S)-proline.
The initial guess structure was created with the assistance of those shown by Houk and Cheong[8], who examined the preference of the S,S enantiomer over the R,R in this reaction. (Note, as mentioned above, they did not seem to actually use the correct conformer of the (S,S) and (R,R) enantiomer in their analysis.) Certain angles given in the literature were set using the ‘modify angle’ tool in Gaussview, though these were not frozen.
Certain coordinates were then frozen, however: the bond forming distance was set to 2.2Ǻ, the hydrogen bond was set to 1.5Ǻ and the OH bond of the proline caboxylic acid group was set to 1.1Ǻ. In this example, it was decided not to add a charge to see what happened. This was then optimised to a minimum using the HF/3-21G basis set. In order to try and get the calculation to run at all costs, the additional keyword opt=noeigen was added. The result appeared to be a success so all coordinates were released. The structure was optimised to a Berny transition state, again using the HF/3-21G method and basis set, and a frequency calculation was also run.
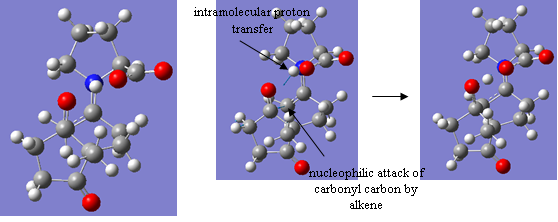
The result was absolutely wonderful!! Firstly, the structure created was with the correct geometry expected for the transition state. But, in addition to this, the vibrational mode showed not only the alkene bond correctly moving towards the carbonyl carbon it will soon attack but also an intramolecular proton transfer from the HO of the carboxylic acid group of proline to the oxygen of the carbonyl group undergoing attack. Of course, this is not how the mechanism would actually work, and the proton picked up by the oxygen could come from anywhere but it shows that a complete product structure can be formed from this transition state alone and no charge. The structure and vibrational mode are shown below:
Projss lowopt |
'Figure 35
The reacting bond distance in this transition state was a much more realistic 2.00107Ǻ and its energy was -928.93457010 a.u. In this reaction, the transition states are stabilised by hydrogen bonding between the reacting CO and HO of the carboxylic acid group on the (S)-proline. The hydrogen bond seen in the structures above is no longer present, because (S)-proline is a secondary amine, and so the hydrogen required for that bond is not there. However, the effects of the hydrogen bond are the same and it is again this hydrogen bond that is the cause for the preference of the (S,S) enantiomer over the R,R: in the (S,S) enantiomer, the CO and OH groups undergoing hydrogen bonding are anti to each other rather than syn, which creates a slightly longer hydrogen bond but a much more favourable planar enamine geometry (further details can be found at https://www.ch.ic.ac.uk/wiki/index.php/Mod:Apple). There was not time to create the (R,R) enantiomer so comparisons cannot be made but when it is done, hopefully, it will be shown to be slightly higher in energy and the distortion to the enamine group will be seen.
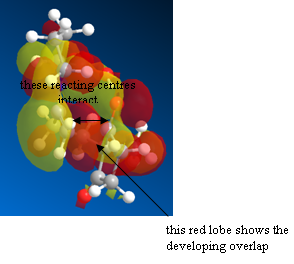
The HOMO of the transition state shows also the overlap present between the alkene bond and carbonyl carbon atom that shall soon form a full sigma bond and allow for the formation of the product.
Figure 36
Conclusion
It can be concluded from this report that reaction transition states can be located and optimised using two main methods, the Berny with force constant calculation and redundant coordinate editor method and the QST2 method. The results from these can then be applied to provide key information regarding the kinetics and thermodynamics of a reaction. This is especially important when it comes to explaining reactions such as the Diels-Alder cycloaddition when electron withdrawing or donating substituents are present on the molecules, as analysis of the energies of the products and reactants alone does not always explain observed results. In other words, kinetically controlled reactions can only be explored this way. The results produced are, however, based on assumptions and approximations, and the quantitative accuracy of computer modelling at this level is somewhat limited.
However, completing this module has filled wonderfully the hole in my knowledge that was present while doing modules 1 and 2, where I could only optimise and analyse products and reactants. As with the other modules, I have greatly enjoyed doing it and I hope to answer the questions that have been raised in the report, especially those brought up in the additional research section.
References
- ↑ 1.0 1.1 Molecular Physics, Paper No. 4, 2002, vol. 100 (441-446) – B. Roque, J. Gonzales and H. Schaefer Cite error: Invalid
<ref>tag; name "hexa1" defined multiple times with different content - ↑ J. Am. Chem. Soc., 1995, vol. 117 (1738-1788) – B. Gung, Z. Zhu and R. Fouch
- ↑ http://www.ch.ic.ac.uk/wiki/index.php/Mod:phys3
- ↑ 4.0 4.1 Pericyclic REactions, Oxford Chemistry Primer - Oxford Science Publications and the Oxford University Press, 1999 – Ian Fleming Cite error: Invalid
<ref>tag; name "book" defined multiple times with different content - ↑ http://en.wikipedia.org/wiki/Bond_length
- ↑ PNAS, Paper No. 16, 2004, vol. 101 (5839-5984) – B. List, L. Hoang and H. Martin
- ↑ J. Org. Chem., 1974, vol. 39, paper no. 12 – Z. Hajos and D. Parrish
- ↑ 8.0 8.1 SYNTHESIS, Paper No. 9, 2005, (1533-1537) DOI: 10.1055/s-2005-865332– P. Cheong, K. N. Houk Cite error: Invalid
<ref>tag; name "research1" defined multiple times with different content


